
 ?Mathematical formulae have been encoded as MathML and are displayed in this HTML version using MathJax in order to improve their display. Uncheck the box to turn MathJax off. This feature requires Javascript. Click on a formula to zoom.
Abstract
Freeze-thaw erosion is one of the main ways of soil erosion in three major erosion types, which are related to the development of regional economy and the protection of ecological environment. Therefore, its research is particularly important. This paper uses the Yalu Tsangpo River basin as the research area. The range of the freeze-thaw erosion area in the Yalu Tsangpo River basin was defined by using Shuttle Radar Topography Mission-Digital Elevation Model (STRM-DEM) data. Six factors, namely, annual temperature difference, annual precipitation, slope, aspect, vegetation coverage, and elevation, were selected as the evaluation indexes of the intensity of freeze-thaw erosion. Analytic hierarchy process (AHP) was used to determine the weight of each factor. A comprehensive evaluation index model was employed to obtain the range of freeze-thaw erosion intensity. The natural breaks method in ArcGIS was applied to grade the result. The classification chart of the freeze-thaw erosion intensity of the Yalu Tsangpo River basin was drawn to show the distribution of freeze-thaw erosion. Results showed that (1) the total area of freeze-thaw erosion in the Yalu Tsangpo River basin is 229,231.80 km2, which accounts for 93.5% of the total area of the Yalu Tsangpo River basin, with mild erosion and moderate erosion. (2) The distribution of freeze-thaw erosion intensity in spatial pattern is obvious; from west to east, the intensity of freeze-thaw erosion increases gradually. Severe erosion is mainly concentrated in the northeast and northern regions of the Yalu Tsangpo River basin. (3) The areas of freeze-thaw erosion are mainly distributed in the temperature zone with the annual temperature range of ≥40 °C, accounting for 86.4% of the total freeze-thaw erosion area. The freeze-thaw erosion area is mainly distributed in the slope ≥15° slope zone, which accounts for 62% of the total freeze-thaw erosion area, and has a severe effect on moderate erosion and severe erosion in this slope zone. Freeze-thaw erosion areas are mainly concentrated in vegetation belts with vegetation coverage less than 20%, accounting for 63.8% of the total freeze-thaw erosion area. With the increase in vegetation coverage, the proportion of freeze-thaw erosion area decreased. The freeze-thaw erosion area was mainly concentrated on the altitude zone of ≥4000 m, which accounted for 84.3% of the total freeze-thaw erosion area. Thus, the freeze-thaw erosion area increased with altitude.
1. Introduction
Freeze-thaw erosion mainly occurs in cold and high-latitude or high-altitude regions as a result of temperature change (Liu et al. Citation2006). During freeze-thaw erosion, the soil body or rock is broken mechanically due to changes in their volume, transported, migrated, and piled up under the effect of gravity and other forces (Zhang et al. Citation2006). Freeze-thaw erosion is widely distributed in China, in the northeast, northwest, and Qinghai–Tibet Plateau (Qian et al. Citation2001). China’s permafrost area occupies 22.3% of the land area, which ranks third in the world (Qiu et al. Citation2000). Freeze-thaw erosion is one of the main methods of soil erosion. Freeze-thaw erosion seriously threatens the resources of cultivated land, grassland, and the safety of all kinds of buildings. It also causes great harm to people’s production and lives. It severely restricts the economic and sustainable development of the ecological environment (Dong et al. Citation2000). As people focus their attention to freeze-thaw erosion, the number of scholars studying this topic is increasing. Studies on freeze-thaw erosion are most advanced in the United States and Canada, and China only started relatively recently. However, many scholars in China have launched a series of work on freeze-thaw erosion. Zhang and Liu (Citation2005) proposed a new method of defining the distribution of freeze-thaw erosion in Tibet, and they systematically analyzed the distribution rules of freeze-thaw erosion zones. On the basis of the analysis of the factors influencing freeze-thaw, Zhang et al. (Citation2009) initially determined the overall distribution of freeze-thaw regions in China, refined the classification standard of freeze-thaw, and analyzed the erosion characteristics of each region. Wu and Liu (Citation2010) qualitatively analyzed freeze-thaw erosion in the three-river source region and studied the distribution range, distribution rules, and evaluation system of the freeze-thaw region. However, the range of distribution of freeze-thaw erosion was relatively rough. Li et al. (Citation2011) completed the strength evaluation of freeze-thaw erosion in a three-river source region based on GIS technology and conducted a grading study. Guo et al. (Citation2017) introduced the driving force factors of freeze-thaw erosion (rainfall erosivity and wind field intensity during freeze-thaw period) and precipitation during the freeze-thaw period (indicating the phase-changed water content) to construct a freeze-thaw evaluation model. The weights of the evaluation factors were determined by analytic hierarchy process (AHP) and principal component analysis, and freeze-thaw erosion in the study area from 2000 to 2015 was analyzed; results indicated that freeze-thaw erosion improved. Jing et al. (Citation2003) analyzed the form and damage degree of freeze-thaw erosion and reported that freeze-thaw erosion accelerates the rate of soil erosion. Wang et al. (Citation2017) and Guo et al. (Citation2017) evaluated the sensitivity of freeze-thaw erosion in the Qinghai–Tibet Plateau, and they concluded that the spatial distribution of freeze-thaw erosion in the Qinghai–Tibet Plateau is particularly evident. Li et al. (Citation2015) conducted a grading evaluation of freeze-thaw strength in Gansu Province by using GIS and RS techniques combined with a comprehensive evaluation index and relative classification method; they concluded that the intensity of freeze-thaw erosion gradually decreases from southwest to northeast. Ouyang et al. (Citation2014) processed the image data of the Yalu Tsangpo River basin by visual interpretation and obtained the space-time variation characteristic of the erosion intensity distribution of the Yalu Tsangpo River basin, but data were highly subjective. At present, studies on freeze-thaw erosion in the Yalu Tsangpo River basin remain relatively scarce. This paper is based on the study of the evaluation of freeze-thaw erosion intensity by domestic and foreign scholars. Applying the GIS technology, introducing the evaluation factors of freeze-thaw erosion, and using the comprehensive evaluation index model, freezing-thaw erosion intensity was evaluated by single-factor analysis and multiple-factor comprehensive analysis. The spatial distribution of its freeze-thaw erosion was also analyzed. The study of freeze-thaw erosion in the Yalu Tsangpo River basin can provide a basis and decision-making references for the prevention and control of freeze-thaw erosion in the area, which is of practical significance for the protection of the ecological environment in this region.
2. Study area and data sources
2.1. Study area
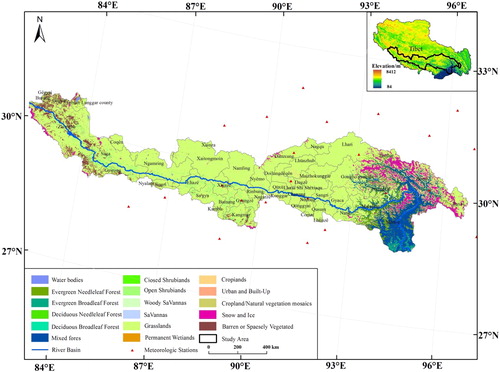
The Yalu Tsangpo River basin is located in southern and southeastern Tibet of China (28°00′−31°16′N, 82°00′−97°07′E; ). Its region covers an estimated area of 2,404,800 km2, and the annual runoff is 139.54 billion m3 (Liu et al. Citation2007). It borders on three Asian countries: India, Bhutan, and Nepal. The basin is within the existing elevation of 7000 m above the snow-covered area, and less than 200 m elevation is a hot and humid valley (Zhang Citation2011). The east–west side of the Yalu Tsangpo River basin is long, but its north–south side is short and narrow. The Himalayas are to the south, Kailash and Nyainqentanglha Range are in the north, and Tibet valley is in the north–south of the basin. The maximum length of east–west is about 1500 km, whereas the maximum width of north–south is only 290 km. The country’s fifth area has a runoff of 4425 m3/s. Many tributaries exist on both sides, of which there are five converging areas of more than 10,000 km2, namely, Lhasa River, Parlung Zangbo, Niyang River, Nianchuhe River, and Dogxung Zangbo. The Yalu Tsangpo River basin is affected by the westerly circulation in winter, with fine weather and snow is a rare occurrence. In summer, it is mainly controlled by the South Asian monsoon. The wet Indian Ocean monsoon can bring heavy rainfall, whereas Brahmaputra Grand Canyon is the gateway to the Indian Ocean monsoon entering the Qinghai–Tibet Plateau, thereby forming a wet tongue extending to the interior of the plateau (Jiang et al. Citation2014). Affected by topography and hydrothermal conditions, the vegetation types in the basin are diverse. The downstream temperature is high, water vapour conditions are good, the main vegetation types are arbours and some secondary vegetation, the middle reaches are mainly bushveld, and the upper reaches are mainly alpine steppes and alpine meadows (Shan Citation2007). Given that the Brahmaputra basin is located in the southern part of the Qinghai–Tibet Plateau, the high altitude, complex terrain, and poor climate contribute to the poor and uneven distribution of meteorological stations in the basin, especially in the central and western parts (Hao et al. Citation2011).
Figure 1. Overview of the study area.
2.2. Data sources
The digital elevation model (DEM) used in this study is a 90 m resolution of STRM-DEM data, which were derived from the Geospatial Data Cloud website (http://www.gscloud.com/). The precipitation data and temperature data were from the meteorological station data. The dataset came from the China Meteorological Science Data Sharing Service website (http://data.cma.cn/). The 250 m resolution Normalized Difference Vegetation Index (NDVI) data of Moderate Resolution Imaging Spectrorsdiometer (MOIDS) and the 500 m resolution land use data were collected by the National Aeronautics and Space Administration Earth Observing System (https://ladsweb.modaps.eosdis.nasa.gov/).
3. Research methods
3.1. Boundary definition of the freeze-thaw erosion region
The freeze-thaw erosion region is characterized by a cold climate with strong freeze-thaw actions. Meanwhile, there is a typical region that displays freeze-thaw erosion landscape morphology, and the freeze-thaw effect is common in this area (Demidov et al. Citation1995; Fan and Cai Citation2003). At present, many research methods can be used to determine the extent of the freeze-thaw erosion zone in the Yalu Tsangpo River basin, and the method of defining the lower bound of the periglacial region as the lower bound of the freeze-thaw erosion area is generally accepted. The annual average temperature of −2.5 °C is the lower bound of the periglacial region. Moreover, the lower bound of the periglacial region is 200 m lower than that of the permafrost region (Zhang et al. Citation2007). In previous research (Zhang and Liu Citation2005), the longitude, latitude, and altitude obtained by STRM-DEM data were used to calculate the altitude of −2.5 °C with the average annual temperature by regression. The above method (EquationEquation (1)(1)
(1) ) was applied to obtain the boundary of the freeze-thaw erosion region in the Yalu Tsangpo River basin, which excluded deserts and ice glaciers.
(1)
(1)
where H refers to the altitude of the lower boundary of the freeze-thaw erosion region (m), X is the latitude (°N), and Y represents the longitude (°E).
Using EquationEquation (1)(1)
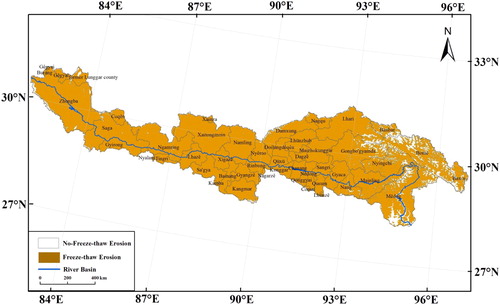
(1) to extract the basic scope of quasi-freeze-thaw erosion area and then remove the desertification area and glacier area, we can determine the scope of the study area of the freeze-thaw erosion area, as shown in .
Figure 2. Distribution of freeze-thaw erosion area in the study area.
3.2. Evaluation factors of freeze-thaw erosion intensity
The freeze-thaw erosion intensity was evaluated to identify areas prone to freeze-thaw erosion (Li et al. Citation2005). Many factors influence freeze-thaw erosion. Previous studies revealed that freeze-thaw erosion is closely related to climate, topography, hydrology, and vegetation. Considering the factors that influence the process of freeze-thaw erosion, six of the most critical indices were chosen to comprehensively evaluate the intensity of freeze-thaw erosion: annual temperature difference, annual precipitation, slope, aspect, vegetation coverage, and elevation.
3.2.1. Annual temperature difference
Annual temperature difference is the difference between the highest monthly mean temperature and the lowest monthly mean temperature over a year. On the basis of the formation mechanism of freeze-thaw erosion, temperature is the primary factor affecting freeze-thaw erosion. It is the main index reflecting the freezing depth of ice and snow. The greater the temperature difference, the greater the depth of the frozen layer and the melted layer; the longer the duration, the greater the extent of freeze-thaw erosion (Song et al. Citation2006). At present, ground temperature factors affecting freeze-thaw erosion are difficult to obtain. The 37a observation data of 29 meteorological stations (1980–2016) in the Yalu Tsangpo River basin and its surrounding area revealed that the annual temperature difference exhibited a strong linear relationship with the longitude, latitude, and elevation. Statistical package for Social Sciences (SPSS) software was used for regression analysis, and the regression equation (EquationEquation (2)(2)
(2) ) is expressed as follows:
(2)
(2)
where T refers to the annual temperature difference (°C), X is the longitude (°E), Y represents the latitude (°N), and H is the elevation (m).
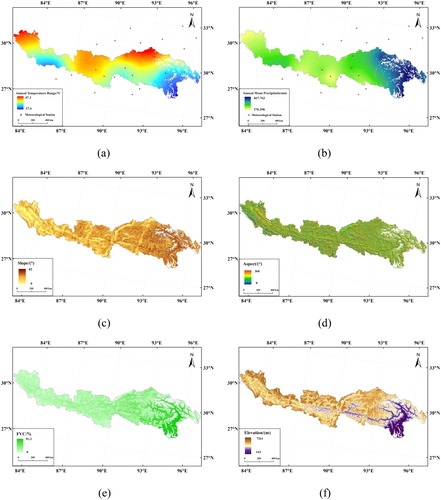
On the basis of the observation value of the temperature in the Yalu Tsangpo River basin and its surrounding area, the Kriging interpolation method in ArcGIS software was used to obtain the distribution map of the annual temperature difference () because of the small number of meteorological stations, which needs to be encrypted based on related calculations. Moreover, the spatial resolution was 250 m.
Figure 3. Distribution maps of various factors in the Yalu Tsangpo River basin. (a) Annual temperature difference, (b) annual precipitation, (c) slope, (d) aspect, (e) vegetation coverage, and (f) elevation.
3.2.2. Annual precipitation
Precipitation is an important factor affecting freeze-thaw erosion. It directly affects the soil water content and affects the intensity of freeze-thaw erosion. The increase in precipitation leads to the increase in water content in soil. When frozen, the destructive effect on soil due to the increase in the volume of icing water increases. Meanwhile, the transport effect of slope melt water on soil will increase with rising precipitation (Li et al. Citation2005). This factor was calculated based on 2000–2016 16a precipitation data of the meteorological stations in the Yalu Tsangpo River basin and surrounding areas and 89 point Tropical Rainfall Measuring Mission data. The annual precipitation distribution map () was obtained by using the Kriging interpolation method, and the spatial resolution was 250 m.
3.2.3. Slope
Slope is the dynamic condition of freeze-thaw erosion, which affects the quantity and transport distance of the freeze-thaw erosion materials (Li et al. Citation2005). In addition, the quantity and transport distance of the freeze-thaw erosion materials increase with the slope (Song et al. Citation2006). Therefore, slope plays an important role in the process of freeze-thaw erosion. In this paper, this index was calculated based on the 90 m DEM data with the slope tool of ArcGIS, and the slope distribution map of this area was drawn ().
3.2.4. Aspect
Aspect is an important factor affecting the ability of soil to accept solar radiation on the ground under different terrain conditions. Shady slopes only receive minimal amounts of solar radiation. By contrast, sunny slopes can receive amounts of solar radiation. Therefore, the intensity of freeze-thaw erosion in sunny zones is more severe than that in shady slopes (Shi et al. Citation2012). In this study, this factor was calculated based on the 90 m DEM data with the aspect tool of ArcGIS, and the aspect distribution map of this area was drawn ().
3.2.5. Vegetation coverage
Vegetation coverage is also one of the important factors affecting the intensity of freeze-thaw erosion. Vegetation can protect the surface, improve soil stability, and reduce the soil temperature difference between day and night. Therefore, high vegetation coverage can inhibit the process of freeze-thaw erosion. In this study, this index of vegetation coverage was obtained from the MOIDS NDVI dataset (2007, 2012, and 2017) (EquationEquation (3)(3)
(3) ).
(3)
(3)
where FC is the fractional vegetation coverage,
refers to the maximum value of pure vegetation at a confidential level (CL) of 0.95, and
is the minimum value of pure bare soil (CL = 0.05).
ArcGIS software was used to map the vegetation coverage in the area ().
3.2.6. Elevation
The elevation of the Yalu Tsangpo River basin is 143–7261 m, leading to significant differences in height. In general, as the altitude increased, ground temperature decreased and freeze-thaw erosion strengthened. Therefore, elevation is also an important factor affecting freeze-thaw erosion. This factor was obtained by clipping the DEM dataset in ArcGIS software using the study area boundaries, and the elevation distribution map of the area was drawn ().
3.3. Classification and weight determination of factors used to evaluate freeze-thaw erosion
In this paper, six factors, namely, annual temperature difference, annual precipitation, slope, aspect, vegetation coverage, and elevation, were selected as the influencing factors of freeze-thaw erosion to construct the assessment system of freeze-thaw erosion intensity in the Yalu Tsangpo River basin. On the basis of previous research results, current classification standards (Wu and Liu Citation2010; Li et al. Citation2015; Guo et al. Citation2017) were used to assign the grade of each factor (). The AHP provides a comprehensive and rational framework for structuring a decision problem, for representing and quantifying its elements, for relating those elements to overall goals, and for evaluating alternative solutions (Bhushan and Rai Citation2004). AHP has unique advantages when important elements of a decision are difficult to quantify or compare, or where communication among team members is impeded by their different specializations, terminologies, or perspectives. Once hierarchy is built, the decision makers systematically evaluate various elements by comparing them with each other two at a time, with respect to their impact on an element above them in the hierarchy (Saaty Citation2008). Thus, AHP was used to obtain the judgment matrix of evaluation factors and determine the weight of each factor (). The consistency test using AHP was 0.0222, which was far less than 0.1. Therefore, the weight obtained exhibited a certain degree of scientific and accuracy.
Table 1. Classification criteria for evaluating indexes of freeze-thaw erosion intensity.
Table 2. Evaluation indexes for the judgment matrix and weight.
3.4. Evaluation method of freeze-thaw erosion intensity
3.4.1. Index standardization
Given that the factors were measured in different units of measurement, standardization was needed to eliminate the unit difference among variables (Shi et al. Citation2012). Variables were processed using EquationEquations (4)(4)
(4) and Equation(5)
(5)
(5) to change them into unit-less variables (0–1).
(4)
(4)
(5)
(5)
where I refers to the value of each factor, Ii in EquationEquation (4)
(4)
(4) is a standardized value of each positive factor I, Ii in EquationEquation (5)
(5)
(5) is a standardized value of each negative factor I, Imin refers to the minimum value of factor I, and Imax is the maximum value of factor I.
3.4.2. Comprehensive evaluation index model
The method of evaluating the freeze-thaw erosion intensity of the Yalu Tsangpo River basin uses the comprehensive evaluation index model. A comprehensive calculation of different evaluation factors was necessary to obtain a comprehensive evaluation index (Li et al. Citation2005).
The comprehensive evaluation index model is described as
(6)
(6)
where FT is the freeze-thaw erosion index, Wi refers the weight of factor i, Ii refers to the value of evaluation factor i, and n is the number of evaluation factors of freeze-thaw erosion. As FT increases, freeze-thaw erosion intensified; by contrast, as FT decreases, freeze-thaw erosion weakens.
4. Results
4.1. Comprehensive evaluation results of freeze-thaw erosion intensity
In this study, the freeze-thaw erosion intensity index of the Yalu Tsangpo River basin was calculated by ArcGIS combined with the comprehensive evaluation model. The freeze-thaw erosion intensity index was between 0.136 and 0.730. To facilitate the analysis of the spatial patterns of freeze-thaw erosion, the comprehensive index of freeze-thaw erosion intensity was divided into five categories via natural breaks method in ArcGIS based on chart histogram. Combined with field observation data and the classification criteria of freeze-thaw erosion in the first national water conservancy survey, the five categories were slight erosion, mild erosion, moderate erosion, intensive erosion, and severe erosion.
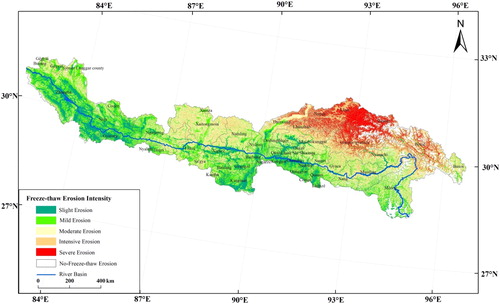
The grading map of the intensity of freeze-thaw erosion in the Yalu Tsangpo River basin was drawn in ArcGIS ().
Figure 4. Grading map of freeze-thaw erosion intensity in the Yalu Tsangpo River basin.
The area of freeze-thaw erosion intensity was calculated using ArcGIS, as shown in .
Table 3. Area of different levels of freeze-thaw erosion in the Yalu Tsangpo River basin.
shows the evaluation results of each freeze-thaw erosion level in the study area. The area of no-freeze-thaw erosion area was 15,995.80 km2; the total area of freeze-thaw erosion was 229,231.80 km2, which accounted for 93.5% of the total area of the Yalu Tsangpo River basin. The area occupied by mild erosion and moderate erosion was large, which accounted for 28.57% and 28.15% of the total area of freeze-thaw erosion, respectively. The area of intensive erosion was 42,522.10 km2, which accounted for 18.55% of the total area of freeze-thaw erosion. The area of slight erosion was 36,808.40 km2, accounting for 16.06% of the total area of freeze-thaw erosion. The area of severe erosion was 19,890.60 km2, accounting for 8.68% of the total area of freeze-thaw erosion.
To confirm the validity of the experimental results, we based our interpretation of the marks on the freeze–thaw erosion intensity images on the work of our predecessors (Yang and Zhao Citation2003; Ouyang et al. Citation2014). In addition, we collected 184 sampling points from high-definition Google Earth images and compared them with classified data. To evaluate their accuracy, as shown in , we used the confusion matrix (Hay Citation1988; Lewis and Brown Citation2001). The results revealed that the overall accuracy of the experimental data was 90.2% and the Kappa coefficient was 87.5%, which indicates the certain reliability of the freeze–thaw erosion model (). shows an assessment of the producer’s accuracies for the different levels of the freeze–thaw erosion intensity, in which mild erosion has the best precision (93.6%), followed by severe erosion (92%) and slight erosion (90.3%); moderate erosion (88.4%) and intensive erosion (86.2%) have much lower accuracies. However, due to the different number of points collected for each level, differences are evident in the evaluation accuracies of the different levels of the freeze–thaw erosion intensity. The producer’s accuracies for the moderate and intensive erosion intensity data are lower than other freeze–thaw erosion intensity levels owing to the fact that the moderate and intensive freeze–thaw erosion intensities are prone to interfering with each other during the collection process, thereby amplifying the relative error. In general, the accuracy of each freeze–thaw erosion intensity level is acceptable, which indicates the acceptable accuracy of the overall experimental results.
Table 4. Distribution of observation points of freeze–thaw erosion intensities.
Table 5. Evaluation accuracy of each freeze-thaw erosion intensity level.
4.2. Spatial distribution characteristics of freeze-thaw erosion intensity
In ArcGIS, by using the superposition analysis method, the boundary data of each county in the Yalu Tsangpo River basin were overlaid with the graded data of freeze-thaw erosion intensity to obtain the area data of the erosion–erosion intensity in each county.
As shown in , the spatial distribution of erosion intensity of the Yalu Tsangpo River basin was obviously different. Severe erosion in the Yalu Tsangpo River basin mainly occurred in the northern and northeastern regions, whereas the intensity of freeze-thaw erosion in the western, northwestern, and southern regions was mainly slight erosion and mild erosion. The northern and northeastern Brahmaputra basin belonged to the lower reaches of the Yalu Tsangpo River basin. The Indian Ocean monsoon prevailed in this area, which resulted in abundant precipitation. The Tanggula Mountains were located in the north and northeast of the Yalu Tsangpo River basin. Therefore, terrain factors such as slope and altitude exerted a major influence on freeze-thaw erosion in this area, and multiple factors could work together to strengthen the freeze-thaw erosion intensity of this region. However, in the west, northwest, and south of the Yalu Tsangpo River basin, the values of slope, annual precipitation, and elevation were relatively low, which made the area of freeze-thaw erosion intensity weak. In the southwestern Yalu Tsangpo River basin, erosion was mainly mild and no-freeze-thaw. This area belonged to the lower reaches of the Yalu Tsangpo River basin. Vegetation types such as evergreen broadleaf forests, evergreen needleleaf forest, and mixed forests were abundant in this area. Vegetation has a certain weakening effect on freeze-thaw erosion. Meanwhile, elevation was relatively low, and the impact on freeze-thaw erosion intensity was weak. Therefore, vegetation coverage and altitude played a major role in freeze-thaw erosion intensity in this area.
5. Discussions
To further analyze and explore the relationship between freeze-thaw erosion intensity and the single factors in the Yalu Tsangpo River basin, ArcGIS software was used to measure the effects of the annual temperature difference, annual precipitation, slope, aspect, vegetation, and elevation. On the basis of superposition analysis in GIS, the distribution of freeze-thaw erosion intensity in the Yalu Tsangpo River basin under different factors (i.e. annual temperature difference, annual precipitation, slope, aspect, vegetation, and elevation) were analyzed.
5.1. Analysis of freeze-thaw erosion intensity under different annual temperature difference
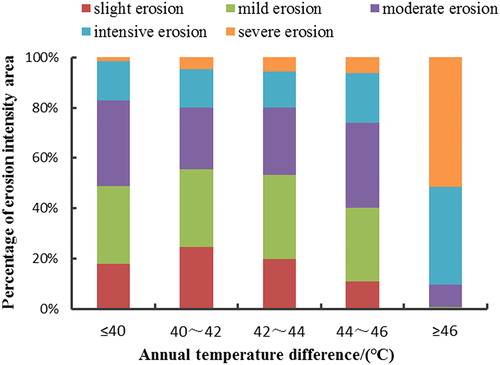
The freeze-thaw erosion area in the Yalu Tsangpo River basin was mainly concentrated in the temperature difference zone with the annual temperature difference of >40 °C, accounting for 86.4% of the total freeze-thaw erosion area. Meanwhile, the total freeze-thaw erosion area in the temperature difference zone of 44–46 °C accounted for 33.5%. The area with the annual temperature difference of ≥46 °C accounted for 8% of the total freeze-thaw erosion area (). Severe erosion and intensive erosion were mainly distributed in the temperature difference zones with the annual temperature difference of ≥46 °C, accounting for 38.92 and 51.40% of the freeze-thaw erosion area in this zone, respectively. Moderate erosion was mainly concentrated in the temperature difference zone with the annual temperature difference of ≤40 °C and 44–46 °C, accounting for 33.82 and 33.90% of the freeze-thaw erosion area in this zone, respectively. Slight erosion and mild erosion in the temperature difference zone with the annual temperature difference of ≥46 °C did not yield a freeze-thaw erosion area. Slight erosion was mainly distributed in the temperature difference zone with the annual temperature difference of 40–42 °C, accounting for 24.64% of the freeze-thaw erosion area in this zone (). As shown in , as the annual temperature difference increased, the percentages of the areas of severe erosion and intensive erosion in the area of freeze-thaw erosion increased. Therefore, the intensity of freeze-thaw erosion (severe erosion and severe erosion) became pronounced in the temperature difference zone with the annual temperature difference of ≥46 °C.
Figure 5. Distribution of freeze-thaw erosion area under different annual temperature difference.
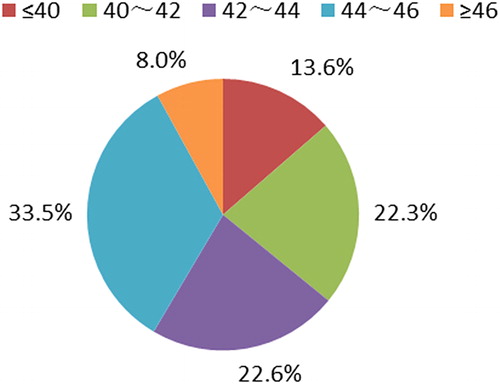
Figure 6. Distribution of erosion intensity under different annual temperature differences.
5.2. Analysis of freeze-thaw erosion intensity under different annual precipitation
The freeze-thaw erosion areas in the Yalu Tsangpo River basin were mainly concentrated in the precipitation zone with the annual precipitation of ≤500 mm, accounting for 65.2% of the total freeze-thaw erosion area. The area with the annual precipitation of ≥600 mm showed weak freeze-thaw erosion (). Slight erosion, mild erosion, and moderate erosion were mainly concentrated in the annual precipitation zones of ≤400 mm and 400–500 mm. In the annual precipitation zone of ≤400 mm, slight erosion, mild erosion, and moderate erosion occurred, accounting for 19.5, 37.4, and 31.8% of the area of freeze-thaw erosion within the precipitation zone, respectively. Within the precipitation zone with an annual precipitation of 400–500 mm, slight erosion, mild erosion, and moderate erosion accounted for 23.7, 32.6, and 27.2% precipitation within the freeze-thaw erosion area, respectively. Intensive erosion was mainly distributed in the precipitation zone with annual average precipitation of ≥500 mm, namely, 500–600 mm, 600–700 mm, and ≥700 mm, accounting for 32.3, 27.4, and 31.6% of the freeze-thaw erosion area of each precipitation. Severe erosion was also mainly distributed in the precipitation zone with the annual average precipitation of ≥500 mm, namely, 500–600 mm, 600–700 mm, and ≥700 mm, accounting for 24, 23.3, and 26.3% of the freeze-thaw erosion area of each precipitation zone, respectively ().
Figure 7. Distribution of freeze-thaw erosion area under different annual precipitation.
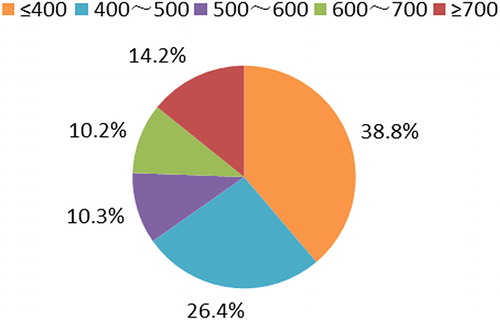
Figure 8. Distribution of freeze-thaw erosion intensity under different annual precipitation.
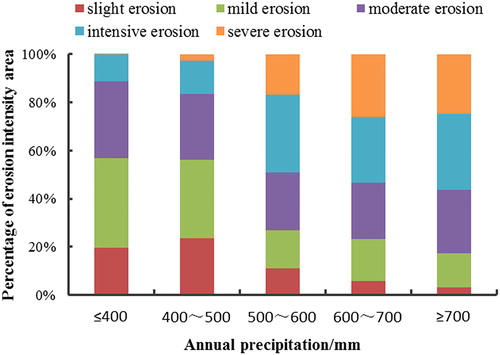
shows that the percentages of erosion area occupied by slight erosion and mild erosion decreased with the increase in annual precipitation. The percentages of erosion area occupied by severe erosion and intensive erosion increased with the increase in annual precipitation. With the increase in annual precipitation, the effects of severe erosion and intensive erosion on freeze-thaw erosion were relatively strong and positive (increasing), whereas the effects of slight erosion and mild erosion were obviously strong but negative (declining). Moderate erosion was in a stable state.
5.3. Analysis of freeze-thaw erosion intensity at different slopes
In the Yalu Tsangpo River basin, the area of freeze-thaw erosion was mainly concentrated within the slope of ≥15°, accounting for 62% of the total freeze-thaw erosion area. Within the slope of ≥24°, the area of freeze-thaw erosion accounted for the largest at 37.3%. At a slope of ≤3° and 3–8° in the freeze-thaw erosion area, the total freeze-thaw erosion areas were 10 and 11%, respectively (). Slight erosion was mainly concentrated in the slope zone with slopes of ≤3° and 3–8°, which accounted for 69.7 and 38% of the frost–thaw erosion area, respectively. Mild erosion was mainly distributed in the slope of 3–8° and 8–15°, accounting for 45.1 and 49.4% of the area of the slope with freeze-thaw erosion, respectively. Moderate erosion was mainly distributed in the slope zone with the slope of ≥15° (15–24° and ≥24°), accounting for 74.6% of the area of the slope with freeze-thaw erosion. Intensive erosion and severe erosion were mainly distributed in the slope zone with slope of ≥24°, accounting for 52.7% of the erosion area of the slope zone (). This figure shows that the percentages of erosion area occupied by slight erosion and mild erosion decreased with increasing slope. Moderate, intensive, and severe erosion intensified as the slope increased, and the percentages of the erosion area occupied by freeze-thaw strength increased gradually. With the increase in slope, the impact of the intensity band with strong freeze-thaw erosion became severe. Given that slope factor has a major role in the evaluation of freeze-thaw erosion intensity, a large number of land reclamation wasteland must be controlled to prevent the intensification of freeze-thaw erosion intensity.
Figure 9. Distribution of freeze-thaw erosion area at different slopes.
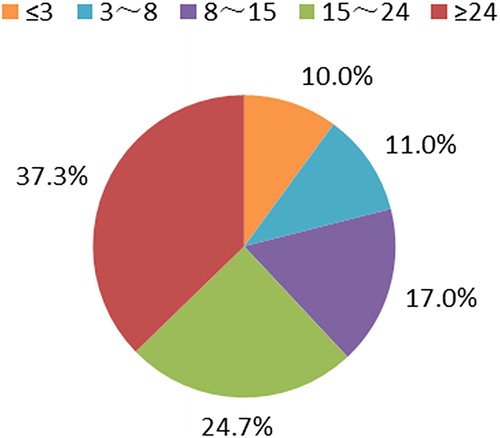
Figure 10. Distribution of freeze-thaw erosion intensity at different slopes.
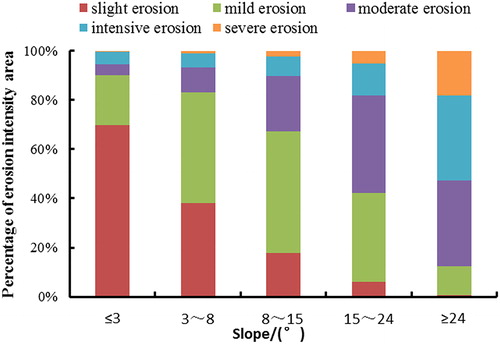
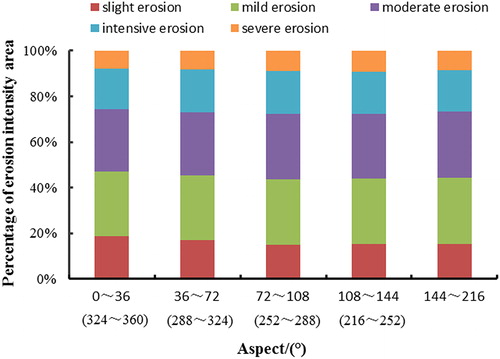
5.4. Analysis of freeze-thaw erosion intensity under different aspects
In the Yalu Tsangpo River basin, the area of freeze-thaw erosion is widely distributed in each freeze-thaw erosion intensity zone, and the area of total freeze-thaw erosion did not considerably differ (). Mild erosion and moderate erosion occupied a large percentage of freeze-thaw erosion area in each aspect zone. With the increase in aspect, the area percentage of freeze-thaw erosion intensity of slight erosion, mild erosion, moderate erosion, intensive erosion, and severe erosion became stable, but it generally showed steady and slow growth ().
Figure 11. Distribution of freeze-thaw erosion area with different aspects.
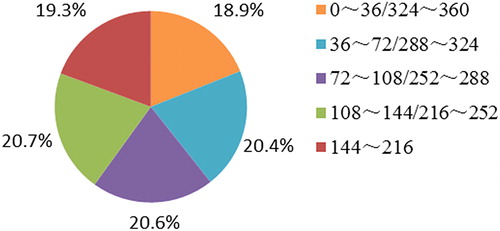
Figure 12. Distribution of erosion intensity under different aspects.
5.5. Analysis of freeze-thaw erosion intensity under different vegetation coverage
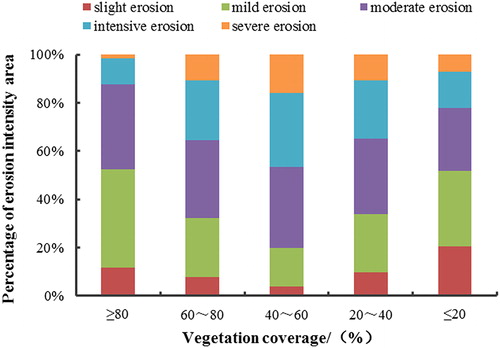
The area of freeze-thaw erosion in the Yalu Tsangpo River basin was mainly concentrated in the vegetation belt with vegetation coverage ≤20%, accounting for 63.8% of the total freeze-thaw erosion area. Vegetation coverage of 20–40% of the vegetation belt accounted for 24.6% of the total freeze-thaw erosion area; vegetation coverage of 40–60% accounted for 5.8% of the total freeze-thaw erosion area; vegetation coverage of 60–80% accounted for 4.9% of the total freeze-thaw erosion area; and vegetation coverage ≥80% accounted for 0.8% of the total freeze-thaw erosion area, accounting for the smallest area (). The coverage of vegetation was ≥80%, and the proportions of intensive erosion and severe erosion in the vegetation zone were the lowest, accounting for 1.6 and 10.8%, respectively. The coverage of vegetation was ≥80%, and the proportions of mild erosion and moderate erosion in the vegetation zone were the largest, accounting for 40.6 and 35.1%, respectively. Vegetation coverage was 40–60%. Intensive erosion and severe erosion accounted for 33.6 and 16% of the freeze-thaw erosion area in this vegetation zone, respectively. In this vegetation belt, slope and annual temperature difference played a certain role, aggravating the strength of freeze-thaw erosion (). As shown in and , with the increase in vegetation coverage, the area of freeze-thaw erosion showed a downward trend, indicating that vegetation coverage induced a certain weakened effect on freeze-thaw erosion. Therefore, considering the role of vegetation, additional greening areas are necessary in the study area, and deforestation should be reduced.
Figure 13. Distribution of freeze-thaw erosion area with different vegetation coverage.
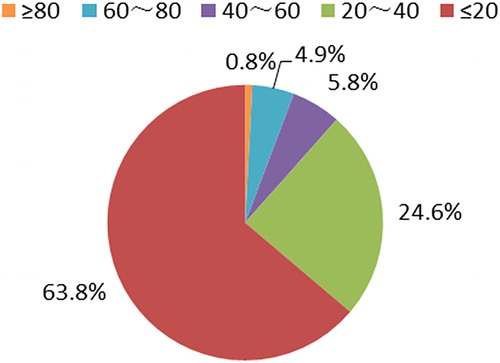
Figure 14. Distribution of freeze-thaw erosion intensity under different vegetation coverage.
5.6. Analysis of freeze-thaw erosion intensity under different elevation
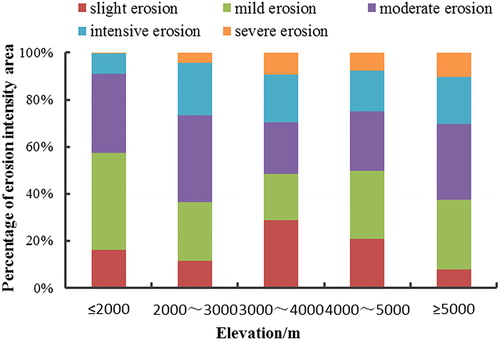
The area of freeze-thaw erosion in the Yalu Tsangpo River basin is mainly concentrated at a height of ≥4000 m above elevation, accounting for 84.3% of the total freeze-thaw erosion area. Elevation of the total freeze-thaw erosion area is 4000–5000 m, accounting for 46.1% of the total freeze-thaw erosion area, whereas elevation of ≥5000 m accounts for 38.2% of the total freeze-thaw erosion area (). In the height bands with elevation of ≤2000 m, the percentages of mild and moderate erosions were the highest in terms of the percentages of freeze-thaw erosion areas, 41.4 and 33.6%, respectively. In altitude bands with elevation of 3000–4000 m, 4000–5000 m, and ≥5000 m, respectively, the percentages of erosion areas with severe erosion at their respective altitudes were 9.3, 7.8, and 10.3%, respectively (). and show that the area of freeze-thaw erosion increased with elevation. At 4000–5000 m, the area of freeze-thaw erosion was the largest. Erosion became severe with the increase in elevation, thereby raising the area of freeze-thaw erosion.
Figure 15. Distribution of freeze-thaw erosion area with different elevation.
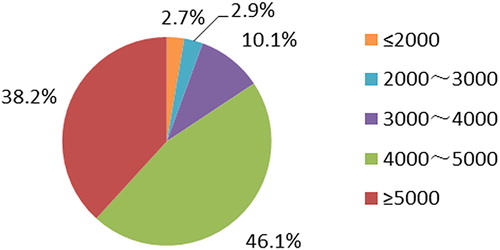
Figure 16. Distribution of freeze-thaw erosion intensity at different elevations.
6. Conclusions
In this study, we selected six factors, namely, annual temperature difference, annual precipitation, slope, aspect, vegetation cover, and elevation, to evaluate the intensity of freeze-thaw erosion in the Brahmaputra basin. From spatial pattern and single-factor analysis, we drew the following conclusions.
The total area of freeze-thaw erosion was 229,231.80 km2, which accounted for 93.5% of the total area of the Yalu Tsangpo River basin. The area occupied by mild erosion and moderate erosion was large, which accounted for 28.57 and 28.15% of the total area of freeze-thaw erosion, respectively. Intensive erosion accounted for 18.55% of the total area of freeze-thaw erosion. Slight erosion accounted for 16.06% of the total area of freeze-thaw erosion, and severe erosion accounted for 8.68% of the total area of freeze-thaw erosion.
The distribution of the intensity of freeze-thaw erosion in the Yalu Tsangpo River basin was significantly different in terms of spatial pattern. From west to east, the intensity of freeze-thaw erosion gradually strengthened. Severe erosion was mainly concentrated in the northeastern and northern regions of the Yalu Tsangpo River basin. Slight erosion and mild erosion were mainly distributed in the western part of the Yalu Tsangpo River basin.
With the increase of annual temperature difference, the percentages of freeze-thaw erosion area occupied by intensive erosion and severe erosion are increasing, and the effect of freeze-thaw erosion in the annual temperature difference of ≥46 °C is more significant. The area of freeze-thaw erosion is mainly distributed in the annual temperature difference of ≥40 °C, accounting for 86.4% of the total freeze-thaw erosion area. The percentage of freeze-thaw erosion area decreased with the increase of annual precipitation, and the percentages of freeze-thaw erosion area under intensive erosion and severe erosion increased with the increase of annual precipitation. In the Yalu Tsangpo River basin, the area of freeze-thaw erosion mainly concentrates within the slope of ≥15°, accounting for 62% of the total freeze-thaw erosion area. The percentages of erosion area occupied by the slight erosion and mild erosion are decreasing with the increase of the slope. Moderate, intensive and severe erosion as the slope increases, the percentages of the erosion area occupied by the freeze-thaw strength increase gradually. The area of freeze-thaw erosion in the Yalu Tsangpo River basin is mainly concentrated in the vegetation belt with vegetation coverage ≤20%, accounting for 63.8% of the total freeze-thaw erosion area. With the increase of vegetation coverage, the area of freeze-thaw erosion shows a downward trend. The area of freeze-thaw erosion in the Yalu Tsangpo River basin mainly concentrates at a height of ≥4000 m above elevation, accounting for 84.3% of the total freeze-thaw erosion area. The area of freeze-thaw erosion increases with elevation.
In this paper, the intensity of freeze-thaw erosion in the Yalu Tsangpo River basin was assessed by a comprehensive evaluation model. Given that most anthropogenic activities in the freeze-thaw erosion area are relatively weak and human activities exert minimal impact, this study mainly focussed on the effects of natural factors (e.g. temperature, precipitation, topography, and vegetation) on freeze-thaw erosion to analyze the status of freeze-thaw erosion in the Yalu Tsangpo River basin. A previous research (Zhang et al. Citation2009; Liu et al. Citation2013; Ouyang et al. Citation2014) confirmed that the results of freeze-thaw erosion obtained in this paper were reasonable and scientific. The results of the study can provide some evidence for the prevention and reduction of freeze-thaw erosion in the Yalu Tsangpo River basin in the future.
Disclosure statement
No potential conflict of interest was reported by the authors.
Additional information
Funding
Related Research Data
References
- Bhushan N, Rai K. 2004. Strategic decision making: applying the analytic hierarchy process. London: Springer-Verlag.
- Demidov VV, Ostroumov VY, Nikitishena IA, Lichko VI. 1995. Seasonal freezing and soil erosion during snowmelt. Eurasian Soil Sci. 28(10):78–87.
- Dong RK, Xu ZY, Yang CY. 2000. Freeze-thaw erosion in Qinghai-Tibet Plateau. Yangtze River. 31(9):39–41.
- Fan HM, Cai QG. 2003. Review of research progress in freeze-thaw erosion. Sci Soil Water Conserv. 1(4):50–55.
- Guo B, Luo W, Wang D-L, Jiang L. 2017. Spatial and temporal change patterns of freeze-thaw erosion in the three-river source region under the stress of climate warming. J Mt Sci. 14(6):1086–1099.
- Hao ZC, Tong K, Zhang LL, Duan XL. 2011. Applicability analysis of TRMM precipitation estimates in Qinghai-Tibet plateau. Hydrology. 31(5):18–23.
- Hay AM. 1988. The derivation of global estimates from a confusion matrix. Int J Remote Sens. 9(8):1395–1398.
- Jiang L, Feng WL, Guo B. 2014. Analysis of dynamic monitoring of vegetation change and the correlation with precipitation factor in YaLu Tsangpo River basin during the past 13 years. Resour Environ Yangze Basin. 23(11):1610–1619.
- Jing GH, Ren XP, Liu BY, Qi GG. 2003. Freeze-thaw erosion and harm in Heilongjiang province. Sci Soil Water Conserv. 1(3):99–101.
- Lewis HG, Brown M. 2001. A generalized confusion matrix for assessing area estimates from remotely sensed data. Int J Remote Sens. 22(16):3223–3235.
- Li CL, Ma JH, Tang ZG. 2011. GIS-based evaluation on intensity of freeze-thaw erosion in headwater region of the three-river-source area. Soil Water Conserv China. 4:41–44.
- Li D, Wei X, Li XG, Li YJ. 2015. Sensitivity evaluation of freeze-thaw erosion in Gansu province based on RS and GIS. Res Soil Water Conserv. 22(2):1–6.
- Li HX, Liu SZ, Zhong XH. 2005. GIS-based sensitivity evaluation on freeze-thaw erosion in Tibet. Soil Water Conserv China. 7:44–46.
- Liu J, Yao ZJ, Chen CY. 2007. Evolution trend and causation analysis of the runoff evolution in the Yarlung Zangbo River basin. J Nat Resour. 3:471–477.
- Liu SZ, Liu BT, Tao HP, Zhang LX. 2013. The current situation of frost and melt erosion in our country and preventive countermeasures. Soil Water Conserv China. 10:41–44.
- Liu SZ, Zhang JG, Gu SX. 2006. Study on the soil erosion types in Tibet. J Mt Sci. 24(5):592–596.
- Ouyang Y, Shen WS, Yang K, Lin NF. 2014. The trend of freeze-thaw erosion in Yarlung Zangbo River basin in nearly twenty years. Mt Res. 32(4):417–422.
- Qian ZH, Ni JR, Xue A. 2001. Classification and identification of severity degree of the no-flow events in the Yellow River. Acta Geogr Sin. 56(6):691–699.
- Qiu GQ, Guo DX, Zhou YW, Cheng GD. 2000. Geocryology in China. Beijing: Science Press.
- Saaty TL. 2008. Relative measurement and its generalization in decision making: why pairwise comparisons are central in mathematics for the measurement of intangible factors–the analytic hierarchy/network process. Rev R Acad Cien Serie A Mat. 102(2):251–318.
- Shan JP. 2007. Research on the morphological features of Yarlung Zangbo River based on DEM. Beijing: China University of Geoseienees.
- Shi Z, Tao HP, Liu SZ, Liu DT, Geo B. 2012. Research of freeze-thaw erosion in the three-river-source area based on GIS. Trans Chin Soc Agric Eng. 28(19):214–219.
- Song J, Tang GA, Wang C, Xiao CC. 2006. Analysis of edge effect of DEM extraction slope. Bull Soil Water Conserv. 26(3):82–85.
- Wang LY, Xiao Y, Jiang L, Ouyang ZY. 2017. Assessment and analysis of the freeze-thaw erosion sensitivity on the Qinghai-Tibet plateau. J Glaciol Geocryol. 39(1):61–69.
- Wu WZ, Liu FG. 2010. Dynamic analysis and distribution characteristics of freeze-thaw erosion in the three-rivers’ head-stream region. J Qinghai Normal Univ. 26(1):57–61.
- Yang JX, Zhao YA. 2003. Analysis on interpretation of remote sensing images of soil erosion in Xinjiang. Res Soil Water Conserv. 10(2):55–57.
- Zhang JG, Liu SZ. 2005. Methodologies and technologies of the implementation of Erhai Lake valley management information system. Geogr Geo-Inf Sci. 21(2):32–34.
- Zhang JG, Liu SZ, Yang SQ. 2006. Classification and assessment of freeze-thaw erosion in Tibet. Acta Geogr Sin. 61(9):911–918.
- Zhang JG, Liu SZ, Yang SQ. 2007. The classification and assessment of freeze-thaw erosion in Tibet. J Geogr Sci. 10(2):635–640.
- Zhang RF, Wang X, Fan HM, Zhou LL, Wu M, Liu YH. 2009. Study on the regionalization of freeze-thaw zones in China and the erosion characteristics. Sci Soil Water Conserv. 7(2):24–28.
- Zhang XX. 2011. Spatial-temporal evolutional laws of the key hydrological elements in Yarlung Zangbo River basin. Beijing: Beijing Forestry University.