
 ?Mathematical formulae have been encoded as MathML and are displayed in this HTML version using MathJax in order to improve their display. Uncheck the box to turn MathJax off. This feature requires Javascript. Click on a formula to zoom.
Abstract
West Texas’ Permian Basin, where the Wink sinkholes are located, is underlain by evaporite rocks that have been exposed to the dissolution due to natural processes and/or anthropogenic activities. We used the time-series interferometric synthetic aperture radar technique to process 16 ALOS PALSAR images from 01/01/2007 to 02/27/2011 for inspecting ground stability. Our results clearly show that two major sinkholes (Wink Sinks 1, 2), formed in 1980 and 2002, are both still subsiding, but the maximum subsidence for the 4-year period (2007–2011) occurred over an area about 1 km northeast of Wink Sink 2. The peak subsidence rate reached ∼40 cm/year during 2007–2010 and rose to ∼50 cm/year after 2010 when the area was hit by a record drought. Continuous monitoring of the subsidence in the vicinity of the Wink sinkholes is required for preventing and mitigating catastrophic outcomes of long-term developing geohazards to the area’s oil production facilities, infrastructure, and human safety.
Keywords:
1. Introduction
A sinkhole is a depression or a hole caused by the collapse of land surface (Gutiérrez et al. Citation2014). Such phenomenon is generally found in geological formations known as karst topography where soluble rocks (evaporites, carbonate rocks) dissolve as a consequence of chemical process and collapse (e.g. Beck and Pearson Citation1995; Johnson and Neal Citation2003; Waltham et al. Citation2005). Karst is often prone to the ground subsidence induced by the contact with freshwater from aquifer systems. Sinkhole formation can be related to dissolution of the water-soluble rocks, the development and expansion of underground cavities, consecutive roof failures, and crop-out on the surface. According to Gutiérrez et al. (Citation2014), natural sinkholes can be classified into two types: “solution sinkhole” and “subsidence sinkhole”. A solution sinkhole is attributed to the surface dissolution, which creates shafts or conduits and can lead to ground instability. In this case, karst rock is exposed with almost no mantle soil. On the other hand, a subsidence sinkhole is created by ground surface subsidence, which may be attributed, for example, to chemical dissolution of caprock and bedrock underground, internal erosion of rock, subsurface dissolution and downward gravitational movement of the overlying material. It commonly shows one of the phenomena: collapse, sagging and/or suffusion (Gutiérrez et al. Citation2014).
Sinkhole hazards can be found in karst areas worldwide (e.g. Beck and Pearson Citation1995; Johnson and Neal Citation2003; Waltham et al. Citation2005). Well-known areas with sinkholes are located along the dead sea coastline (Baer et al. Citation2002; Abelson et al. Citation2003; Wust-Bloch and Joswig Citation2006; Nof et al. Citation2013), northeastern Spain (Galve et al. Citation2009; Castañeda et al. Citation2009; Gutiérrez et al. Citation2011; Castañeda et al. Citation2011; Yerro et al. Citation2014; Carbonel et al. Citation2015; Galve et al. Citation2015), the Netherlands (Chang and Hanssen Citation2014) and North America (Paine et al. Citation2012; Vaccari et al. Citation2013; Rucker et al. Citation2013; Jones and Blom Citation2014; Kim et al. Citation2016; Kim and Lu Citation2018).
Sinkhole development can be induced by natural processes and/or anthropogenic activities in a karst environment. According to Waltham et al. (Citation2005), the vast majority of newly formed sinkholes are human-made. The anthropogenic factors primarily include (i) incremental water input into ground (cover and bedrock), (ii) aquifer exploitation and mining dewatering resulting in water level decline, and (iii) static and dynamic loadings such as water impoundment, vegetation removal or ground freeze and thawing. Sinkholes can cause economic losses, directly and/or indirectly. For example, sinkhole subsidence can severely destroy the integrity of infrastructure such railways, roads, canals, pipeline systems, buildings, and even nuclear power stations (e.g. Kuniansky et al. Citation2016). A critical step in sinkhole hazard analysis must therefore include an infrastructure inventory investigation and risk assessment.
Sinkhole-induced deformation and collapse have been observed by the following methods: microgravity (Paine et al. Citation2012), Light Detecting And Ranging (Filin and Baruch Citation2010; Filin et al. Citation2011), spaceborne InSAR (interferometric synthetic aperture radar) (Chang and Hanssen Citation2014; Kim et al. Citation2016; Kim and Lu Citation2018), field surveys (Bruno et al. Citation2008; Margiotta et al. Citation2012), Uninhabited Aerial Vehicle SAR (Jones and Blom Citation2014), and geological mapping. The detailed subsurface information can also be directly obtained through spelaeological exploration and geophysical field surveys through trenching, probing, and drilling. Incorporating all types of data and field geological investigation methods provides higher resolution sinkhole deformation maps and enables the characterization of the sinkhole-related deformation cause(s) and expected progression. Although considerable research has been increasingly devoted to the investigation of sinkhole activities in recent decades, there is still much room for improvement to further understand the mechanism of sinkholes, in particular, through continuous monitoring of developing sinkholes.
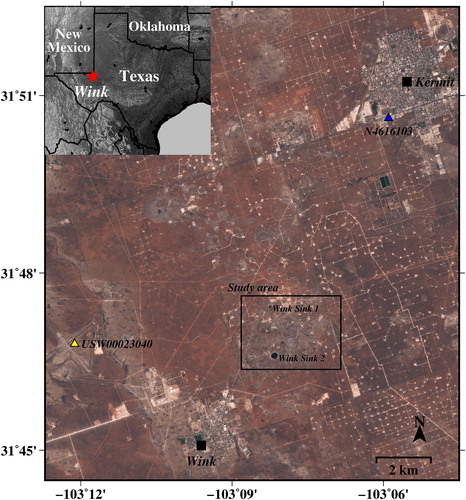
In the Permian basin of west Texas, two large collapse sinkholes emerged in Wink County in 1980 and 2002, dubbed Wink Sink 1 and Wink Sink 2, respectively (). They are believed to still be actively developing, likely attributed to a deep supply-water well, since fresh or under-saturated saline water flowing through improperly cased wellbores and/or rock fractures may contribute to salt dissolution (Johnson et al. Citation2003). Paine et al. (Citation2012) processed microgravimetry, GPS, and InSAR observations from a January to July 2007 advanced land observation satellite (ALOS)-1 interferogram and concluded that the maximum vertical subsidence was approximated as 30 cm/year. Kim et al. (Citation2016) observed the development of Wink sinkholes using Sentinel-1A of May–August 2015 and found that the areas nearby the current sinkholes were also unstable and experiencing a large deformation. The subsidence east of Wink Sink 2 could be more than 40 cm/year during 2015–2017 based on Sentinel-1A/B InSAR imagery (Kim and Lu Citation2018). Due to the coarse resolution of Sentinel-1A/B and the rapid subsidence, the peak subsidence from Sentinel-1A/B could be even greater (Kim et al. Citation2016; Kim and Lu Citation2018). Recently, using high-resolution TerraSAR-X imagery, Kim et al. (Citation2019) calculated the peak subsidence over the area about 1 km east of Wink Sink 2 and found it to be about 60 cm/year during 2015 and 2016. However, there has been no study regarding temporal development of the two sinkholes and surrounding regions from 2007 to 2011. Thus, the major motivation of this paper was to monitor the time-varying sinkhole development, which can be important to assess the state of deformation of these two sinkholes and mitigate potential sinkhole hazards nearby. More specifically, we have processed the time series of 16 HH-polarized L-band ALOS-PALSAR (Phased Array type L-band SAR) images taken between January 2007 and February 2011 and confirmed that the two sinkholes are still subsiding and the area to the east of Wink Sink 2 was already experiencing subsidence at an alarming rate during 2007–2011.
Figure 1. Study area of Wink sinkholes (black box) near Wink and Kermit, Texas that is covered by ALOS PALSAR data. Wink Sink 1 developed in 1980 is located ∼1.5 km north of Wink Sink 2, which outcropped in 2002. Background image is from Sentinel-2. Blue (N4616103) and yellow (USW00023040) triangles represent groundwater well and weather station, respectively. Source: Author
2. Data and methods
A synthetic aperture radar (SAR) system can obtain high-resolution images by emitting radar waves to targets from a spaceborne, airborne, or ground-based platform. InSAR technique combines two SAR images of the same imaging geometry from the same area (e.g. Rosen et al. Citation2000; Hanssen Citation2001). The phase differences between the images, or the interferogram, highlights even slight changes in the surface over time. Multiple processing steps are necessary to properly align the images and correct for signal noises and potential errors. The interferometric phase after the topography correction is proportional to a subtle terrain deformation, and contaminated by atmosphere changes between the two acquisitions, topography error, position uncertainty and other noises:
(1)
(1)
where B is the length of the baseline, α is the baseline orientation angle, λ is the radar wavelength, θ is the look angle, r is the slant-range from the target to the reference satellite, herr is the topography height error, and φdef, φatm and φnoise are, respectively, the components of deformation, atmospheric and noise in the interferogram phase. InSAR has been widely applied to various studies of geohazards, for example, landslides, earthquakes, volcanoes, and land subsidence (e.g. Massonnet et al. Citation1993; Amelung et al. Citation1999; Bawden et al. Citation2001; Lu and Danskin Citation2001; Lu et al. Citation2010; Lu and Dzurisin Citation2014). Decorrelation in space and time between the two consecutive SAR acquisitions can, however, affect the robustness of the results (Zebker and Villasenor Citation1992). Artefacts due to atmospheric and orbital errors could significantly degrade the accuracy of measurement (e.g. Ferretti et al. Citation2001; Li et al. Citation2005). Multi-interferogram techniques, including SBAS (Small Baseline Subset) InSAR, PSInSAR (Persistent Scatterers InSAR), and SqueeSAR, have been proposed to overcome these problems and retrieve time-series deformation histories (e.g. Ferretti et al. Citation2001, Citation2011; Hooper et al. 2004, Citation2007; Hooper and Zebker Citation2007; Hooper Citation2008; Lu and Zhang Citation2014; Qu et al. Citation2015).
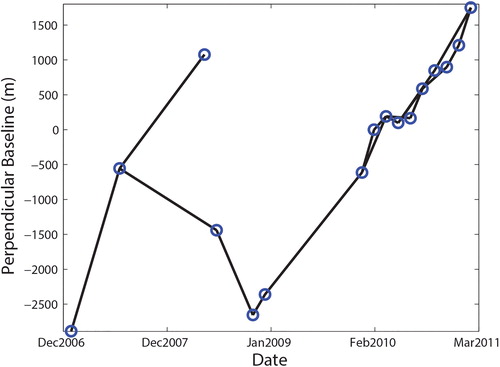
The SAR data used in this study were provided by the ALOS that was launched by the Japan Aerospace Exploration Agency (JAXA) in January 2006. We utilized the HH-polarized Fine-beam mode PALSAR (Phased Array type L-band SAR) collectively spanning from 1 January 2007 to 27 February 2011 ().
Figure 2. InSAR pair configuration of perpendicular and temporal baselines. Each circle expresses a SAR acquisition. Lines represent the generated differential interferograms. Perpendicular baselines of all InSAR pairs are calculated with respect to the reference image (first SAR acquisition).
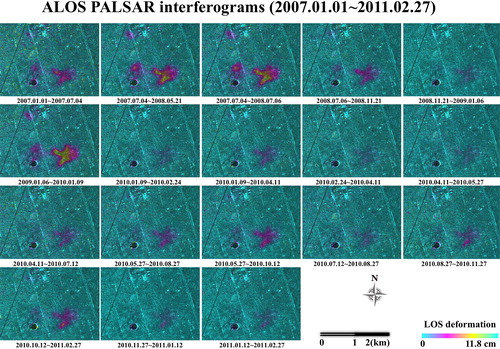
All SAR images are co-registered to a single master image by computing the offsets in range and azimuth between each of the slave images and the master image and then resampling the slave image to precisely match with the master image. The calculation of the offsets between two SAR images is based on the local spatial correlation for a number of small windows (e.g. 64 pixels by 64 pixels) throughout the image; the optimum range and azimuth offsets that maximize the local correlation can be determined by the cross correlation of the SAR intensity images. The calculated offsets at many locations throughout the images are then used to define the coefficients of the polynomial that allows the resampling of the slave image to the master one. Initially, all interferograms with spatial baseline of less than 2500 m and temporal baselines of 12 months were generated. Inspection of these interferograms indicates the coherence over the peak of the deformation zone is significantly reduced if spatial or temporal baseline increases markedly. This is caused by the nature of the deforming zone: large deformation rate in time and high deformation gradient in space. After quality screening, a total of 18 interferograms with high coherence were used in this analysis (). The topographic effect is removed using the 1-arc-second (∼30 m) SRTM (Shuttle Radar Topography Mission) DEM data. Based on all 18 interferograms, the residual topography components and orbital errors (including some large-scale atmospheric effects) were modelled and corrected by considering the relationship of residual phases with perpendicular baselines (residual topography phases) and two-dimensional (2D) phase variation as a polynomial form (orbital errors) (e.g. Ferretti et al. Citation2001; Hooper et al. Citation2004; Lu and Dzurisin Citation2014).
Figure 3. Unwrapped differential interferograms from 2007 to 2011, showing LOS range change (mostly subsidence). Each fringe represents a LOS range change of 11.8 cm. Source: Author
As the study area in West Texas is flat (topography variations are less than 20 m), atmospheric artefacts (caused by turbulent troposphere) in interferograms can be reduced by stacking (e.g. Shirzaei and Bürgmann Citation2012). We can then estimate the mean deformation phase rate as follows:
(2)
(2)
where N is the total number of the differential interferograms, φph_rate is the mean phase rate, Δtj is the jth time interval, and φj is the phase of the jth differential interferogram.
A least-squares method can be applied to invert for the time series of the deformation from a series of time-dependent differential interferogram phases as follows:
(3)
(3)
where m= [m1, m2,…, mi,…, mk−1]T, mi is the ith element of the incremental chronological range change between two adjacent SAR acquisitions, and k is the total SAR acquisitions; d= [d1, d2,…, di,…, dn]T, di is the observed phase of the ith interferogram, and n is the total number of interferograms (); the element of G will be 1 if the interferogram spans the corresponding SAR acquisitions, otherwise 0. After m is obtained through an inversion of the matrix G, the cumulative LOS (line-of-sight) range change (deformation), can be calculated.
3. Results and discussions
The map of the mean deformation rate based on the stacking technique and the average deformation rates along two profiles are shown in and , respectively; the time-series deformation maps estimated from our simple SBAS InSAR method are shown in .
Figure 4. Mean LOS deformation rates (cm/yr) around Wink sinkholes. Maximum LOS deformation rate reaches ∼30 cm/yr (∼40 cm/year subsidence when it is converted from LOS to vertical direction). Source: Author
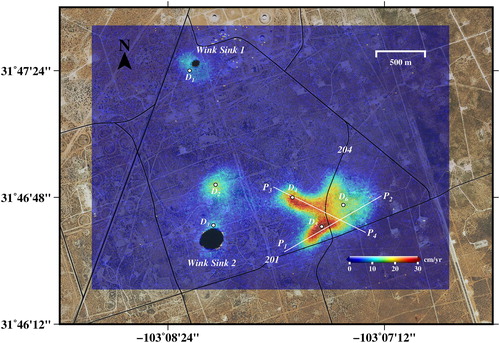
Figure 5. Mean LOS deformation rate (cm/yr) along (a) P1–P2 and (b) P3–P4 in .
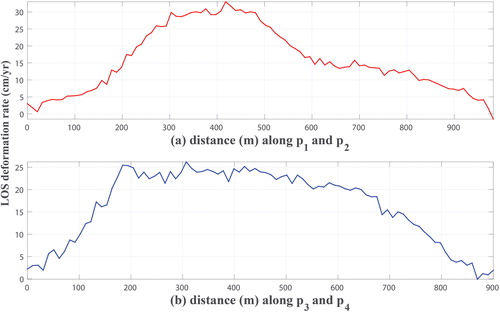
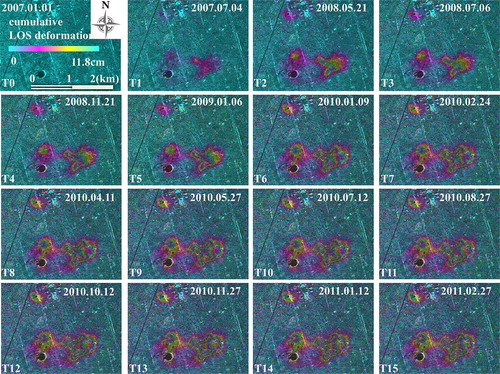
Figure 6. Cumulative time-series LOS deformation (each fringe cycle represents a LSO range change of 11.8) around Wink sinkholes estimated from 16 ALOS-PALSAR scenes. Subfigures Ti (i = 0, 1, 2, …, 15) correspond to the cumulative LOS deformation images between the first (2007.01.01) and the ith acquisition date. We mark the number and the corresponding date as following (0: 2007.01.01; 1: 2007.07.04; 2: 2008.05.21; 3: 2008.07.06; 4: 2008.11.21; 5: 2009.01.06; 6: 2010.01.09; 7: 2010.02.24; 8: 2010.04.11; 9: 2010.05.27; 10: 2010.07.12; 11: 2010.08.27; 12: 2010.1012; 13: 2010.11.27; 14: 2011.01.12; 15: 2011.02.27). Source: Author
From January 2007 to February 2011 (∼4-year span), the cumulative LOS deformation was approximated as 125 cm over the area located about 1 km northeast of Wink Sink 2 (line D5 on ). Because the LOS deformation reflects the ground motion in vertical direction (subsidence) dominantly (Kim et al. Citation2016; Kim and Lu Citation2018) and the LOS deformation can be converted to the ground motion in vertical direction by using an incidence angle of 38.74°. The peak subsidence reached to ∼40 cm/year. Subsidence was also occurring in the existing sinkholes. Over Wink Sink 1, the cumulative LOS deformation was more than 30 cm (∼10 cm/year vertical subsidence). The region 500 m north of Wink Sink 2 shows 60 cm cumulative LOS changes (∼20 cm/year subsidence). However, the most troubling place in the Wink area is the region 1 km northeast of Wink Sink 2, experiencing an average subsidence rate of ∼40 cm/year.
Figure 7. (a) Time-series cumulative LOS deformation at four points (D1, D2, D3, D4). (b) Precipitation (black lines) and groundwater depth (blue diamonds) during ALOS acquisition period (January 2007–February 2011) at weather station (USW00023040) and groundwater well (N4616103), respectively. The precipitation data are from NOAA (National Oceanic and Atmospheric Administration) National Weather Service.
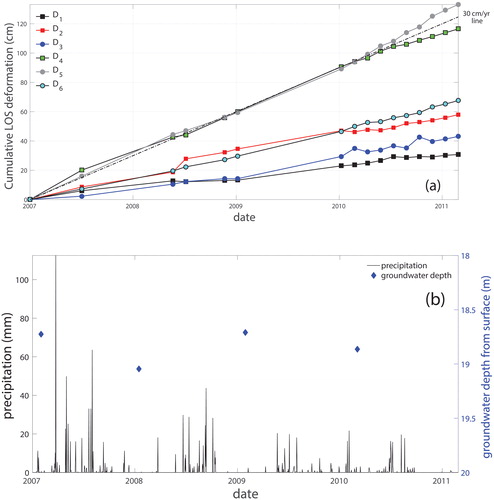
To delineate the temporal deformation patterns at the points of the deforming areas, we selected six subsidence points (). The patterns of these deformations from 01/01/2007 to 02/27/2011 are shown in . It is obvious that the subsidence was steady without seasonal fluctuations during 2007–2011, which represents an important signature of ground subsidence due to salt dissolution as suggested by Kim and Lu (Citation2018).
The peak subsidence during 2007–2011 is around D5, however, from 2015 to 2016 (Kim et al. Citation2019), it was slightly southeast of D5, over the intersection between county roads 201 and 204 (Kim and Lu Citation2018; Kim et al. Citation2019). This suggests the peak of subsidence over the area east of Wink Sink 2 is migrating slightly south and east with time. The subsidence near Wink Sink 1 was ∼10 cm/year while it was ∼ 20 cm/year over the area north of Wink Sink 2 during 2007–2011. The subsidence over these regions during 2015–2017 was ∼5 cm/year (Kim et al. Citation2019). These suggest the subsidence over Wink Sink 1, Wink Sink 2 and the area north of Wink Sink 2 decayed with time, which is consistent with the stabilization of two existing sinkholes in term of their dimensions (Kim et al. Citation2019). Since the time of each of the two Wink sinkhole collapses, their respective underground cavities have continuously filled with the debris from upper formations (mostly sandstones). The void-filling process, called a suffusion (Waltham et al. Citation2005), results in the surface subsidence in early stage of sinkhole collapse and then the gradual surface stabilization as a consequence of nearly fully-filled cavity.
When compared with the linear 30 cm/year line (dotdash line in ), the LOS deformation at the peak of subsiding area (D5) accelerated from 30 cm/year before 2010 to ∼38.9 cm/year afterwards. Therefore, the peak subsidence accelerated from ∼40 cm/year (30 cm/year in LOS) to 50 cm/year (38.9 cm/year in LOS) during 2010 and 2011 () (note: the peak LOS deformation is generally not affected by horizontal components, because it is often located where east-west movements become nearly zero (Kim and Lu Citation2018). Therefore, the peak LOS deformation can be converted to the peak subsidence without considering deformation in horizontal direction). As the location of the peak subsidence migrated southward from 2011 to 2016, the rate of peak subsidence also rose from ∼40 cm/year during 2007–2010 (), to ∼50 cm/year in 2010 and 2011 (), to ∼60 cm/year during 2015 and 2016 (Kim et al. Citation2019). The acceleration could be due to the lower precipitation in 2009 and 2010 (). In fact, the 2011 drought was the worst in the past 30 years in Texas: the precipitation in West Texas was less than a quarter of the 30-year annual average precipitation (Kim et al. Citation2019). Drought events increase vulnerability to sinkhole development due to the increased overburden stress caused by the lowered groundwater level (Gutiérrez et al. Citation2014). The increased effective stress and internal erosion in the overlying layers can result in more rapid downward percolation of freshwater in aquifer systems into the underlying salt beds (Linares et al. Citation2017), finally causing the acceleration of the salt dissolution and surface/subsurface subsidence. Unfortunately, we do not have continuous groundwater-level measurements near Wink the sinkholes, however, annual measurements are available from a nearby well N4616103 (blue triangle in ; data on ). Our InSAR results suggest that the subsidence near Wink sinkholes due to the dissolution of salt beds has accelerated and expanded after the 2011 drought ().
4. Conclusion
InSAR techniques can indeed provide important information on sinkhole development. We have processed four years of InSAR data collected during 01/01/2007–02/27/2011so as to monitor the deformation of existing sinkholes and surrounding areas near Wink, Texas. The time series of the InSAR deformation clearly shows that the existing sinkholes are continuously subsiding and that conditions that could lead to new ones are developing at an alarming rate. Particularly, the area east of Wink Sink 2, which has shown dramatic subsidence of ∼60 cm/year during 2015 and 2016 (Kim et al. Citation2019) was already sinking at a rate of 40–50 cm/year during 2007–2011. The subsidence rate ramps up after 2010, as precipitation declined, particularly during the 2011 record drought. We conclude it is critically important to not only continue monitoring the area east of Wink, but also to develop a plan to mitigate potential disasters in case the ground collapses.
Acknowledgements
The ALOS PALSAR datasets were provided by the Japan Aerospace Exploration Agency (JAXA) via the Alaska Satellite Facility (ASF) Distributed Active Archive Center (DAAC).
Disclosure statement
No potential conflict of interest was reported by the authors.
Additional information
Funding
Related Research Data
References
- Abelson M, Baer G, Shtivelman V, Wachs D, Raz E, Crouvi O, Kurzon I, Yechieli Y. 2003. Collapse-sinkholes and radar interferometry reveal neotectonics concealed within the Dead Sea basin. Geophys Res Lett. 30(10):1545. doi: 10.1029/2003GL017103
- Amelung F, Galloway DL, Bell J, Zebker HA, Laczniak R. 1999. Sensing the ups and downs of Las Vegas: InSAR reveals structural control of land subsidence and aquifer-system deformation. Geol. 27(6):483–486.
- Baer G, Schattner U, Wachs D, Sandwell D, Wdowinski S, Frydman S. 2002. The lowest place on Earth is subsiding – an InSAR (interferometric synthetic aperture radar) perspective. GSA Bullet. 114(1):12–23.
- Bawden GW, Thatcher W, Stein RS, Hudnut KW, Peltzer G. 2001. Tectonic contraction across Los Angeles after removal of groundwater pumping effects. Nature. 412(6849):812–815.
- Beck BF, Pearson FM. 1995. Karst Geohazards: Engineering and environmental problems in karst terrane: Proceedings of the Fifth Multidisciplinary Conference on Sinkholes and the Engineering and Environmental Impact of Karst, Gatlinburg, Tennessee, 2–5 April 1995: Balkema, Rotterdam, 582 pp.
- Bruno E, Calcaterra D, Parise M. 2008. Development and morphometry of sinkholes in coastal plains of Apulia, southern Italy. Preliminary sinkhole susceptibility assessment. Eng. Geol. 99(3/4):198–209.
- Carbonel D, Rodríguez-Tribaldos V, Gutiérrez F, Galve JP, Guerrero J, Zarroca M, Roqué C, Linares R, McCalpin JP, Acosta E. 2015. Investigating a damaging buried sinkhole cluster in an urban area (Zaragoza city, NE Spain) integrating multiple techniques: Geomorphological surveys, DInSAR, DEMs, GPR, ERT, and trenching. Geomorphology. 229:3–16.
- Castañeda C, Gutiérrez F, Manunta M, Galve JP. 2009. DInSAR measurements of ground deformation by sinkholes, mining subsidence, and landslides, Ebro River, Spain. Earth Surf Process Landforms. 34(11):1562–1574.
- Castañeda C, Pourthié N, Souyris J. 2011. Dedicated SAR interferometric analysis to detect subtle deformation in evaporite areas around Zaragoza, NE Spain. Int J Remote Sens. 32(7):1861–1884.
- Chang L, Hanssen RF. 2014. Detection of cavity migration and sinkhole risk using radar interferometric time series. Remote Sens Environ. 147:56–64.
- Ferretti A, Prati C, Rocca F. 2001. Permanent scatterers in SAR interferometry. IEEE Trans Geosci Remote Sens. 39(1):8–20.
- Ferretti A, Fumagalli A, Novali F, Prati C, Rocca F, Rucci A. 2011. A new algorithm for processing interferometric data-stacks: SqueeSAR. IEEE Trans Geosci Remote Sens. 49(9):3460–3470.
- Filin S, Baruch A. 2010. Detection of sinkhole hazards using airborne laser scanning data. Photogramm Eng Remote Sens. 76:577–587.
- Filin S, Baruch A, Avni Y, Marco S. 2011. Sinkhole characterization in the Dead Sea area using airborne laser scanning. Nat Hazards. 58(3):1135–1154.
- Galve JP, Castañeda C, Gutiérrez F, Herrera G. 2015. Assessing sinkhole activity in the Ebro Valley mantled evaporite karst using advanced DInSAR. Geomorphology. 229:30–44.
- Galve JP, Gutiérrez F, Remondo J, Bonachea J, Lucha P, Cendrero A. 2009. Evaluating and comparing methods of sinkhole susceptibility mapping in the Ebro Valley evaporite karst (NE Spain). Geomorphology. 111(3/4):160–172.
- Gutiérrez F, Galve JP, Lucha P, Castañeda C, Bonachea J, Guerrero J. 2011. Integrating geomorphological mapping, trenching, InSAR and GPR for the identification and characterization of sinkholes: A review and application in the mantled evaporite karst of the Ebro Valley (NE Spain). Geomorphology. 134(1/2):144–156.
- Gutiérrez F, Parise M, De Waele J, Jourde H. 2014. A review on natural and human-induced geohazards and impacts in karst. Earth–Sci Rev. 138:61–88.
- Hanssen RF. 2001. Radar interferometry: data interpretation and error analysis. New York, Boston, Dordrecht, London, Moscow: Kluwer Academic Publisher.
- Hooper A. 2008. Amulti-temporal InSAR method incorporating both persistent scatterer and small baseline approaches. Geophys Res Lett. 35:L16302.
- Hooper A, Segall P, Zebker H. 2007. Persistent scatterer interferometric synthetic aperture radar for crustal deformation analysis, with application to Volcán Alcedo, Galápagos. J Geophys Res: Solid Earth. 112:B07407.
- Hooper A, Zebker H. 2007. Phase unwrapping in three dimensions with application to InSAR time series. J Opt Soc Am A. 24(9):2737–2747.
- Hooper A, Zebker H, Segall B, Kampes B. 2004. A new method for measuring deformation on volcanoes and other natural terrains using InSAR persistent scatterers. Geophys Res Lett. 31:L23611.
- Jones CE, Blom RG. 2014. Bayou Corne, Louisiana, sinkhole: Precursory deformation measured by radar interferometry. Geology. 42(2):111–114.
- Johnson KS, Collins WW, Seni SJ. 2003. Sinkholes and land subsidence due to salt dissolution near Wink, West Texas, and other sites in western Texas and New Mexico (Oklahoma Geological Survey, Circular 109). Norman, OK: Oklahoma Geological Survey, p.183–195.
- Johnson KS, Neal JT. 2003. Evaporite karst and engineering/environmental problems in the United States (Oklahoma Geological Survey Circular, 109). ISSN 0078-4397,353 pp.
- Kim JW, Lu Z, Degrandpre K. 2016. Ongoing deformation of sinkholes in Wink, Texas, observed by time-series Sentinel-1A SAR interferometry (preliminary results). Remote Sens. 8(4):313.
- Kim JW, Lu Z. 2018. Association between localized geohazards in West Texas and human activities, recognized by Sentinel-1A/B satellite radar imagery. Sci Rep. 8(1):4727.
- Kim JW, Lu Z, Kaufmann J. 2019. Evolution of sinkholes over Wink, Texas observed by high-resolution optical and SAR imagery. Remote Sensing of Environment, 222, 119–132.
- Kuniansky E, Weary D, Kaufmann J. 2016. The current status of mapping karst areas and availability of public sinkhole-risk resources in karst terrains of the United States. Hydrogeol J. 24(3):613–624.
- Li Z, Muller JP, Cross P, Fielding EJ. 2005. Interferometric synthetic aperture radar (InSAR) atmospheric correction: GPS, moderate resolution imaging spectroradiometer (MODIS), and InSAR integration. J Geophys Res. 110:B03410.
- Linares R, Roqué C, Gutiérrez F, Zarroca M, Carbonel D, Bach J, Fabregat I. 2017. The impact of droughts and climate change on sinkhole occurrence. A case study from the evaporite karst of the Fluvia Valley, NE Spain. Sci Total Environ. 579:345–358.
- Lu Z, Danskin W. 2001. InSAR analysis of natural recharge to define structure of a ground-water basin, San Bernardino, California. Geophys Res Lett. 28(13):2661–2664.
- Lu Z, Dzurisin D. 2014. InSAR imaging of Aleutian volcanoes: monitoring a volcanic arc from space, Chichester, UK: Springer Praxis Books. Geophysical Sciences. ISBN 978-3-642-00347-9: 390 pp.
- Lu Z, Dzurisin D, Jung HS, Zhang JX, Zhang YH. 2010. Radar image and data fusion for natural hazards characterization. Int J Image Data Fus. 1(3):217–242.
- Lu Z, Zhang L. 2014. Frontiers of radar remote sensing. Photogramm Eng Remote Sens. 80(1):5–13.
- Margiotta S, Negri S, Parise M, Valloni R. 2012. Mapping the susceptibility to sinkholes in coastal areas, based on stratigraphy, geomorphology and geophysics. Nat Hazards. 62(2):657–676.
- Massonnet D, Rossi M, Carmona C, Adragna F, Peltzer G, Feigl K, Rabaute T. 1993. The displacement field of the Landers earthquake mapped by radar interferometry. Nature. 364(6433):138–142.
- Nof RN, Baer G, Ziv A, Raz E, Atzori S, Salvi S. 2013. Sinkhole precursors along the Dead Sea, Israel, revealed by SAR interferometry. Geology. 41(9):1019–1022.
- Paine JG, Buckley SM, Collins EW, Wilson CR. 2012. Assessing collapse risk in evaporite sinkhole-prone areas using microgravimetry and radar interferometry. J Environ Eng Geophys. 17(2):75–87.
- Qu F, Lu Z, Zhang Q, Bawden GW, Kim J, Zhao C, Qu W. 2015. Mapping ground deformation over Houston–Galveston, Texas using multi-temporal InSAR. Remote Sens Environ. 169:290–306.
- Rosen PA, Hensley S, Joughin IR, Li FK, Madsen SN, Rodriguez E, Goldstein RM. 2000. Synthetic aperture radar interferometry. Proc Ieee. 88(3):333–382.
- Rucker ML, Panda BB, Meyers RA, Lommler JC. 2013. Using InSAR to detect subsidence at brine wells, sinkhole sites, and mines. Carbonates Evaporites. 28(1–2):141–147.
- Shirzaei M, Bürgmann R. 2012. Topography correlated atmospheric delay correction in radar interferometry using wavelet transforms. Geophys Res Lett. 39(1).
- Vaccari A, Stuecheli M, Bruckno B, Hoppe E, Acton ST. 2013. Detection of geophysical features in InSAR point cloud data sets using spatiotemporal models. Int J Remote Sens. 34(22):8215–8234.
- Waltham T, Bell F, Culshaw M. 2005. Sinkholes and subsidence: karst and cavernous rocks in engineering and construction. Berlin: Springer. ISBN 3-540-20725-2: 383 pp.
- Wust-Bloch GH, Joswig M. 2006. Pre-collapse identification of sinkholes in unconsolidated media at Dead Sea area by ‘nanoseismic monitoring’ (graphical jackknife location of weak sources by few, low-SNR records). Geophys J Int. 167(3):1220–1232.
- Yerro A, Corominas J, Monells D, Mallorquí JJ. 2014. Analysis of the evolution of ground movements in a low densely urban area by means of DInSAR technique. Eng Geol. 170:52–65.
- Zebker HA, Villasenor J. 1992. Decorrelation in interferometric radar echoes. IEEE Trans Geosci Remote Sens. 30(5):950–959.