
 ?Mathematical formulae have been encoded as MathML and are displayed in this HTML version using MathJax in order to improve their display. Uncheck the box to turn MathJax off. This feature requires Javascript. Click on a formula to zoom.
Abstract
Despite paleochannels play a key role in the evolution of aeolian dune patterns, little attention has been paid on the interactions between paleochannels and aeolian processes. The objective of this article is to analyze the interactions between paleochannels and aeolian processes and their implications on the aeolian dune patterns. One site in the Kuruk Tagh Desert in eastern margin of the Tarim Basin, northwestern China is selected as the case study area. We analyze the sedimentary environment of the aeolian dunes around paleochannels based on the grain-size parameters. Furthermore, we present spatial and temporal dynamics of the vegetation and aeolian dunes around the paleochannels. The results indicate that: (1) ground water determines the spatial distribution of the vegetation and controls the evolution of aeolian dune patterns indirectly; (2) aeolian dunes around the paleochannels are initially controlled by fluvial and aeolian processes collectively. Then, the aeolian processes always play a dominant role after the drying up of these paleochannels; (3) the paleochannels in aeolian processes dominated areas ultimately evolve into a belt sand source due to the deposition of aeolian sediments and the encroachment of aeolian dunes. The timescale of the paleochannels’vanishment depends not only on the depth and width of the channels, but also on the angle between bedform orientation and prevailing sand flux direction.
1. Introduction
In arid zones, landscapes are sculptured by the fluvial and aeolian processes (Bullard and Livingstone Citation2002; Liu and Coulthard Citation2015; Ta et al. Citation2015; Liu and Coulthard Citation2017). Many dune fields and sand seas on Earth are located within drainage basins (Bullard and Nash Citation1998; Lancaster Citation2002; McTainsh and Bullard Citation2003; Yan et al. Citation2015). Most arid landscapes are the integrating products of fluvial and aeolian interactions. Historically, fluvial and aeolian systems have been viewed as independently (Bullard and Livingstone Citation2002; Liu and Coulthard Citation2015). Although there are increasingly researchers examining the interactions between fluvial and aeolian processes in recent years (Field et al. Citation2009; Belnap et al. Citation2011), there are still considerable problems over these systems.
From a fluvial perspective, fluvial processes have significant effects on the evolution of deserts (Maroulis et al. Citation2007; Liu and Coulthard Citation2015). Fluvial systems serve to generate significant supplies of sediments to the formation of aeolian dunes (Clarke and Rendell Citation1998; Kocurek Citation1998). Rivers affect the aeolian processes directly through trapping and transporting the aeolian sands, acting as an obstacle for the progression of aeolian dunes (Sweet et al. Citation1988; Muhs et al. Citation2003). In addition, in desert regions, rivers could control sediment transport through changing of the moisture availability and vegetation cover (Bullard Citation1997; Aishan et al. Citation2015). However, many channels in the world deserts have been developed into the paleochannels due to the long-term drying-up. Little attentions have been paid on the effects of paleochannels on aeolian dune patterns.
Furthermore, aeolian processes also affect the stability of paleochannels. Aeolian dunes have been found to lead to 40 times increasing in bed load (Smith and Smith Citation1984) and result in narrowing, aggrading and damming of the desert channels (Teller and Lancaster Citation1986). Some of previous floodplains have become a new field of aeolian dunes due to the extreme climate event or long term aeolian processes (Hollands et al. Citation2006). Additionally, some channels in deserts adjust their position and direction dramatically when they meet with the aeolian dunes (Smith and Smith Citation1984; Jones and Blakey Citation1997). In desert settings, some rivers run continuously (perennial river), some are ephemeral and some others might be dry long term. Different statuses of the desert river may lead to different interaction modes with aeolian processes. However, few studies have investigated the response of long-term drying-up of desert channels to the aeolian processes comprehensively.
Consequently, additional researches are needed to understand the relationships between paleochannels and aeolian dune patterns. It is supposed that the evolution of paleochannels will significantly affect the aeolian processes around them and vice-versa. Therefore, the objectives of this study are: (1) to understand the relationships between paleochannels and aeolian dune field patterns; (2) to characterize the key role of aeolian processes on the stability of paleochannels; (3) to develop a conceptual model of interaction relationship between fluvial and aeolian processes.
2. Regional settings
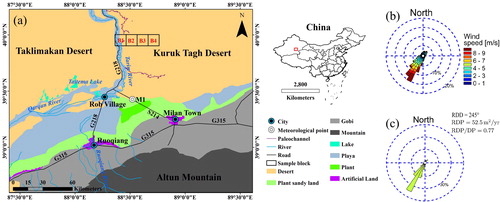
The study site is located at the downstream of the Tarim River in Xinjiang, NW China, borders of Taklimakan Desert and Kuruk Tagh Desert (). The site is exposed to the strong northeastern unimodal winds (). Loose sediments on the floodplain and high wind energy (the sand transporting wind accounts for 48.35% of the whole year) lead to high frequent sand storms and dust. Due to the low precipitation (annual precipitation is lower than 15 mm (Aishan et al. Citation2015)), higher evaporation (potential evaporation could reach 2500–3000 mm (Aishan et al. Citation2015)) and the sparse vegetation cover, the dune mobility index from the study of Lancaster is up to 12,164 (Lancaster Citation1988). Nebkhas, shadow dunes, barchan dunes and the giant compound or complex crescent dunes are the dominant aeolian dune types. Landscapes in this area are supposed as the integrating products of fluvial and aeolian processes. There are many paleochannels in this desert due to the long-term drying up of the rivers and the erosion of strong wind.
Figure 1. The study site in the Kuruk Tagh Desert, eastern margin of Tarim Basin, NW, China and the wind regime. (a) Location of box transects (black boxes) perpendicular to the Tarim River and the meteorological station (M1) near the Taitema Lake. (b) The wind roses calculated by the wind data from the meteorological station M1 at 10 m above the land surface since January 1th to December 31th in 2016. (c) The sediment flux roses predicted according to Courrech du Pont et al. (Citation2014) with the data from the meteorological station M1. The prevailing wind is from the northeastern direction.
3. Methods
3.1. Meteorological data
The wind data in this study were obtained from an automatic meteorological station (39°25′45ʺ N, 88°31′09ʺ E) at an interval of 1 min at 10 m above the land surface since 1 January 2016 to 31 December 2016. The resolution of the sensors for wind speed and direction is 0.01 m s−1 and 1°, respectively. The parameters of wind energy environment have been calculated using the method of Courrech du Pont et al. (Citation2014). The parameters include drift potential (DP, in m2 yr−1); resultant drift potential (RDP in m2 yr−1); resultant drift direction (RDD in degree) and the directional variability (RDP/DP) ().
3.2. Sediment sampling
Field experiments were conducted on 27 April 2018. A degraded nebkha (dome-like in geometry with 3.30 m height, 14.20 m width) was selected randomly with the consideration that it locates around the paleochannels. This nebkha could represent the most nebkhas around the study area with the consideration of size and degradation degree. A total of 12 samples have been collected from the dune surface to the dune plinth at per layer of 30 cm. All of these samples were collected for grain-size analysis.
In the laboratory, the sand samples were air-dried and sieved using a 1 mm sieve. We got 5 g subsamples from the sieved sediments for the grain-size analysis. The grain-size of all the sediments had been determined using a laser particle size analyzer (BT-2001, Bettersize, in China). This analyzer could measure the grain size of the particles suspended in water basing on the principle of light scattering. The measure range of this analyzer is 0.1–1036 .
3.3. Remote sensing data
Using Google Earth high-resolution images, nebkhas, shadow dunes, barchan dunes, compound dunes, rivers and floodplains have been identified in the study area. Dune pattern parameters, including crest length and orientation for shadow dunes, and the diameter of nebkhas, have been traced manually. To determine the vegetation fractional coverage (VFC) variability, four remote sensing images with 30 m spatial resolution (Landsat 5 images in 1991, 1999, 2005 and Landsat 8 image in 2015) have been downloaded from USGS (https://glovis.usgs.gov/). To determine the VFC variability spatially, one transect with the scale of 10 × 40 km2 perpendicular to the Tarim River has been selected. Four box transects with the scale of 10 × 10 km2 have been set in the selected belt (). All of the Landsat images have been converted from digital numbers (DN) to the radiance with the method of Jiapaer et al. (Citation2011). Furthermore, the ENVI FLAASH model has been used to remove the influence of the atmosphere. To compare the VFC of each box transect, the image to image registration method in ENVI has been used to correct these images based on pixel scale.
4. Results
4.1. The vegetation dynamics around paleochannels
To relate the vegetation coverage and aeolian dune patterns, some thresholds of vegetation coverage were used. Previous research found that 14–16% of the VFC are the threshold values to differentiate the mobility of aeolian dunes (Lancaster and Baas Citation1998). Here we choose the critical values () of vegetation cover to study the temporal and spatial dynamics of the VFC. and show the spatial and temporal variation of the VFC.
Figure 2. Vegetation spatial and temporal dynamics in selected box transects. The horizontal axis represents the box transects B1 (39°57′13ʺ N, 88°24′51ʺ E), B2 (39°57′ N, 88°30′53ʺ E), B3 (39°57′03ʺ N, 88°36′47ʺ E) and B4 (39°57′11ʺ N, 88°42′45ʺ E), respectively. The vertical axis represents the year of each remote sense image acquired. The mobility of the desert could be identified according to the range of the VFC in .
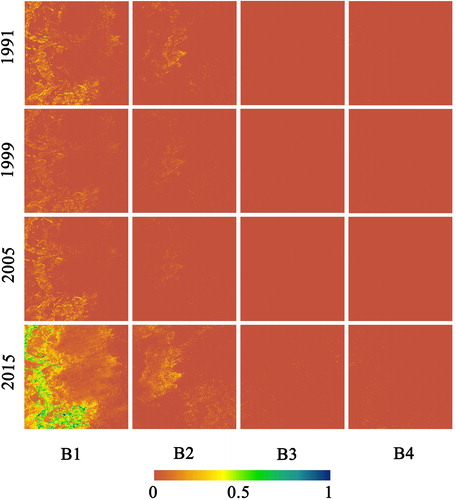
Table 1. Classification of land cover and the vegetation fractional coverage (VFC).
Table 2. Vegetation fractional coverage in four box transects.
shows that in these selected four box transects, almost all of the vegetation distributed within 10 km away from rivers. The VFC values decrease sharply with distance from the river (). The semi-fixed sand and fixed sand area presented an increase trend from 1999 to 2015. For example, in the first box transect, the semi-fixed sand area is 4.64% (1999), 5.19% (2005) and 10.14% (2015), respectively. Furthermore, the fixed sand area increased from 0 in 1999, 0.04% in 2005 to 0.10% in 2015. However, the landscape type in the B2, B3 and B4 transects almost do not change from 1991 to 2015.
4.2. Aeolian dune patterns around paleochannels
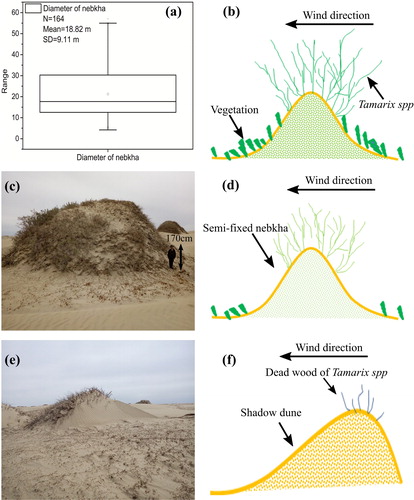
shows the typical geomorphology pattern at the eastern margin of the Tarim Basin. The type of aeolian dune increases with distance from the river bank. The dune patterns change from simple type around the river, such as nebkhas, shadow dunes and barchan dunes, to complex or compound ones, such as compound crescent dunes in desert hinterland. Nebkhas in study area locate around or close to the river banks. They are covered by long-lived the Tamarix spp. and approximately hemispherical with the averaged diameter 18.82 ± 9.11 m (). These nebkhas could be divided into three types according to the locations. The first type of nebkha is fixed completely by the Tamarix spp. and distribute mainly around the modern river banks (). The second one is the semi-fixed nebkhas, which distribute around the ecotone zone of desert and oasis (). The third type of nebkha is the reactivated ones, which distribute near the paleochannels ().
Figure 3. Conceptual diagram of the sand dune pattern perpendicular to the river at the lower reach of the Tarim River in eastern margin of the Tarim Basin, NW China. The main species in study area are the Populus euphratica and the Tamarix spp. The modern river is shown in blue. The paleochannel is presented in yellow. The black arrows show the flow and wind directions.
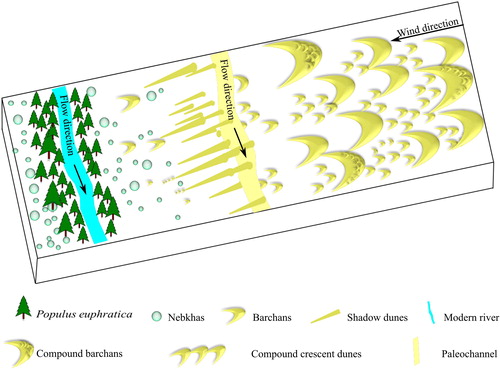
Figure 4. Nebkhas along the river and floodplain. (a) The box plot is the statistic result of the diameters from 164 nebkhas around the river and floodplain. The diameters of the nebkhas were traced manually on the Google Earth image with 0.11 m resolution. (b) Conceptual diagram of a nebkha anchored by the Tamarix spp. along the modern river. These nebkhas are also covered by some herbaceous. (c) A semi-fixed nebkha in the dry floodplain. (d) Conceptual diagram of a degraded Tamarix spp. nebkha on the dry floodplain at the ecotone zone of desert and oasis. (e) A degraded nebkha with the deadwood on the dune surface. (f) Conceptual diagram of the degraded nebkha around the paleochannels. All photos were taken in 27 April 2017.
Shadow dunes in study area developed at the lee side of nebkhas. They have a longitudinal shape, sharp-edged crest similar to a seif dune (). According to the typical morphology of these shadow dunes, five typical patterns are identified: (1) shadow dunes formed at the lee side of a single nebkha (); (2) shadow dunes formed at lee side of two side by side nebkhas (); (3) shadow dunes formed at the lee side of two staggered nebkhas (); (4) shadow dunes formed at the lee side of two nebkhas in line (parallel to the resultant transport direction) () and (5) shadow dunes formed at lee side of a few nebkhas (). Length of these shadow dunes varies due to the alignment and the size of the nebkhas ().
Figure 5. Shadow dunes at lee side of nebkhas in Kuruk Tagh Desert, eastern margin of Tarim Basin, NW China. (a) Shadow dune at lee side of a single nebkha dune (39°56′18ʺ N, 88°29′11ʺ E). (b) Shadow dunes at the lee side of two side by side nebkhas (39°59′38ʺ N, 88°29′25ʺ E). (c) Shadow dune at lee side of two staggered nebkhas (39°58′18ʺ N, 88°29′24ʺ E). (d) Shadow dune at lee side of two nebkhas in a line (bead-like dunes) (39°58′43ʺ N, 88°29′41ʺ E). (e) Shadow dune at lee side of many nebkhas (39°53′54ʺ N, 88°25′18ʺ E). (f) Relationship between the nebkha width and length of the shadow dunes. All of the widths and the lengths of dunes have been traced manually on the high resolution (the resolution is 0.23 m) Google Earth images. Solid line is the best linear fit.
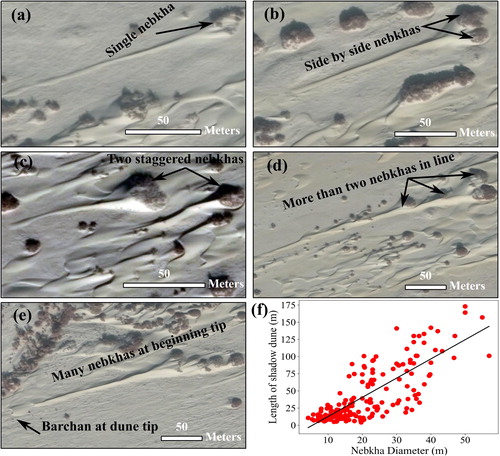
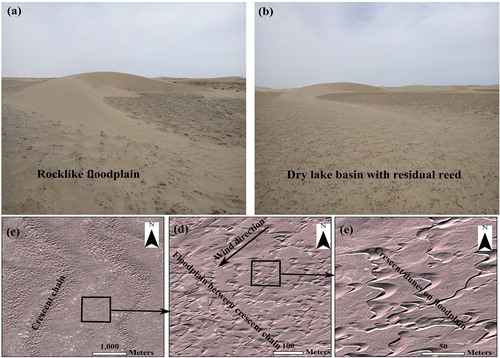
Apart from the nebkhas and shadow dunes, barchan dunes in this area always propagate on a non-erodible bed (e.g. rocklike floodplain or dry lake basin) with low sediment availability under unidirectional wind (). They have low height (2–4 m) and high propagation speed (30 m yr−1). Sediments of these barchan dunes are mainly originated from fluvial-lacustrine deposits. Furthermore, there are some complex or compound crescent dunes distributed in desert hinterland (). The orientation of these compound dunes is perpendicular to the sand-transporting direction (). Barchan dunes and the compound dunes distribute alternately in hinterland ().
Figure 6. Barchan dunes and chains in Kuruk Tagh Desert, eastern margin of Tarim Basin, NW China. (a) Barchan dunes propagate on the rocklike floodplain. The surface is rigid due to the crystallization of saline-alklizaiton lacustrine sediments. (b) Barchan dunes propagate on a dry lake basin. The surface soil is covered by the residual dry reed root. All the photos were taken in April of 2017. (c) The crescent chains propagate on the floodplain (39°56′9ʺ N, 88°58′31ʺ E). (d) The floodplain between the crescent chains (39°56′16ʺ N, 88°59′11ʺ E). (e) The crescent dunes on floodplain (39°56′7ʺ N, 88°58′38ʺ E). The crest lines of the barchan dunes and the crescent chains are orientated perpendicular to the prevailing northeastern wind direction.
4.3. Grain size distribution of nebkhas
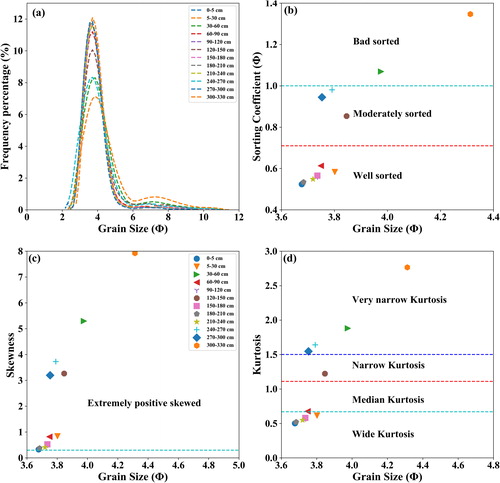
shows that sediment in this nebkha was dominantly controlled by very fine particles (0.063–0.125 mm) according to the classification system of Udden–Wentworth (Udden Citation1914; Wentworth Citation1922, Citation1935). Each of the curves is extremely right-skewed with median size 3.95 (0.077 mm) averagely. Most of the curves show unimodal characteristics except for the curves in some layers close to the dune surface (5–30 cm, 30–60 cm), root zone of the nebkha (120–150 cm) or dune plinths (240–270 cm, 300–330 cm). The sorting coefficient of sand from nebkha in the Kuruk Tagh Desert ranges from 0.52 to 1.35
(average 0.76
) (). Apart from the sample in 300–330 cm (sorting value was up to 1.35
, poorer sorting degree (1.00–2.00
)), all of the other samples are either well sorted (<0.35
) or better sorted (0.50–0.71
) or moderately sorted (0.71–1.00
) (Folk and Ward Citation1957). Sediments in all layers of are extremely skewed (the Skewness coefficient higher than 0.30 in ) (Folk and Ward Citation1957). Furthermore, the distribution of the population presents a wide kurtosis (the Kurtosis coefficient is lower than 0.67) except for the lays in root zone (30–60 cm, 120–150 cm) and dune plinths (240–270 cm, 270–300 cm and 300–330 cm), which have a narrow (the Kurtosis coefficient range from 1.11 to 1.50) or very narrow Kurtosis trend (the Kurtosis coefficient is range from 1.50 to 3.00) (Folk and Ward Citation1957) ().
Figure 7. Characteristics parameters of sediment from a nebkha (39°29′2.79ʺ N, 88°24′50.43ʺ E). (a) Frequency percentage of particle size in each layer of the nebkha; (b) sorting coefficient of the sediments; (c) skewness of the sediment; (d) Kurtosis of the sediments. All of these parameters were analyzed using the graphical methods of Folk and Ward (Citation1957). The levels corresponding to these parameters have been presented in each plot.
5. Discussion
5.1. Aeolian dune morphology around the paleochannels
5.1.1. Sedimentary environment of aeolian dunes around the paleochannels
shows that even these curves could be divided into three sub-populations, the details are different from sedimentary characteristics of the most aeolian dunes. The dominant subpopulation of these sediments is the saltation particles, accounting for 90% of total population. However, in some layers (5–30 cm, 30–60 cm, 90–120 cm, 240–270 cm and 300–330 cm), the clay particles (<0.002 mm or >9 in scale) nearly account for more than 50% of the population. In aeolian sedimentary environment, the population of the clay particles always account for very small portion (Visher Citation1969; Zhu et al. Citation2014). This high clay particle content should be from other sedimentary environment.
Figure 8. Probability cumulative frequency percentage curves of the nebkha sediment. Generally, this type of curves could be divided into three sub-populations for the aeolian sedimentary environment. The first subpopulation is contributed by the creep particles, for which the cumulative frequency percentage usually lower than 1%. The second subpopulation is contributed by saltation particles, which is dominant subpopulation and accounting for 98% of the population. The third subpopulation is contributed by the suspended particles, which only account small population for the most of the aeolian sedimentary environment (VisherCitation1969).
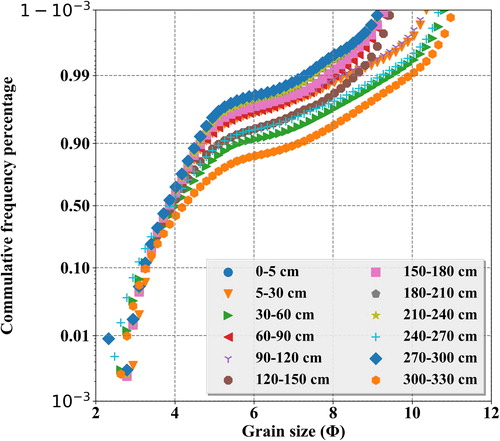
In view of the location and the grain-size characteristics, fluvial and aeolian processes are considered as the two dominant processes controlling the development of this nebkha collectively. Firstly, layers near the dune surface are dominantly controlled by the aeolian processes. Clay particles in 0–150 cm are buried with the residual leaf of the bushes. The depth of this leaf layer is up to 1.54 m from the dune surface to the boundary between leaf layers and the bottom sand. These clay particles may evolve from some silt particles or median size particles during the biochemical processes. Secondly, the clay particles near the dune plinths should be contributed by the fluvial processes. Usually sediments on floodplain or near the river banks present a bad sorting characteristic and abundant of silt and clay particles (Füchtbauer and Müller Citation1970). Sediments near the dune plinth also present the same characteristics with the fluvial sediment (e.g. bad sorting, high clay content). Furthermore, particles in these layers are easy to be affected by the fluvial processes due to their low position.
5.1.2. Wind regime and dune orientation
Generally, aeolian dune shape depends collectively on the wind strength and direction and the sand availability (Bagnold Citation1941; Pye and Tsoar Citation1990; Parteli et al. Citation2009). Here, in Kuruk Tagh Desert, the strong wind energy, long-term prevailing wind direction and low sand availability determine the aeolian dune-field pattern collectively.
Barchans in the Kuruk Tagh Desert develop on rock-like bedforms under unimodal wind condition. Strong wind energy contributes to the low height and high moving speed of these barchans. In addition, wind regime (long term unimodal wind regime) in the Kuruk Tagh Desert would not be expected to produce shadow dunes. However, there is plenty of shadow dunes developed in the lee side of nebkhas (). The mechanism for the formation of shadow dunes seems inconformity with other linear-like dunes (Rubin and Hunter Citation1987; Lucas et al. Citation2015). Previous researches shown that bimodal wind regime was the imperative condition for the linear-like dunes (Rubin and Hunter Citation1987; Lucas et al. Citation2015). Recently, Hesp and Smyth (Citation2017) reported that under unimodal condition (under simulation condition), wind speed and the width of the obstacle are the two key factors in determining the length of the shadow dune. Our results also presented a good linear relationship between the width of obstacle and the length of the shadow dunes (). Moreover, the alignment of the nebkhas also plays a key role for the shadow dune’s topography. Consequently, the development of shadow dunes in the Kuruk Tagh Desert is controlled by the wind regime, the geometry and the alignments of the nebkhas.
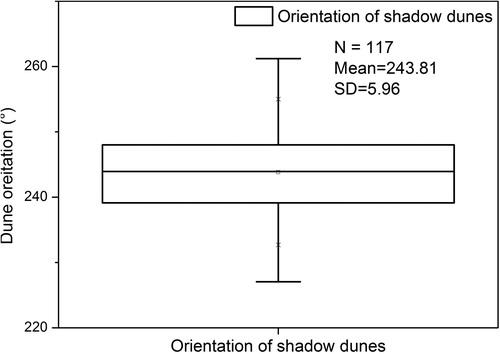
Excepting wind regimes, the meeting angle between aeolian dune and the desert rivers obeys some statistical relationships in world desert. Liu and Coulthard (Citation2015) reported that transverse dune and barchans mostly meet the desert rivers at an angle in a range of 90°–135°. Linear dunes are less dynamic and parallel with the channel directions. However, the aeolian orientation in Kuruk Tagh Desert may be dominantly controlled by the wind regimes. shows a statistic result of the orientation of the shadow dunes in the Kuruk Tagh Desert. We found that orientations (243.8 ± 6°, n = 117) of these dunes are approximately in the direction of the resultant sand flux direction (245° in ). These orientations do not change whatever the river orientations are. Consequently, wind regime is the major control factor for the dune orientation in the Kuruk Tagh Desert. Desert channels play little role in the orientation of aeolian dunes.
Figure 9. Statistics of the orientation of shadow dunes in the Kuruk Tagh Desert, eastern of the Tarim Basin, NW China. All of the orientations of shadow dunes have been traced manually on the high resolution Google Earth images. The orientations are measured clockwise from the north.
5.2. Stability of the paleochannels
The stability of these channels closely depends on the stability of the runoff of the desert channels or the groundwater levels. This dependency is particular outstanding in some aeolian dominantly controlled area. shows that groundwater level presents the same trend with the VFC in spatial distribution (). The groundwater level farther than >600 m to the river banks is more than 6 m in average, which could not sustain most of the desert vegetation. The vegetation within 600 m around the river banks sustained the stability of the channel. However, when no water was supplied (no matter in form of runoff or groundwater) to the channels, they will be dammed by the aeolian dunes or buried by the aeolian sediments soon (). The velocity of these processes mainly depends on the strength of the aeolian processes, the coverage of the vegetation, the wide and depth of the channels and the angle between the orientation of the channels and resultant sand flux direction. Finally the paleochannels will vanish and evolve into a belt-like sand source due to the deposition of aeolian sediment into the river.
Figure 10. Water table at the Yinsu hydrometric station, downstream of the Tarim River, northwest China. These data were collected since the ‘water conveyance project of The Tarim River’ has been carried out in 2000. The graph reproduced from Deng et al. (Citation2017) with the permission.
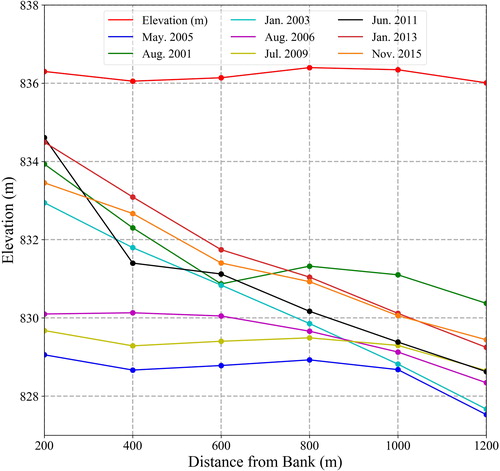
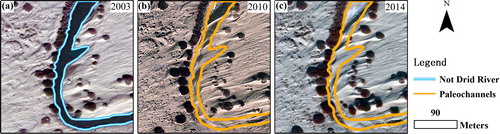
Figure 11. A random selected paleochannel in Kuruk Tagh Desert, eastern margin of Tarim Basin, NW China (39°34′44.34ʺ N, 88°26′23.71ʺ E). This paleochannel has been long-term drying up since 2003. The river bed had been dammed seriously by the aeolian processes after 11 years.
5.3. Interactions between aeolian dune and paleochannels
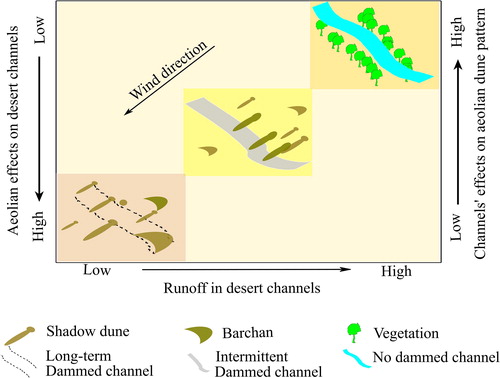
shows that when the runoff in desert channels is low or the channels have been long-term drying up, the drying river bed will be dammed by the aeolian dunes or buried by the deposition of the aeolian sediments. Desert channels in such environment will present a high instability due to the strong and long duration of aeolian processes. They make little difference for the aeolian processes no matter in upwind and downwind of the rivers and in upstream and downstream areas due to the losing of the trap capacity. Secondly, the rivers will change their shape and location frequently due to the damming of aeolian dunes if the runoff of the desert channel supplied intermittently. This is a common phenomenon in world desert (Langford Citation1989; Ta et al. Citation2015). Their existence will change the aeolian processes in upwind and downwind of the river definitely. However, they play little role on the aeolian processes at upstream and downstream due to the intermittent of runoff. Thirdly, when the runoff of the river is supplied long-termly, the river will be stable enough due to the large area of the vegetation around the river bank. Under this situation, the river and the vegetation belt around the banks play a big effect on the aeolian processes no matter at the upwind and downwind of or at the upstream and downstream of the river.
Figure 12. A conceptual diagram showing the interactions between aeolian and fluvial processes. We divide these interactions into three types. The first type is controlled by low stability of desert channels and long-term aeolian processes (the high of the strength of the aeolian processes is, more unstable of the channels will be), such as the long-term dried channels. The second one is controlled by middle stability of desert channels and strength of aeolian processes, such as the intermittently dried channels were dammed by aeolian dunes during the dry season. The third one is dominantly controlled by high stable desert channels, such as channels are long-termly supplied by runoff.
6. Conclusion
This study shows the relationship between paleochannels and aeolian dunes in a case study area located in the Kuruk Tagh Desert, eastern of the Tarim Basin. Our results showed that the aeolian dune patterns are dominantly controlled by the aeolian processes in the Kuruk Tagh Desert. The stability of the paleochannels and aeolian dune patterns depends closely on the runoff in desert channels or groundwater level near the rivers. Paleochannels were buried and evolved into the belt-like sand source and vanished. All of them only can be identified by the relics of the degraded nebkhas. In aeolian processes controlled areas, no matter the meeting angle between the river and aeolian dunes is, the orientation of aeolian dunes is dominantly controlled by the wind regime and sand availability.
Acknowledgement
We acknowledge Prof. Pengnian Yang for providing the groundwater data.
Disclosure statement
No potential conflict of interest was reported by the authors.
Additional information
Funding
References
- Aishan T, Halik Ü, Kurban A, Cyffka B, Kuba M, Betz F, Keyimu M. 2015. Eco-morphological response of floodplain forests (Populus euphratica, Oliv.) to water diversion in the lower Tarim River, Northwest China. Environ Earth Sci. 73(2):533–545.
- Bagnold RA. 1941. The Physics of Blown Sand and Desert Dunes. London: Chapman and Hall; 265 pp.
- Belnap J, Munson SM, Field JP. 2011. Aeolian and fluvial processes in dryland regions: the need for integrated studies. Ecohydrology. 4(5):615–622.
- Bullard JE. 1997. Vegetation and dryland geomorphology. In: Thomas DSG, editor. Arid zone geomorphology: process, form and change in drylands. Chichester: Wiley; p. 109–131.
- Bullard JE, Livingstone I. 2002. Interactions between aeolian and fluvial systems in dryland environments. Area. 34(1):8–16.
- Bullard JE, Nash DJ. 1998. Linear dune pattern variability in the vicinity of dry valleys in the Southwest Kalahari. Geomorphology. 23(1):35–54.
- Clarke ML, Rendell HM. 1998. Climate change impacts on sand supply and the formation of desert sand dunes in the south-west U.S.A. J Arid Environ. 39(3):517–531.
- Courrech du Pont S, Narteau C, Gao X. 2014. Two modes for dune orientation. Geology. 42(9):743–746.
- Deng MJ, Yang PN, Zhou HY, Xu HL. 2017. Water conversion and strategy of ecological water conveyance in the lower reaches of the Tarim River. Arid Zone Res. 34(4):717–726. Chinese with English Abstract.
- Field JP, Breshears DD, Whicker JJ. 2009. Toward a more holistic perspective of soil erosion: why aeolian research needs to explicitly consider fluvial processes and interactions. Aeolian Res. 1(1–2):9–17.
- Folk RL, Ward WC. 1957. Brazos River bar, a study in the significance of grain size parameter. J Sediment Res. 27(1):3–26.
- Füchtbauer H, Müller G. 1970. Sediment and sedimentology. New york: J. wiley and Sons; p. 792.
- Hesp PA, Smyth TAG. 2017. Nebkha flow dynamics and shadow dune formation. Geomorphology. 282:27–38.
- Hollands CB, Nanson GC, Jones BG, Bristow CS, Price DM, Pietsch TJ. 2006. Aeolian–fluvial interaction: evidence for late quaternary channel change and wind-rift linear dune formation in the northwestern Simpson Desert, Australia. Quat Sci Rev. 25(1–2):142–162.
- Jiapaer G, Chen X, Bao A. 2011. A comparison of methods for estimating fractional vegetation cover in arid regions. Agr Forest Meteorol. 151(12):1698–1710.
- Jones LS, Blakey RC. 1997. Eolian-fluvial interaction in the page sandstone (Middle Jurassic) in south-central Utah, USA – a case study of erg-margin processes. Sediment Geol. 109(1–2):181–198.
- Kocurek G. 1998. Aeolian system response to external forcing factors – a sequence stratigraphic view of the Saharan region. In: Alsharhan AS, Glennie KW, Whittle GL, Kendall CGStC, editors. Quaternary deserts and climatic change. Rotterdam: Balkema; p. 327–337.
- Lancaster N. 1988. Development of linear dunes in the southwestern Kalahari, southern Africa. J Arid Environ. 14:233–244.
- Lancaster N. 2002. How dry was dry? – Late Pleistocene palaeoclimates in the Namib Desert. Quat Sci Rev. 21(7):769–782.
- Lancaster N, Baas A. 1998. Influence of vegetation cover on sand transport by wind: field studies at Owens Lake, California. Earth Surf Process Landforms. 23(1):69–82.
- Langford RP. 1989. Fluvial–aeolian interactions: part I. Modern systems. Sedimentology. 36(6):1023–1035.
- Liu B, Coulthard TJ. 2015. Mapping the interactions between rivers and sand dunes: implications for fluvial and aeolian geomorphology. Geomorphology. 231:246–257.
- Liu B, Coulthard TJ. 2017. Modelling the interaction of aeolian and fluvial processes with a combined cellular model of sand dunes and river systems. Comput Geosci. 106:1–9.
- Lucas A, Narteau C, Rodriguez S, Rozier O, Callot Y, Garcia A, Courrech du Pont S. 2015. Sediment flux from the morphodynamics of elongating linear dunes. Geology. 43(11):1027–1030.
- Maroulis JC, Nanson GC, Price DM, Pietsch T. 2007. Aeolian–fluvial interaction and climate change: source-bordering dune development over the past ∼100 ka on Cooper Creek, central Australia. Quat Sci Rev. 26(3–4):386–404.
- McTainsh GH, Bullard JE. 2003. Aeolian-fluvial interactions in dryland environments: examples, concepts and Australia case study. Prog Phys Geogr. 27(4):471–501.
- Muhs DR, Reynolds RL, Been J, Skipp G. 2003. Eolian sand transport pathways in the southwestern United States: importance of the Colorado River and local sources. Quat Int. 104(1):3–18.
- Parteli EJ, Durán O, Tsoar H, Schwämmle V, Herrmann HJ. 2009. Dune formation under bimodal winds. Proc Natl Acad Sci USA. 106(52):22085–22089.
- Pye K, Tsoar H. 1990. Aeolian sand and sand dunes. London: Unwin Hyman; 458 pp.
- Rubin DM, Hunter RE. 1987. Bedform alignment in directionally varying flows. Science. 237(4812):276–278.
- Smith ND, Smith DG. 1984. William river: an outstanding example of channel widening and braiding caused by bed-load addition. Geology. 12(2):78–82.
- Sweet ML, Nielson J, Havholm K, Farrelley J. 1988. Algodones dune field of southeastern California: case history of a migrating modern dune field. Sedimentology. 35(6):939–952.
- Ta W, Wang H, Jia X. 2015. The contribution of aeolian processes to fluvial sediment yield from a desert watershed in the Ordos Plateau, China. Hydrol Process. 29(1):80–89.
- Teller JT, Lancaster N. 1986. Lacustrine sediments at Narabeb in the central Namib Desert, Namibia. Palaeogeogr Palaeoclim Palaeoecol. 56(3–4):177–195.
- Udden JA. 1914. Mechanical composition of clastic sediments. Bull Geol Soc Am. 25(1):655–744.
- Visher GS. 1969. Grain size distributions and depositional processes. J Sediment Res. 39(3):1074–1106.
- Wentworth CK. 1922. A scale of grade and class terms for clastic sediments. J Geol. 30(5):377–392.
- Wentworth CK. 1935. The terminology of coarse sediments. Natl Res Council Bull. 98:225–246.
- Yan P, Li XM, Ma YF, Wei W, Yao Q. 2015. Morphological characteristics of interactions between deserts and rivers in northern China. Aeolian Res. 19:225–233.
- Zhu BQ, Yu JJ, Rioual P, Ren XZ. 2014. Particle size variation of aeolian dune deposits in the lower reaches of the Heihe River Basin, China. Sediment Geol. 301:54–69.