
 ?Mathematical formulae have been encoded as MathML and are displayed in this HTML version using MathJax in order to improve their display. Uncheck the box to turn MathJax off. This feature requires Javascript. Click on a formula to zoom.
Abstract
The surface subsidence in Nanjing has become increasingly apparent because of the influence of geological conditions and the rapid progress of urbanization. Here, the theory of synthetic aperture radar interferometry is analysed, and a method based on the short baseline subset (SBAS) technology is proposed. The method can overcome time and baseline decorrelation and other factors, and it can extract points with high coherence from interferograms have short spatio-temporal baselines when the atmospheric delay phase and the noise phase in the frequency domain are used to differentiate the corresponding characteristics. The slow deformation ratio of the monitoring area over long periods can also be calculated by this method. In this study, the 16 advanced land observing satellite (ALOS) data acquired from 2007 to 2011 in Nanjing are processed by the SBAS technology and compared with levelling result. This work emphasizes that the SBAS technology could derive the cumulative deformations of surfaces and deformation fields accurately.
1. Introduction
Surface deformation monitoring is an important foundation in the analyses of surface deformation and corresponding countermeasures. In the context of scientific and technological advancements, surface deformation monitoring has initially adopted optical levelling measurements, followed gradually by GPS technology and finally by the synthetic aperture radar interferometry (InSAR) method, the main option at present, which then have led to significant improvements in monitoring scope and results, etc.
The InSAR technology comprehensively and successfully integrates the synthetic aperture radar imaging principle into the interferometry measurement technology. This scheme uses the system parameters of sensors, attitude parameters and the geometric relationship among orbitals, among others, to accurately measure the small changes in three-dimensional (3D) space at certain points on earth.
The differential interferometry (DInSAR) method has the advantages of large coverage, low cost and high resolution, and it can be continuously operated on a daily basis. However, the conventional DInSAR is seriously affected by the spatiotemporal decoherence and atmospheric delay phase, which greatly limits its application in surface deformation monitoring (Antonova et al. Citation2018) as in the case of long and slow surface deformation monitoring (Zhou et al. Citation2017).
The SBAS technology can effectively solve the problem of excessive coherence of space-time baseline in DInSAR and reduce the dependence of images on baseline data (Mora et al. Citation2002). Moreover, this method can inherit the advantages of the conventional DInSAR method. For instance, the law of slow development of time deformation can improve the time resolution of deformation monitoring. The SBAS technology utilizes the coherence information of the short space–time baseline image and effectively suppresses the impact of phase noise on topographic phase. Consequently, the law of the long slow surface deformation evolution can be obtained (Ferretti et al. Citation2007). This article discusses the technique of urban settlement monitoring, in which Nanjing is used as the example.
2. Study area and data
The SAR amplitude image of study area is located at the southwest of Jiangsu Province in China, which include the downtown areas of Nanjing, Bagua Islet, Jiangjun Mountain, Laoshan Forest Park and Xianlin (). The trial stretch nearly covers the whole city of Nanjing. The city and the districts are as both shown in . The PALSAR 16 track data for the advanced land observing satellite (ALOS) satellite was acquired from 2007 to 2011. The monitoring coverage of the area vegetation is large and the terrain, including mountains, floodplains of the Yangtze River and other water bodies, is complex. Moreover, the small data acquisition density and the large time span can easily affect atmospheric characteristics. The details of the laboratory data are shown in .
Figure 1. SAR amplitude image for testing.
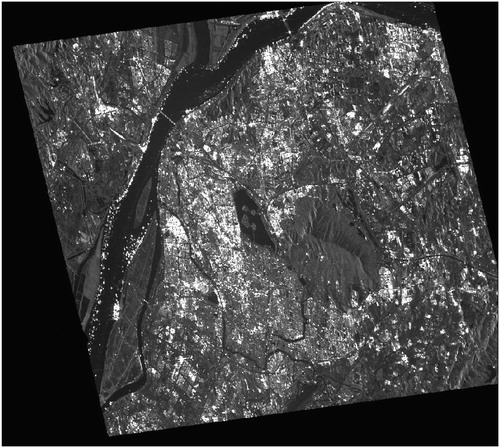
Figure 2. Google earth image for testing.
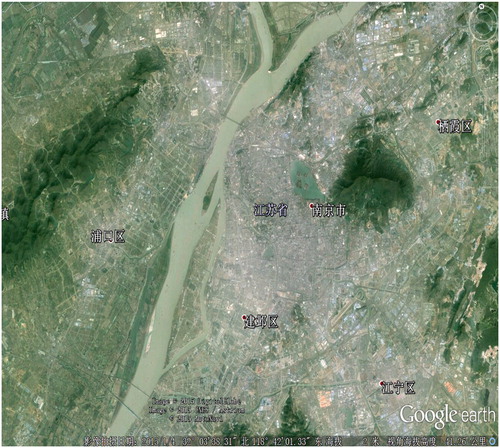
Table 1. Parameters for the acquired ALOS SAR images.
3. Methodological approach
The SBAS technology inherits the advantages of the conventional DInSAR, in which the image of the short time and space baseline is used to improve the coherence of the interferogram. In this paper, we discuss the method of surface subsidence monitoring based on SBAS (Min and Xiufeng Citation2005; Strozzi et al. Citation2005).
3.1. Information value
The study assumes that the N + 1 SAR image map for the same area can be obtained at the time between t0 to tN, and all the SAR images have the same coordinate system on the basis of image registration. The multiparallax interference pairs denoted by M is also assumed to be less than a certain threshold. M meets the following conditions:
(1)
(1)
Suppose that the SAR images obtained from to
can produce the J interferograms. Furthermore, suppose that
>
. After the topographic phase is removed, the simplified model of the atmospheric phase can be established even if the terrain and noise errors are neglected. The interferometric phase in the image can be expressed as
(2)
(2)
where
is the phase value calculated form SAR data;
is the radar wavelength;
is the distance of the surface deformation along the line of sight (LOS) direction at
relative to the original time; and
corresponds to
, such that
is equal to 0. Suppose that
is the phase that can be obtained after all interferograms have been registered. Then, the same unwrapped starting point (i.e. the stable point or the known deformation) should be selected. This method is used to individually analyze all of the time-series pixels of the interference graph. The subsequent discussions provide an example of using a single pixel.
This study assumes that the main image sequential sets and the secondary sets
meet
(3)
(3)
The differential phase of all interferograms can be calculated from the observation equation
(4)
(4)
For all interference diagrams, the linear model in the formula can be represented in the matrix form , where A denotes the dimensional matrix of
. According to the singular value decomposition (SVD) principle, when
, and the matrix rank is N, the least square could be calculated to obtain the estimate of
.
(5)
(5)
Interference pairs are usually divided into groups to reduce the impact of the baseline. When M is less than N, the coefficient matrix ranking of the corresponding equation is lost. Subsequently, singular value decomposition can be performed (Béjar-Pizarro et al. Citation2016; Cumming et al. Citation1992; Du et al. Citation2016).
3.2. Deformation monitoring approach
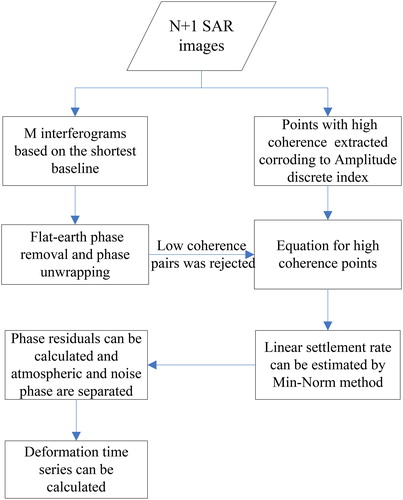
A short baseline (usually shorter than 200 m) is often used to reduce the impact of geometric coherence on the interference patterns. Furthermore, the sensitivity to the DEM error can be reduced when the elevation ambiguity is high. In this case, the cumulative difference interference pattern, which can measure crustal deformation, and the permanent scattering coherence technique can be used. The combined multi-view interference pattern averages can neglect the atmospheric effect, but it may lead to uncertain results. The method is also complex to use, although it offers the advantage of measurable nonlinear deformation. The data processing flow of the SBAS method is shown in .
Figure 3. Work flow of the SBAS technology.
3.3. Spatio-temporal baseline analysis
After the space and time baselines of the SAR image are analyzed and compared, the image acquired on 23 August 2009 is used as the master image for coordination and interference. Subsequently, the remaining data and the image’s vertical baseline data are both used for reference. The shortest vertical baseline is 328.96 m, whilst the longest vertical baseline is 2982.11 m. The baseline is long and the time span is nearly five years. According to principle of SBAS technology, a constraint is needed for the space and time base to differentiate the interference pairs. Consequently, 94 group interventions are generated. The combined results are shown in . To fully consider the phase change information in the sequence, we perform the 3D unwrapping method, which integrates temporal dimension, prior the implementation of space–time 3D unwrapping. The Delaunay 3D connection diagram for the SAR image is shown in .
Figure 4. Temporal and spatial distribution diagram.
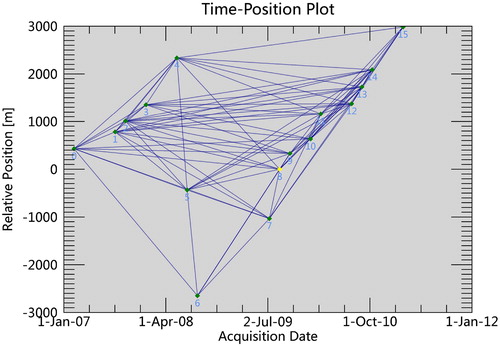
Figure 5. Delaunay 3D connection diagram.
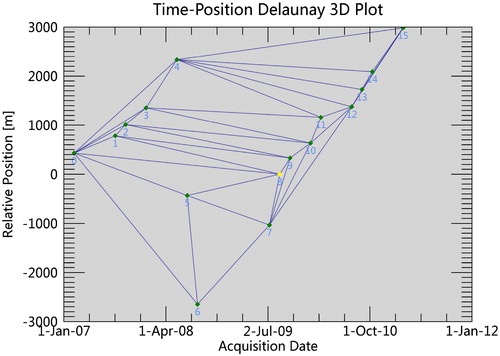
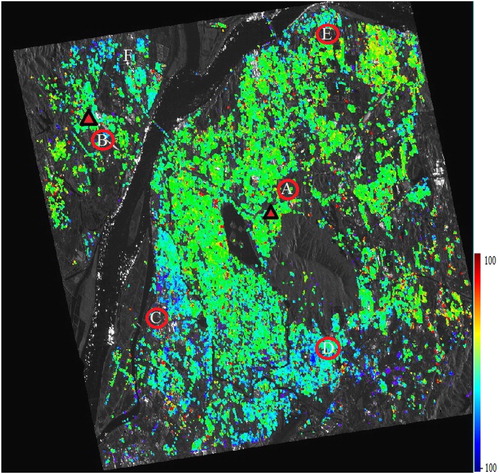
Considering the large data characteristics of the space and time base, the centralized data of the maximum space baseline interference and the maximum time baseline interference (i.e. see and , respectively) are used for coherence analysis. The distribution of the coherent pixels covers Nanjing City and is highly coherent in the two limiting cases. However, the water and the mountainous areas of the vegetation are less coherent than the requirements of the high coherence point. In the process of data processing, to curb the effects of phase noise and atmospheric phase, we choose the coherence threshold of 0.35, which is less than the coherence point of the value and is not adopted. The reference DEM used here is SRTM3, which is better than 16 m and satisfies the requirement of topographic phase removal. The disentangled reference points are chosen based on the following principles: (1) high coherence and invisible change points or known deformation points and (2) distance from the deformation zone. The SAR data covers the area of Jiangbei. Thus, to avoid the error caused by the crossing river, two reference points are selected: the geological stability point near Mount Zijin and the geological stability points near the old mountain (Areas A and B in , respectively). After processing and interference registration, which are related to the ground effect and inspection solution, we found that the severe terrain error and the phase error time coherence can lead to phase error. These aspects affect the accuracy of linear deformation extraction. The errors need to be removed from the results. After screening, a more accurate result with 78 intervention pairs is obtained. These pairs are used for atmospheric separation and post-stage inversion. shows the velocity field of Nanjing City and its surrounding area (Chang and Curlander Citation1989; Bozzano et al. Citation2010; Solari et al. Citation2016).
Figure 6. Coherence with the maximum spatial baseline.
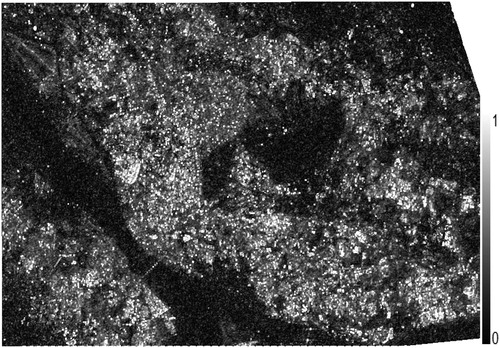
Figure 7. Coherence with the maximum temporal baseline.
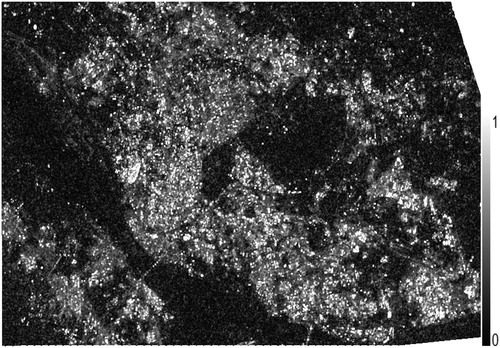
Figure 8. Settlement rate map in LOS for testing (mm/year).
4. Results and analysis
According to the deformation velocity in the graph, the four distinct subsidence areas with red circle in are as follows: west of Qinhuai River (hereafter referred as Hexi) (Area C), near Nanjing University of Science and Technology (Area D), the second bridge of Yangtze River at the south of Nanjing (Area E) and near the Nanjing High-tech Industry Development Zone (Area F). The accuracy of the studied area monitored for surface subsidence by using SBAS technology is verified by comparing and analyzing the temporal settlement data of the ground monitoring points from 2007 to 2009 of Hexi District (). We select the west of Jiqing Gate, the riverside of Binjiang and Hui Xian Ju in Gulou as the monitoring stations for cumulative settlement comparison.
Figure 9. Cumulative subsided curves of the surveying and interferometric results. (a) Monitoring site in Ji Qing Gate. (b) Monitoring site in Bin Jiang Scenic Belt. (c) Monitoring site in Hui Xian Ju.
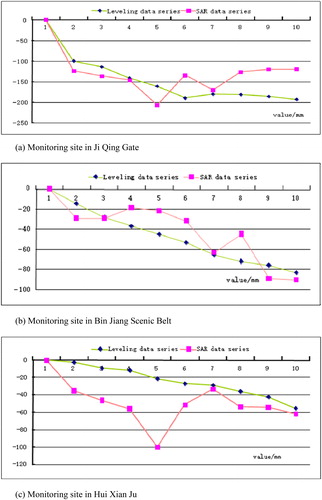
As shown by the sequence diagram, the ground monitoring results of the three monitoring sites essentially accords with the SAR cumulative settlement sequence. The monitoring time is not aligned with the observation time of the acquired SAR data. Thus, the ground level data are interpolated. The interpolation errors may be due to the selected reference points. Moreover, the errors related to residual atmospheric phase noise and the cumulative sedimentation of the SAR data are not consistent with those of the ground monitoring data. However, the time sequence contrast derived by SBAS can accurately obtain the settlement tendencies of the test area (Prati and Rocca Citation1990; Massonnet and Adragna Citation1993; Brunner et al. Citation2003; Casagli et al. Citation2010).
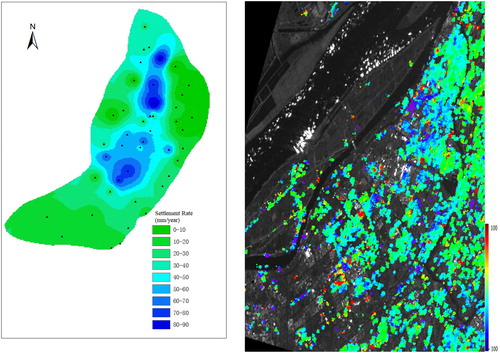
After the monitoring stations are compared and verified, we generate the map of the surface subsidence trend for Hexi by conducting a space interpolation of all ground monitoring data. Then, the map is compared with the surface subsidence velocity field of the SAR.
5. Discussion
The settlement area of Hexi has notable characteristics, such as the belt distribution from north to south (). A significant settlement trend is also observed from the Longjiang River to the Jiqing Gate. Therefore, the ground monitoring result is the same as the subsidence trend obtained by the SAR. However, more details on the sedimentation can be derived because of the rich information of SAR. Moreover, because of the sparse ground monitoring points, the distribution diagram obtained by the interpolation will have more isolated areas, which does not align with the actual situation.
Figure 10. Settlement rate map of the surveying and interferometric results. (a) Levelling results of area C (mm/year). (b) Interferometric results of area C (mm/year).
Highly precise levelling measurements should be used for the ground deformation, and the results obtained should be high and the stability of the measured data should be good (Curlander and McDonough Citation1991). Therefore, five monitoring points are selected for Area C to verify the accuracy of the SBAS monitoring results, and the levelling results are compared with the SBAS monitoring results (, ). The InSAR data and the measured values are not from the same period, which may cause different results. However, as shown by the chart, the SBAS monitoring value is in good agreement with the levelling value, and the precision can reach the millimetre level (Qiu et al. Citation2010; Brunori et al. Citation2015). If the levelling value is taken as the true value, then the monitoring precision of the SBAS can fully meet the requirements of ground subsidence monitoring.
Figure 11. Interferometric and surveying results.
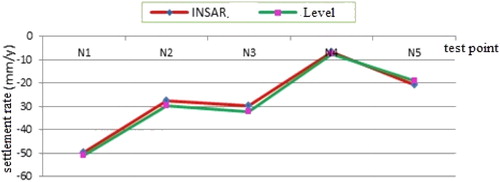
Table 2. Interferometric and surveying values and corresponding errors.
Combined with the findings on regional geological structure, we can derive from the results that land subsidence is mainly caused by the following reasons (Strozzi et al. Citation2005; Huang et al. Citation2016):
Areas C and E mainly cover the floodplains of Yangtze River where the soft soil layer is relatively thicker and the consolidation settlement is still in progress. These areas also have relatively smaller foundation bearing capacity. In Area C, city development is complemented by the rapid increase of ground buildings, and the influence of ground load (including underground space) is depicted by large settlement deformations. Meanwhile, Area E includes the new port of Nanjing where several cargo ships conduct loading and unloading. In this area, the Yangtze River has become vulnerable to water level changes (Zhang and Xue Citation2013).
The rapid urban construction and the extraction of groundwater during construction loading and actual construction in Areas D and F manifest as unevenly deformed foundations. In Area F, which is located near the mountains, the geological structure is supposed to be stable. However, the foundation appears to be subsiding, and this phenomenon is likely related to the excavations in the area.
As shown by the sedimentation rate profile, the two bridges in Nanjing have low coherence, which suggests obvious subsidence. The monitoring of relevant units should therefore be strengthened to avoid safety concerns.
6. Conclusion
A surface subsidence analysis of Nanjing is performed with the SBAS technology. The ground monitoring data are compared and verified to obtain the accurate sedimentation rate profile and the sequential settlement accumulation of the area. The experimental results show that the SBAS technology can cover large surface fields with high densities, overcome the influence of the SAR baseline and temporal decoherence and effectively extract deformation information. In general, the SBAS technology is ideal for detecting surface subsidence monitoring, and it can obtain large-area, and high-space-density surface deformation fields in a short time at a low cost and without the need for ground control points. However, due to limitations of technical theory, monitoring accuracy could still be improved in the future research.
Acknowledgements
The authors thank Prof. Jianping Yue (Hohai University, Nanjing) for providing the ALOS dataset of Nanjing.
Disclosure statement
No potential conflict of interest was reported by the authors.
Additional information
Funding
References
- Antonova S, Sudhaus H, Strozzi T, Zwieback S, Kääb A, Heim B, Langer M, Bornemann N, Boike J. 2018. Thaw subsidence of a Yedoma landscape in northern Siberia, measured in situ and estimated from TerraSAR-X interferometry. Remote Sens. 10(4):494.
- Béjar-Pizarro M, Guardiola-Albert C, García-Cárdenas R, Herrera G, Barra A, López Molina A, Tessitore S, Staller A, Ortega-Becerril J, García-García R, et al. 2016. Interpolation of GPS and geological data using InSAR deformation maps: method and application to land subsidence in the Alto Guadalentín aquifer (SE Spain). Remote Sens. 8(11):965.
- Bozzano F, Mazzanti P, Prestininzi A, Mugnozza GS. 2010. Research and development of advanced technologies for landslide hazard analysis in Italy. Landslides. 7(3):381–385.
- Brunner FK, Zobl F, Gassner G. 2003. On the capability of GPS for landslide monitoring. Felsbau. 21:51–54.
- Brunori CA, Bignami C, Albano M, Zucca F, Samsonov S, Groppelli G, Norini G, Saroli M, Stramondo S. 2015. Land subsidence, ground fissures and buried faults: InSAR monitoring of Ciudad Guzmán (Jalisco, Mexico). Remote Sens. 7(7):8610–8630.
- Casagli N, Catani F, Del Ventisette C, Luzi G. 2010. Monitoring, prediction, and early warning using ground-based radar interferometry. Landslides. 7(3):291–301.
- Chang CY, Curlander JC. 1989. Doppler centroid ambiguity estimation for synthetic aperture radars. Proceedings of the International Geoscience and Remote Sensing Symposium, IGARSS’89; July 10–14. Canada: IEEE Xplore. pp. 2567–2571.
- Cumming I, Wong F, Raney K. 1992. A SAR processing algorithm with no interpolation. Geoscience and Remote Sensing Symposium,IGARSS '92. International; May 26–29. Houston: IEEE Xplore. pp. 376–379.
- Curlander JC, McDonough RN. 1991. Synthetic aperture radar systems and signal processing. New York (NY): Wiley-Interscience.
- Du Z, Ge L, Li X, Ng A. 2016. Subsidence monitoring over the Southern Coalfield, Australia using both L-band and C-band SAR time series analysis. Remote Sens. 8(7):543.
- Ferretti A, Monti-Guarnieri A, Prati C, Rocca F. 2007. InSAR principles: guidelines for SAR interferometry processing and interpretation. Noordwijk: ESA Publicatons.
- Huang J, Khan SD, Ghulam A, Crupa W, Abir IA, Khan AS, Kakar DM, Kasi A, Kakar N. 2016. Study of subsidence and earthquake swarms in the Western Pakistan. Remote Sens. 8(11):956.
- Massonnet D, Adragna F. 1993. A full-scale validation of radar interferometry with ERS-1: the Landers earthquake. Earth Observ Q. 41:1–5.
- Min H, Xiufeng H. 2005. Interferometric synthetic aperture radar and its application to deformation monitoring. Dam Observation and Geotechnical Tests. 2:2–15.
- Mora O, Lanari R, Mallorquí J J. et al. 2002. A new algorithm for monitoring localized deformation phenomena based on small baseline differential SAR interferograms[C]//Geoscience and Remote Sensing Symposium. IGARSS'02. 2002 IEEE International. IEEE, 2002, 2: 1237–1239.
- Prati C, Rocca F. 1990. Limits to the resolution of elevation maps from stereo SAR images. Int J Remote Sens. 11(12):2215–2235.
- Qiu Z, Zhang L, Liao M. 2010. An algorithm for spaceborne interferometric sar signal processing with coherence optimization. Geomatics Inf Sci Wuhan Univ. 35(9):1065–1068.
- Solari L, Ciampalini A, Bianchini S, Moretti S. 2016. PSInSAR analysis in urban areas: a case study in the Arno coastal plain (Italy). ROL. 41:255–258.
- Strozzi T, Farina P, Corsini A, Ambrosi C, Thüring M, Zilger J, Wiesmann A, Wegmüller U, Werner C. 2005. Survey and monitoring of landslide displacements by means of L-band satellite SAR interferometry. Landslides. 2(3):193–201.
- Zhang X, Xue X. 2013. Analysis of marine environmental problems in a rapidly urbanising coastal area using the DPSIR framework: a case study in Xiamen, China. J Environ Plann Manage. 56(5):720–742.
- Zhou L, Guo J, Hu J, Li J, Xu Y, Pan Y, Shi M. 2017. Wuhan surface subsidence analysis in 2015–2016 based on n sentinel-1A data by SBAS-InSAR. Remote Sens. 9(10):982.