
Abstract
Multiple parameters (brightness temperature, soil moisture, surface latent heat flux, surface air temperature and carbon monoxide) before and after the 2015 Nepal M7.8 Gorkha main earthquake and M7.3 Dolakha aftershock were analysed using satellite observation data. The thermal anomalies from optical and microwave data appear about two months prior to the 2015 Gorkha earthquake. Some of the parameters show anomalous changes at different altitudes about 20 days prior to the main earthquake event and 10 days prior to the strong aftershock. Our results show that pre-earthquake anomalous signals propagate from the in situ to the top of atmosphere, and the anomalies in the atmosphere often observed prior to an impending earthquake. The changes on the land surface and corresponding changes in meteorological and atmospheric parameters show existence of strong coupling during the seismogenic period, although the transfer mechanism of seismic/electromagnetic is still has to be investigated and understood.
1. Introduction
Since last three decades, analysis of geophysical, geological, hydrological, satellite and model data have shown changes in subsurface, land, meteorological and atmospheric parameters prior and after the earthquakes (Gornyi et al., Citation1988; Tronin, Citation1996; Dey and Singh, Citation2003; Ouzounov and Freund, Citation2004; Saraf and Choudhury, Citation2005; Tramutoli et al., Citation2005; Maeda and Takano, Citation2010; Singh et al., Citation2010a; Wu et al., Citation2012; Daneshvar et al., Citation2014; Ye et al., Citation2015; Cui et al., Citation2017; He et al., Citation2017; Jing et al., Citation2018; Qin et al., Citation2018). These abnormal signals occurred in lithosphere and atmosphere during the earthquake preparation process, and usually appear several months or several days prior to the earthquake event. The thermodynamic parameters used to study these anomalies include brightness temperature, outgoing longwave radiation, surface latent heat flux (SLHF), air temperature, surface temperature and the gas parameters including radon, helium, carbon monoxide (CO), methane, water vapour, and so on. The study on the independent parameters has shown correlation between each parameter and the time and space of the earthquake occurrence. The observed fact of different parameters with similar characteristics before different earthquakes all over the world, especially the anomalies usually distribute along the main tectonic zone. Such observations along the tectonic zone clearly show their relations with the build-up of stress in the epicentral region.
In recent years, efforts have been made to understand the precursory mechanism through the analysis of multi-parameters of the lithosphere, atmosphere and ionosphere of earthquake events. Synchronous or near-synchronous variations were observed associated with different parameters of lithosphere and atmosphere of 2003 Colima (M = 7.8) (Pulinets et al., Citation2006), 2004 Sumatra (M = 9.1) (Singh et al., Citation2007), 2008 Wenchuan (M = 7.8) (Singh et al., Citation2010b; Jing et al., Citation2013), 2009 L’Aquila (M = 6.3)(Wu et al., Citation2016), 2010 Haiti (M = 7.0) (Singh et al., Citation2010c), 2016 Ecuador (M = 7.8) (Akhoondzadeh et al., Citation2018) and several other earthquakes. These results have clearly demonstrated existence of coupling between lithosphere–atmosphere–ionosphere associated with the earthquake activities. The lithosphere–atmosphere–ionosphere Coupling (LAIC) (Pulinets and Ouzounov, Citation2011) and lithosphere–coversphere–atmosphere Coupling (LCAC) (Wu et al., Citation2012) explain the possible mechanism based on the anomalous variations of parameters and show existance of coupling between several parameters.
A deadly Gorkha thrust earthquake of magnitude 7.8 occurred in the central Nepal region on 25 April 2015 followed by a series of aftershocks, including a strong Dolakha aftershock with magnitude 7.3 occurred on 12 May 2015 about 140 km southeast of the main earthquake event. According to USGS, the main earthquake occurred as a result of thrust faulting on or near the main thrust environment between the subducting India plate and the overriding Eurasia plate in the north (Hayes et al., Citation2017). This earthquake was one of the worst natural disasters in Nepal since the 1934 Nepal Bihar earthquake (Hayes and Briggs, Citation2017) that destroyed thousands of buildings and over 8000 fatalities (Ahmad and Singh, Citation2016). In the present paper, the detailed analysis of multi parameters at different altitudes prior and after the main earthquake event (M = 7.8) and a major aftershock (M = 7.3) have been carried out. The results show existence of strong coupling between the land and atmospheric parameters about two weeks prior to the main earthquake event and 10 days before the strong aftershock.
2. Observation data
In this study, the lithospheric and atmospheric parameters observed by satellites were used to investigate possible anomalous variations associated with the 2015 Gorkha earthquake and Dolakha aftershock earthquake. For all the observation data (night time data) except SLHF and precipitation rate data (no night data available) were considered in order to avoid interferences due to human activities during daytime.
2.1. Microwave brightness temperature
We have considered passive microwave brightness temperature data that reflect the near subsurface thermal radiation due to its penetration. The brightness temperature data sets are derived from the Defense Meteorological Space Program (DMSP) special sensor microwave imager/sounder (SSMIS) to find out anomalous signals prior to the 2015 Gorkha earthquake. The dataset provides both vertical (V) and horizontal (H) polarizations at frequencies 19, 37, 91 and 22 GHz in vertical polarization, with global coverage of 25 km spatial resolution.
2.2. Soil moisture
Surface soil moisture is an important parameter to reflect water content in the sub-surface, which can be obtained quantitatively by different methods based on optical and thermal infrared, active and passive microwave remote sensing (Petropoulos et al., Citation2015). In the present paper, we have used daily surface soil moisture data with the spatial resolution of 25 km derived from the Advanced Microwave Scanning Radiometer 2 (AMSR2) passive microwave remote sensing data based on the Land Parameter Retrieval Model. In order to analyse whether the changes in soil moisture associated with earthquakes, near real-time precipitation rate data observed by the Tropical Rainfall Measuring Mission (TRMM) have been considered in the present study.
2.3. Surface latent heat flux
SLHF reflects the surface energy exchange with the atmosphere caused by water phase changes. Dey and Singh (Citation2003) proposed SLHF as a potential parameter as a precursor for earthquakes occurring within coastal regions. Besides, in recent years, SLHF anomalies have been observed prior to earthquakes occurred inland (Qin et al., Citation2009; Qin et al., Citation2011; Alvan et al., Citation2013; Jing et al., Citation2013; Daneshvar et al., Citation2014). The NCEP/NCAR (National Centers for Environmental Prediction/National Center for Atmospheric Research) reanalysis project provides global SLHF dataset. The data set is divided into 94 lines by the Gaussian grid from the North Pole to the South Pole (88.542°N–88.542°S) and divided into 192 lines from 0° to 358.125°E with a regular 1.875°spacing. The accuracy of the dataset is 10-30 W/m2 (Smith et al., Citation2001).
2.4. Carbon monoxide
In some earthquakes, anomalous CO prior to earthquakes have been observed (Singh et al., Citation2010a; Cui et al., Citation2017; Jing et al., Citation2018).We have used CO data retrieveed from the Measurements of Pollution in the Troposphere (MOPITT) instrument onboard the NASA Earth Observing System (EOS) Terra satellite platform to study emissions of CO from the active fault zones associated with earthquake activities. The MOPITT satellite provides data on the vertical distribution of CO in the troposphere that detects atmospheric CO absorption at a solar band around 2.3 µm and a thermal band around 4.6 µm (Deeter et al., Citation2004). MOPITT CO gridded daily averages data product with a spatial resolution of 1.0°×1.0° were taken through NASA Giovanni portal (https://giovanni.gsfc.nasa.gov/giovanni/).
2.5 Surface air temperature
Air temperature is also one of the important atmospheric parameters in the process of earthquake preparation over the epicentral region. We have considered air temperature data from the AIRS daily L3 product having the global coverage at a spatial resolution of 1.0°×1.0°. The surface air temperature data were used in the present study.
3. Observation results
3.1. Microwave brightness temperature
We have computed the Index of Microwave Radiation Anomaly (IMRA) (Jing et al. Citation2018) using SSMIS F17 platform data . Five days average brightness temperature data were used to avoid problem with the missing data between tracks for polar orbiting satellites observation. According to USGS earthquake catalogue, the observed data in the year 2009, 2012 and 2014 were selected as background data due to the lack of strong earthquakes in Nepal. and shows the continuous passive microwave brightness temperature spacial variations at 37 GHz horizontal polarizations from the 46 to 135 Julian days of 2015 in Nepal region. The main earthquake event (Gorkha, M = 7.8) occurred on 25 April 2015 (the 115 Julian day of 2015) and a major aftershock (Dolakha, M = 7.3) occurred on 12 May (the 132 Julian day of 2015), subsequently.The enhancement in IMRA appears during 51–55 Julian days of 2015, and reaches to a maximum value of 5.74 in the northwest of the epicentre during the 56–60 Julian days (about two months prior to the Gorkha earthquake) (). The second enhancement in IMRA appears about 10 days prior to the main event (during 106–110 Julian days of 2015) until the earthquake (M = 7.8) occurred. During 131–135 Julian days, enhancement in IMRA is observed again, when a strong aftershock (magnitude 7.3) occurred ().
Figure 1. Spatial distribution of IMRA at 37 GHz horizontal polarizations during 46–90 Julian days of 2015. Red lines show fault lines, which are taken from the HimaTibetMap database (Styron et al., Citation2011).
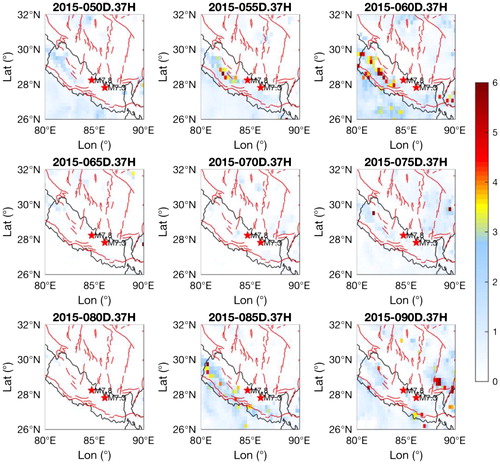
Figure 2. Spatial distribution of IMRA at 37 GHz horizontal polarizations during 91–135 Julian days of 2015.Red lines show fault lines, which are taken from the HimaTibetMap database (Styron et al., Citation2011).
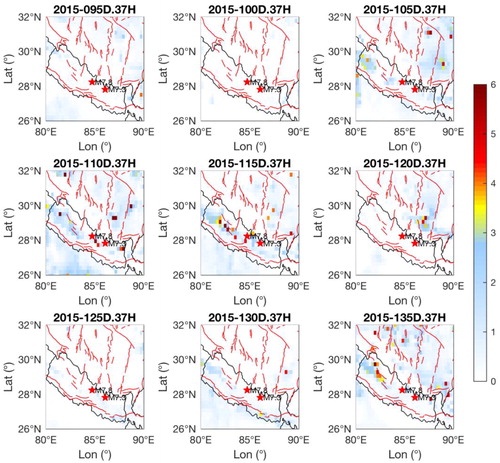
The location of IMRA enhancement appeared along the fault lines in the northwest of the epicentre, and only a small anomaly occurred near the epicentre prior to the impending earthquake.
3.2. Soil moisture
Since soil moisture is closely related to the rainfall, both data are considered. shows variations of soil moisture and precipitation rate over 1.0°×1.0° around epicentres of the main earthquake event and the strongest aftershock. The variation for 2015 and 2014 (AMSR2 data in 2009 and 2012 are unavailable) are compared to identify the possible anomalies associated with earthquakes. The two red stars show day of two earthquake events. In the two epicentral regions, almost every peak value of soil moisture corresponds to days of precipitation or before during the same periods in 2014 and 2015, except for the two peaks (red circles in and ) prior to the main earthquake (M = 7.8). shows the value of soil moisture and near real-time precipitation rate prior to the M7.8 earthquake. One can see that the soil moisture increased over both mainshock and aftershock epicentral regions on the 105 (56.04% and 58.43%) and 110 Julian days (43.05% and 44.44%) in 2015 with a very low precipitation during this period (0–0.57mm/day), which seems to be coincided with the abnormal microwave brightness temperature prior to the main earthquake event.The high soil moisture on the 103 Julian day was not an anomaly due to the high precipitation on the previous day. Not much changes in soil moisture were detected prior to the M7.3 aftershock due to the strong precipitation ()
Figure 3. Soil moisture and precipitation variations in 2014 and 2015 over epicentre and surrounding areas of the 2015 main earthquake event and strong aftershock event. (a) for the main earthquake event and (b) for the strongest aftershock event. SM: soil moisture; RF: precipitation.
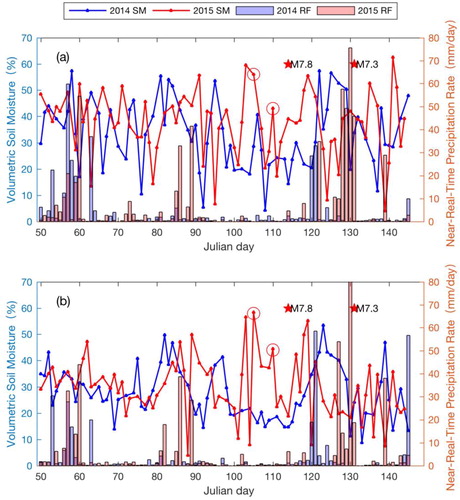
Figure 4. Spatial distribution of SLHF peaks compared to the background years during the 110–118 Julian days of 2015. Red star indicates the main earthquake event of 25 April 2015 and black star indicates aftershock event on 12 May 2015.
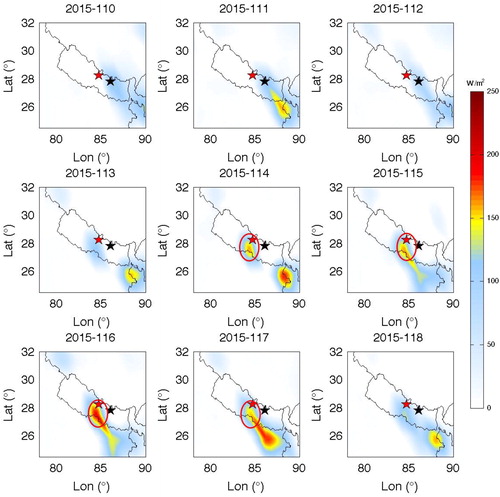
Figure 5. Spatial distribution of SLHF peaks compared to the background years during 119–127 Julian days of 2015, red and black stars are the location of main earthquake and aftershock events, respectively.
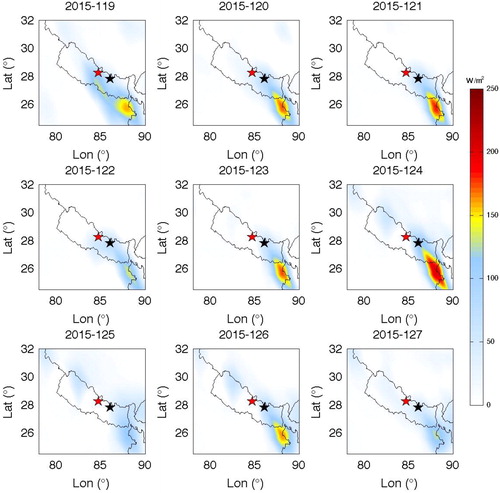
Table 1. The details of soil moisture and precipitation rate prior to the M7.8 earthquake .
3.3. Surface latent heat flux
The spatial distribution of SLHF was analysed prior and after the main earthquake event and the strongest aftershock event. We computed the average SLHF as background for the years without strong earthquakes (2009, 2012 and 2014), using the data in 2015 and after subtracting background years data. shows the high-value spatial distribution of SLHF compared to the background data. From , we have observed two times increased SLHF over the epicentral region. First, SLHF peak is observed one day prior to the Gorkha earthquake event that disappear after 4 days (red circles, ).The second peak was observed 3 days prior to the Dolakha aftershock event that disappear afterwards (red circles, ). The position of maxima peak of SLHF shows a good correspondence with the epicentres of the two earthquake events, which are all very close to an epicentre of an impending earthquake. No obvious peaks were observed over the epicentres in between the two events ().
Figure 6. Spatial distribution of SLHF peaks compared to the background years during 128–136 Julian days of 2015, red and black stars are the location of main earthquake and aftershock events, respectively.
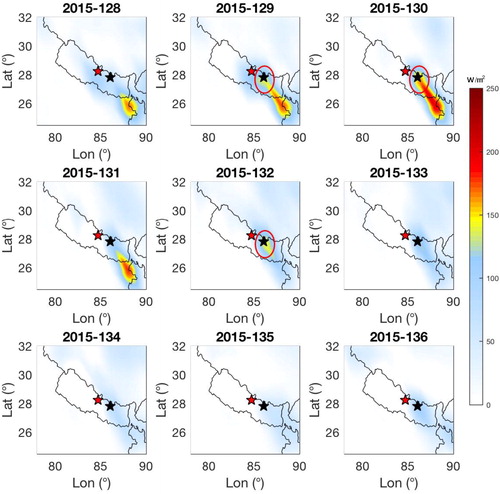
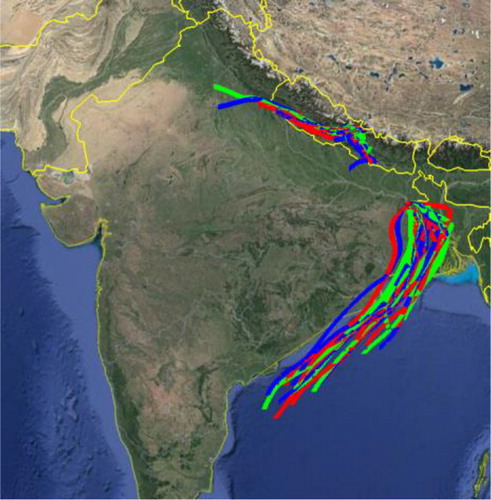
We also observed frequent peaks of SLHF in the southeast of epicentral area (). Soil mositure and total water vapour during April and May of 2015 were analysed to study the variations over this region. shows the time-averaged map during April–May 2015 for soil moisture and total column water vapour (circles, ) is the only region showing high soil moisture and high water vapour. Furthermore, we have used HYSPLIT model (Draxler and Hess, Citation1998) to study transport of air mass on 4 May 2015 (124 Julian days) to make sure about the cause of observed changes in maxima peaks. The HYSPILT back trajectory model was run for 48 h with the start of a new trajectory every 6 h, with the maximum number of trajectories 24. It is shown that all the air mass at an altitude 500 m transported from the southeast of Nepal originated from the Bay of Bengal Sea and the air mass over the epicentral region of main earthquake event came from the inland (). It is likely that the transport of airmass from the Bay of Bengal Sea may have brought air moisture that may have enhanced SLHF variations. The SLHF depends on many parameters like, surface temperature, winds, onset of monsoon, and several parameters (Singh et al., Citation2010c).
Figure 7. Time-averaged Map (April–May, 2015) of soil moisture (a) and total column water vapour (b) over the epicentral region.
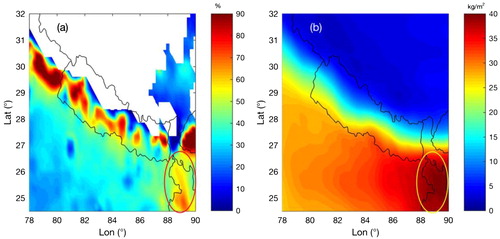
Figure 8. NOAA-HYSPLIT air mass back trajectories ending over the epicentral region of main earthquake event and the anomalous SLHF in the southeast of epicentral region of 4 May 2015 at an altitude of 500 m. Source: Google
3.4. Carbon monoxide
Singh et al. (Citation2010a) observed a sudden enhancement in CO concentrations at the higher pressure level comparing the stable variations at other lower pressure levels prior to the Gujarat Earthquake of 26 January 2001. Here, we show CO mixing ratio at different pressure levels (). Some data are missing at the pressure level 900 hPa compared to other lower pressure levels may be due to the day to variability of bounadry layer height which is of course have good correspondance with the atmospheric pressure. Only the data provided through NASA Giovanni portal at each pressure levels have been considered in order to reduce the impact of missing data for sake of comparison. Here, our purpose to study qualitatative changes, not for quantitative estimate of observed changes. The CO concentration close to the surface at the pressure level 900 hPa over the epicentral region of the main 2015 Gorkha earthquake and the strong aftershock event (Dolakha earthquake) show similar changes prior to these two events (red circles in ). We found that CO mixing ratio at different levels follow synchronous variations except on the Julian days 99, 113 and 122 (corresponding to 9 and 23 April, l and 2 May 2015, respectively) at a pressure level 900 hPa, CO was found to be more stable at other lower pressure levels. The enhacement in CO mixing ratio appears within two weeks prior to the two events. Details of CO variations for three days are given in . that clearly show a postive change at 900 hPa while at other pressure levels show negative change.We observed that the CO shows similar variations after the strong aftershock Dolakha event, that could be attributed to the frequent occurrence of strong aftershocks.
Figure 9. Time series of CO variations during 50–180 Julian days. The arrows show the day of main earthquake event and the day of the Dolakha aftershock event.
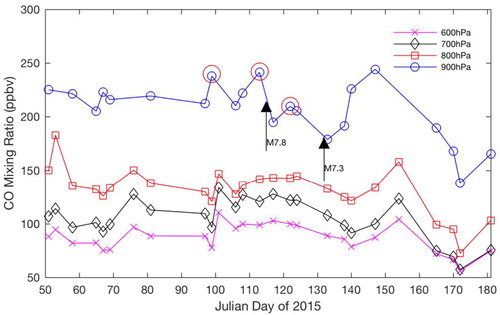
Table 2. CO variations at different pressure levels prior to the Nepal Gorkha earthquake and Dolakha aftershock event.
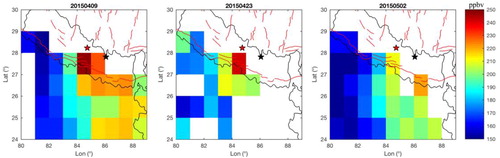
The spatial distribution of CO mixing ratio on the three days show the maximum value in the whole region close to the epicentres, respectively, and also show higher concentrations along the Himalayan tectonic zone ().
Figure 10. Spatial distribution of CO mixing ratio at the pressure level close to the surface at the pressure level 900 hPa prior to the main Nepal Gorkha earthquake (red star) and Dolakha aftershock event (black star) in the year 2015. Distribution of active faults are shown with red colour, which are taken from the HimaTibetMap database (Styron et al., Citation2011).
3.5. Surface air temperature
Surface air temperature data observed by AIRS satellite () show variations of surface air temperature over the epicentral and surrounding areas of the main earthquake and aftershock events. Four peaks in air temperature are seen during 50–145 Julian days of 2015 over the epicentral area (red circles, ). The earliest air temperature shows on 61 Julian days of 2015, one day after the first stage of the IMRA anomalies prior to the Gorkha earthquake with maximum value 4.40 K higher than the threshold line with the sum of the mean value and two times the standard deviation during this period. Afterwards, two peaks appeared on Julian days 98 and 114, respectively, one peak appears again 2 days prior to the strong aftershock event (Dolakha M7.3 earthquake).
Figure 11. Variations of surface air temperature during 50–145 Julian days of 2015 over the epicentral area. The dashed lines show a threshold value of μ + 1.5σ and μ + 2.0σ, μ is the mean value of surface air temperature during this period and σ is standard deviation.
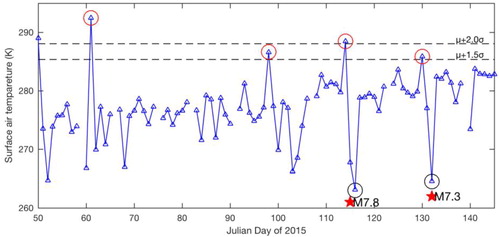
It should be noted that the minimum value of surface air temperature was observed one day after the main earthquake event (M = 7.8) and the day of the strong aftershock event (black circle, in ), which is found to be consistent with the ground observations over 100 years ago (Milne, Citation1886), this could be associated with the sudden release of stress after the earthquakes in the region.
4. Discussion
Anomalous changes in atmospheric and meteorological parameters have been observed by many since long time (Dey and Singh, Citation2003; Okada et al., Citation2004; Ganguly, Citation2009; Qin et al., Citation2011; Qin et al., Citation2014; Akhoondzadeh, Citation2015) prior to strong earthquakes and these parameters are considered as potential precursors of an impending earthquake. However, many studies argue that the changes in these parameters are not related to earthquake activities, since strong anomalies also appear in the absence of earthquakes (Blackett et al., Citation2011; Efstathiou, Citation2012; Zhang et al., Citation2013). Such observed anomalies could be related to atmospheric disturbances caused by cyclone/hurricanes/typhoons and also could be associated by monsoon season (Varotsos et al., Citation2017).
In fact, the changes in various parameters and also in the atmosphere are complex, and the process of earthquake preparation is also complex and highly debatable, since not much changes are observed in the epicentre and surrounding regions. Study based on one single parameter for an early earthquake warning is always doubtful, although it is believed that seismic activity can cause disturbances in the atmosphere and beyond (ionosphere)(Dunajecka and Pulinets, Citation2005; Pulinets and Dunajecka, Citation2007; Daneshvar et al., Citation2014; Mahmood et al., Citation2017). Therefore an integrated approach combining land, atmosphere, meteorological and ionospheric parameters is recommended for a relaible information about an impending earthquake (Singh et al., Citation2010c).
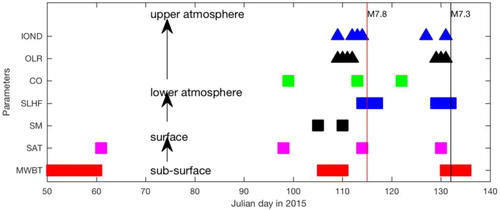
In the present study, we have utilized multiple parameters observed by different satellites and have studied thermal and atmospheric variations from the subsuface to the lower atmosphere associated with the Gorkha main earthquake event and Dolakha aftershock event in 2015. The temporal information for anomalous parameters at different height are shown in . The OLR (outgoing longwave radiation) and IOND (ionospheric disturbances) observed by many (Maurya et al., Citation2016; Gupta and Upadhayaya, Citation2017; Chakraborty et al., Citation2018). It is clearly observed that there are two obvious abnormal conditions, (i) thermal variations of subsurface two months prior to the main earthquake event. Passive microwave brightness temperature increased along the fault zone on the northwestern side of the epicentral region of an impending earthquake. The location of microwave brightness temperature anomalies coincide with the maximum principal compressive strain rate zone located in the northwest of the epicentre with about 500 km computed based on GPS observation by Su et al. (Citation2015). The microwave brightness temperature is the signals provide an early warning signal prior to the main earthquake event among all parameters we considered in the present study. Considering that microwave brightness temperature reflects the thermal variations near the surface due to its physical properties, it is reasonable that the microwave thermal anomaly caused by the enhancement of tectonic stress earlier compared to other parameters in the atmosphere. Only one day after, the surface air temperature over the epicentral region enhanced. (ii) The changes in multi-parameter at the different altitudes (from the subsurface to the atmosphere) appear about 20 days prior to the main earthquake event. The multiple parameters related to subsurface, lower and upper atmosphere (or ionosphere) show near-synchronous anomalous changes within about two weeks prior to the earthquakes. During this phase, the underground geochemical gas (such as CO) emits along fault cracks under the stress concentration, which may lead to air heating over the seismogenic zone. Few days prior to the impending earthquake, thermal anomalies observed associated with the enhanced tectonic activities. The upwelling of underground fluids increases the soil moisture (Wu et al., Citation2016), which can promote hydrothermal exchange as the temperature increases that may enhance latent heat flux. Meanwhile, the lower atmospheric disturbance over the seismogenic zone will propagate upward into the ionosphere through different ways (chemical, acoustic or electromagnetic) causing ionospheric disturbances (Hayakawa and Molchanov, Citation2004). Similar phenomena were also observed within 10 days prior to the largest aftershock event showing increase in brightness temperature along the fault once again that clearly reflect the enhancement in stress in the tectonically active region once again.
Figure 12. The temporal information for different anomalous parameters on the earth surface up to upper atmosphere associated with the 2015 Nepal earthquake and strong aftershock event. MWBT: microwave brightness temperature; SAT: surface air temperature; SM: soil moisture; SLHF: surface latent heat flux; CO: carbon monoxide; OLR represents outgoing longwave radiation variations (Chakraborty et al., Citation2018). IOND indicates ionospheric disturbances (Maurya et al., Citation2016, Gupta and Upadhayaya Citation2017).
5. Conclusions
The multi parameters of lithosphere and atmosphere observed by satellites related to the 2015 Nepal Gorkha earthquake (M = 7.8) and Dolakha aftershock (M = 7.3) clearly show anomalous changes, including passive microwave brightness temperature, surface air temperature, soil moisture, SLHF and CO, which reflect the thermodynamic and geochemical gas variations from the lithosphere to the atmosphere. The combined integrated observations demonstrate that quasi-synchronous variations of different parameters from subsurface to the lower atmosphere prior to the two strong earthquakes. Passive microwave brightness temperature anomaly is the earliest (two months prior to the main event) reflect the thermal variations of subsurface. Other anomalies appear within two weeks prior to the main earthquake event (M = 7.8) and 10 days prior to the strong aftershock event, which reflect variations coming from surface and lower atmosphere. The distributions of these anomalies show obvious relationship with the existing lineaments in the seismogenic area. The observed changes on land, atmosphere and meteorological parameters clearly show existing coupling between lithosphere–atmosphere–meteorological parameters associated with the Gorkha main earthquake event and aftershock event.
Acknowledgements
The authors thank two anonymous reviewers for their comments/suggestions that have helped us to improve earlier versions of the manuscript.
Additional information
Funding
Related Research Data
References
- Ahmad R, Singh RP. 2016. Attenuation relation predicted observed ground motion of Gorkha Nepal earthquake of April 25, 2015. Nat Hazards. 80(1):311–328.
- Akhoondzadeh M. 2015. Ant Colony Optimization detects anomalous aerosol variations associated with the Chile earthquake of 27 February 2010. Adv Space Res. 55(7):1754–1763.
- Akhoondzadeh M, De Santis A, Marchetti D, Piscini A, Cianchini G. 2018. Multi precursors analysis associated with the powerful Ecuador (MW = 7.8) earthquake of 16 April 2016 using Swarm satellites data in conjunction with other multi-platform satellite and ground data. Adv Space Res. 61(1):248–263.
- Alvan HV, Azad FH, Mansor S. 2013. Latent heat flux and air temperature anomalies along an active fault zone associated with recent Iran earthquakes. Adv Space Res. 52(9):1678–1687.
- Blackett M, Wooster MJ, Malamud BD. 2011. Exploring land surface temperature earthquake precursors: A focus on the Gujarat (India) earthquake of 2001. Geophys Res Lett. 38:L15303.
- Chakraborty S, Sasmal S, Chakrabarti SK, Bhattacharya A. 2018. Observational signatures of unusual outgoing longwave radiation (OLR) and atmospheric gravity waves (AGW) as precursory effects of May 2015 Nepal earthquakes. J Geodyn. 113:43–51.
- Cui Y, Ouzounov D, Hatzopoulos N, Sun K, Zou Z, Du J. 2017. Satellite observation of CH4 and CO anomalies associated with the Wenchuan MS 8.0 and Lushan MS 7.0 earthquakes in China. Chem Geol. 469:185–191.
- Daneshvar MRM, Khosravi M, Tavousi T. 2014. Seismic triggering of atmospheric variables prior to the major earthquakes in the Middle East within a 12-year time-period of 2002–2013. Nat Hazards. 74:1539–1553.
- Deeter M, Emmons L, Edwards D, Gille J, Drummond JR. 2004. Vertical resolution and information content of CO profiles retrieved by MOPITT. Geophys Res Lett. 31:L15112.
- Dey S, Singh R. 2003. Surface latent heat flux as an earthquake precursor. Nat Hazards Earth Syst Sci. 3(6):749–755.
- Draxler RR, Hess G. 1998. An overview of the HYSPLIT_4 modelling system for trajectories. Aust Meteoro Mag. 47:295–308.
- Dunajecka M, Pulinets S. 2005. Atmospheric and thermal anomalies observed around the time of strong earthquakes in México. Atmósfera. 18:235–247.
- Efstathiou MN. 2012. A case study of the association of total ozone variability with major earthquakes in Greece during 2001–2010. Remote Sens Lett. 3(3):181–190.
- Ganguly N. 2009. Variation in atmospheric ozone concentration following strong earthquakes. Int J Remote Sens. 30(2):349–356.
- Gornyi VI, Sal'Man AG, Tronin AA, Shilin BV. 1988. Outgoing infrared radiation of the earth as an indicator of seismic activity. Doklady Akademii Nauk Sssr. 301:67–69.
- Gupta S, Upadhayaya A. 2017. Preearthquake anomalous ionospheric signatures observed at low‐mid latitude Indian station, Delhi, during the year 2015 to early 2016: Preliminary results. J Geophys Res Space Physics. 122:8694–8719.
- Hayakawa M, Molchanov O. 2004. Summary report of NASDA's earthquake remote sensing frontier project. Phys Chem Earth, Parts A/B/C. 29(4–9):617–625.
- Hayes GP, Briggs RW. 2017. Introduction to the special issue on the 25 April 2015 Mw 7.8 Gorkha (Nepal) earthquake. Tectonophysics. 714:1–3.
- Hayes GP, Meyers EK, Dewey JW, Briggs RW, Earle PS, Benz HM, Smoczyk GM, Flamme HE, Barnhart WD, Gold RD. 2017. Tectonic summaries of magnitude 7 and greater earthquakes from 2000 to 2015. Reston (VA): US Geological Survey. Report No.: 2331-1258. https://pubs.er.usgs.gov/publication/ofr20161192.
- He A, Fan X, Zhao G, Liu Y, Singh RP, Hu Y. 2017. Co-seismic response of water level in the Jingle well (China) associated with the Gorkha Nepal (Mw 7.8) earthquake. Tectonophysics. 714:82–89.
- Jing F, Shen XH, Kang CL, Xiong P. 2013. Variations of multi-parameter observations in atmosphere related to earthquake. Nat Hazards Earth Syst Sci. 13:27–33.
- Jing F, Singh RP, Sun K, Shen X. 2018. Passive microwave response associated with two main earthquakes in Tibetan Plateau, China. Adv Space Res. 62(7):1675-1689.
- Maeda T, Takano T. 2010. Detection Algorithm of Earthquake-Related Rock Failures From Satellite-Borne Microwave Radiometer Data. IEEE Trans Geosci Remote Sensing. 48:1768–1776.
- Mahmood I, Iqbal MF, Shahzad MI, Qaiser S. 2017. Investigation of atmospheric anomalies associated with Kashmir and Awaran Earthquakes. J Atmos Solar-Terrestrial Phys. 154:75–85.
- Maurya AK, Venkatesham K, Tiwari P, Vijaykumar K, Singh R, Singh AK, Ramesh D. 2016. The 25 April 2015 Nepal Earthquake: Investigation of precursor in VLF subionospheric signal. J Geophys Res: Space Phys. 121:10403-10416.
- Milne J. 1886. Earthquakes and other earth movements. London: K. Paul, Trench.
- Okada Y, Mukai S, Singh R. 2004. Changes in atmospheric aerosol parameters after Gujarat earthquake of January 26, 2001. Adv Space Res. 33(3):254–258.
- Ouzounov D, Freund F. 2004. Mid-infrared emission prior to strong earthquakes analyzed by remote sensing data. Adv Space Res. 33(3):268–273.
- Petropoulos GP, Ireland G, Barrett B. 2015. Surface soil moisture retrievals from remote sensing: Current status, products & future trends. Phys ChemEarth, Parts A/B/C. 83:36–56.
- Pulinets S, Ouzounov D, Ciraolo L, Singh R, Cervone G, Leyva A, Dunajecka M, Karelin AV, Boyarchuk KA, Kotsarenko A. 2006. Thermal, atmospheric and ionospheric anomalies around the time of the Colima M7.8 earthquake of 21 January 2003. Ann Geophys. 24(3):835–849.
- Pulinets S, Dunajecka M. 2007. Specific variations of air temperature and relative humidity around the time of Michoacan earthquake M8. 1 Sept. 19, 1985 as a possible indicator of interaction between tectonic plates. Tectonophysics. 431(1–4):221–230.
- Pulinets S, Ouzounov D. 2011. Lithosphere–Atmosphere–Ionosphere Coupling (LAIC) model–an unified concept for earthquake precursors validation. J Asian Earth Sci. 41(4-5):371–382.
- Qin K, Guo G, Wu L. 2009. Surface latent heat flux anomalies preceding inland earthquakes in China. Earthq Sci. 22(5):555–562.
- Qin K, Wu L, De Santis A, Wang H. 2011. Surface latent heat flux anomalies before the M S 7.1 New Zealand earthquake 2010. Chinese Sci Bull. 56. 3273–3280.
- Qin K, Wu L, Zheng S, Bai Y, Lv X. 2014. Is there an abnormal enhancement of atmospheric aerosol before the 2008 Wenchuan earthquake?. Adv Space Res. 54(6):1029–1034.
- Qin K, Wu L, Zheng S, Ma W. 2018. Discriminating satellite IR anomalies associated with the MS 7.1 Yushu earthquake in China. Adv Space Res. 61(5):1324–1331.
- Saraf AK, Choudhury S. 2005. Cover: NOAA‐AVHRR detects thermal anomaly associated with the 26 January 2001 Bhuj earthquake, Gujarat, India. Int J Remote Sens. 26(6):1065–1073.
- Singh R, Cervone G, Kafatos M, Prasad A, Sahoo A, Sun D, Tang D, Yang R. 2007. Multi‐sensor studies of the Sumatra earthquake and tsunami of 26 December 2004. Int J Remote Sens. 28(13-14):2885–2896.
- Singh RP, Kumar JS, Zlotnicki J, Kafatos M. 2010. Satellite detection of carbon monoxide emission prior to the Gujarat earthquake of 26 January 2001. Appl Geochem. 25(4):580–585.
- Singh RP, Mehdi W, Gautam R, Senthil Kumar J, Zlotnicki J, Kafatos M. 2010. Precursory signals using satellite and ground data associated with the Wenchuan Earthquake of 12 May 2008. Int J Remote Sens. 31(13):3341–3354.
- Singh RP, Mehdi W, Sharma M. 2010c. Complementary nature of surface and atmospheric parameters associated with Haiti earthquake of 12 January 2010. Nat Hazards Earth Syst Sci. 10:1299–1305.
- Smith SR, Legler DM, Verzone KV. 2001. Quantifying uncertainties in NCEP reanalyses using high-quality research vessel observations. J Climate. 14(20):4062–4072.
- Styron RH, Taylor MH, Murphy MA. 2011. Oblique convergence, arc-parallel extension, and the role of strike-slip faulting in the High Himalaya. Geosphere. 7(2):582–596.
- Su X, Wang Z, Meng G, Xu W, Ren J. 2015. Pre-seismic strain accumulation and co-seismic deformation of the 2015 Nepal M S 8.1 earthquake observed by GPS. Chinese Sci Bull. 60(22):2115–2123.
- Tramutoli V, Cuomo V, Filizzola C, Pergola N, Pietrapertosa C. 2005. Assessing the potential of thermal infrared satellite surveys for monitoring seismically active areas: The case of Kocaell (Izmit) earthquake, August 17, 1999. Remote Sens Environ. 96(3–4):409–426.
- Tronin A. 1996. Satellite thermal survey—a new tool for the study of seismoactive regions. Int J Remote Sens. 17(8):1439–1455.
- Varotsos CA, Efstathiou MN, Cracknell AP. 2017. On the association of aerosol optical depth and total ozone fluctuations with recent earthquakes in Greece. Acta Geophys. 65(4):659–665.
- Wu L, Qin K, Liu S. 2012. GEOSS-Based Thermal Parameters Analysis for Earthquake Anomaly Recognition. Proc Ieee. 100(10):2891–2907.
- Wu L, Zheng S, De Santis A, Qin K, Di Mauro R, Liu S, Rainone ML. 2016. Geosphere coupling and hydrothermal anomalies before the 2009 Mw 6.3 L’Aquila earthquake in Italy. Nat Hazards Earth Syst Sci. 16(8):1859–1880.
- Ye Q, Singh RP, He A, Ji S, Liu C. 2015. Characteristic behavior of water radon associated with Wenchuan and Lushan earthquakes along Longmenshan fault. Radiat Meas. 76:44–53.
- Zhang W, Zhao J, Wang W, Ren H, Chen L, Yan G. 2013. A preliminary evaluation of surface latent heat flux as an earthquake precursor. Nat Hazards Earth Syst Sci. 13(10):2639–2647.