
 ?Mathematical formulae have been encoded as MathML and are displayed in this HTML version using MathJax in order to improve their display. Uncheck the box to turn MathJax off. This feature requires Javascript. Click on a formula to zoom.
Abstract
Floor water-inrush incidents in coal mines in China are major problems which pose a severe threat to the daily safety of mining operations. The traditional prediction approach used for the past 50 years is the water-inrush coefficient method (WCM), which only considers two factors and cannot be applied to deep coal mining. Coal floor water inrush is controlled by many factors. Based on data collection and fractal analysis of geological structures in the Yanzhou mining area, this study proposed a vulnerability index method by integrating two tools: the analytic hierarchy process (AHP) and geographic information systems (GIS). The proposed methods include: water inrush factor analysis, fractal analysis, establishment of thematic maps of each factor, normalization of thematic maps, threshold value determination using AHP, the vulnerability index method (VIM), and the demonstration of final prediction results. This study also analyzed 314 examples of coal floor water inrush disasters and a prediction line was determined for the WCM to develop an Integrated Prediction Method (IPM). It was found that the results from the vulnerability method and IPM were very different and the vulnerability method results were more similar to actual mining conditions.
1. Introduction
In China, especially North China, groundwater is often the preferred water source because of its reliability, affordability, and resilience to pollution. Meanwhile, the exploitation of coal is crucially important to the Chinese economy. Coal energy accounts for 61.8% of the country’s primary energy consumption in 2016, and is expected to remain at similar levels until at least 2020. Unfortunately, coal mining and groundwater resources frequently come into conflict due to the detrimental effects of coal mining on water resources and mining disasters. These impacts have been well documented around the world (ISTVAN et al. Citation1982; Jarvis and Younger Citation2000; Osenbrück et al. Citation2006; Kallioras and Ruzinski Citation2011; Chen et al. Citation2018). One primary issue is related to mine safety, as the potential inrush of groundwater at the working face during the mining of deep coal seams poses a serious threat to safe operations (Guo et al. Citation2009). China has a long history of mining disasters and officials are well aware of the dangers. However, as the Chinese economy is highly dependent on its coal resources, it has been a challenge to mitigate and manage risk while ensuring that coal production targets are maintained. In recent years, deep coal mining has emerged in China due to the exhaustion of shallow coal resources. Due to the complex and unpredictable geological conditions in deep mines, coal mining operations face tremendous challenges (Xu et al. Citation2016; Qiu et al. Citation2017; Zhang et al. Citation2017; Dai et al. Citation2018; Li Citation2018; Liu et al. Citation2018; Zhao et al. Citation2018).
In China, a water inrush forecasting method has been developed and published in the Regulation for Coal Mine Water Prevention and Control (SACMSC Citation2009). It involves the calculation of a water-inrush coefficient, Ts (MPa/m), according to the equation Ts = P/M, where P is the water pressure (MPa) acting on the aquitard between the coal face and the aquifer (the water inrush source) and M is the thickness of the aquitard in metres (m). The water-inrush coefficient method (WCM) has played an important role in disaster prevention. However, this simple two-parameter method cannot accurately characterize the mechanics of water inrush from the coal floor, especially in the process of deep coal mining, which is a scientific and engineering problem determined by multiple factors including water pressure, thickness of the effective aquiclude, aquifer water abundance, and geological structures.
Therefore, Wu et al. (2008, Citation2011, Citation2015, Citation2016) have proposed a series of systematic evaluations for coal mines to prevent water inrush incidents using an integrated approach that couples different non-linear mathematical methods for data processing and geographic information systems (GIS). Vulnerability assessments have been successfully applied worldwide, which can integrate multiple factors and assign a weight to each factor according to its importance. The vulnerability index method (VIM) has been used widely for many geological and environmental issues (Stempvoort et al. Citation1993; Rygel et al. Citation2006; Jamrah et al. Citation2008; Boughriba et al. Citation2010; Ribeiro et al. Citation2017). Previous studies have significantly improved the understanding of water inrush from the coal floor and its prediction methods. However, the analysis of geological structures typically focuses on faults and ignores the syncline and anticline. This study proposed new factors for water inrush prediction by combining a geographic information system (GIS) with the vulnerability index method as an operational platform. A hierarchy model was also constructed to determine the values and weights of multiple factors. Geological structures were treated differently in this study to predict water inrush than in previous literature, and the fractal grid method was used to quantify these structures. Water inrush cases were then analyzed to evaluate the effectiveness of the WCM. This paper demonstrated the use of fractal analysis for geological structures and the application of AHP-VIM method based on GIS in the Yanzhou coal mine area.
2. Study area and geology
The Yanzhou coal field consists of five mines operated locally by the Yankuang Group Corporation: the Yangcun, Xinglongzhuang, Baodian, Dongtan, Nantun, and Beisu coal mines (). The surface of the study area is made up of a relatively flat, quaternary alluvial plane ranging in elevation between 44 and 52 m above sea level (masl). Below the alluvium, Mesozoic and Paleozoic sedimentary formations form a shallow syncline (limb dip angles of <10°) that plunges gently towards the southeast. The Yishan fault separates these formations from the Archaean basement that outcrops in the east. Fractured, locally karstified Ordovician limestone and dolomite are exposed in the northwest and southwest areas that support the primary water-supply well fields (Qufu, Caowa, and Zouxi) (). More centrally, the carbonate aquifer system lies beneath the Mesozoic sediments that host the coal reserves ().
Figure 1. Location of the study area and exploration boreholes. (a) Geological map and location of the study area. (b) Location of exploration boreholes.
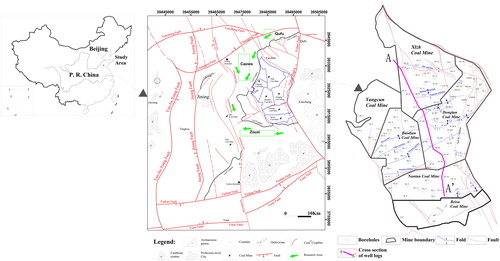
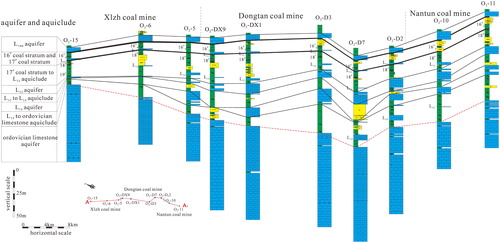
Figure 2. Prospecting holes section .
In total, the Ordovician aquifer system covers an area of 1373 km2. The karst is exposed over an area of 181 km2 and lies buried beneath the Yanzhou coal field with an area of 420 km2. Average annual precipitation is 714 mm and the mean annual air temperature is 14.4 °C.
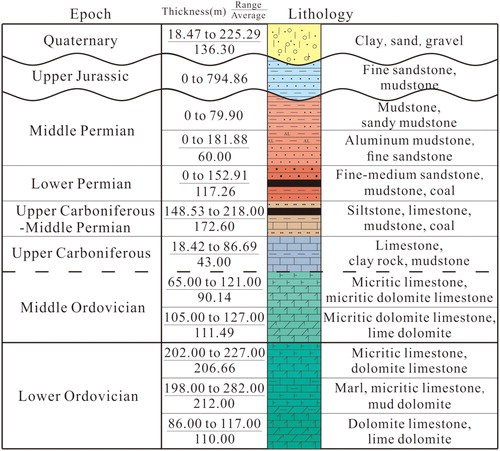
Although No. 16 deep coal has been mined from the Yancum and Nantun mines for many years, coal seam No. 3 was primarily mined from the Xinglongzhuang, Baodian, and Dongtan mines. However, the reserves of coal seam No. 3 have now been depleted and attention has turned to deeper reserves at coal seams Nos. 16 and 17. These coal seams lie much closer to high pressure zones in the underlying aquifer and are therefore the focus for water disaster prevention efforts. The full sedimentary sequence for the study area is shown in . Aquifers that could negatively influence coal mining operations in the area would normally include: the thick-bedded Ordovician karst aquifer, relatively thin Carboniferous karst aquifers, and overlying aquifers in Jurassic sandstone, Permian sandstone, and surficial Quaternary sand and gravel.
Figure 3. Stratigraphic histogram.
The aquifers in the upper strata above the Ordovician are part of a weak recharge-runoff-discharge system, except for the Quaternary gravel layer. The karst aquifer system is limited to Middle and Lower Ordovician with a total thickness of 725.2 m and seven aquifer sections according to the boreholes in the Zouxi water-supply region. The thickness of the uppermost aquifer section (the sixth) is about 100 m, which is the main water inrush source during coal mining. In the Yanzhou coal field, hydrogeological boreholes recently revealed the sixth aquifer section of Ordovician limestone. The areas surrounding the Yanzhou coal field are urban water-supply regions, such as Zouxi in the south, Caowa in the west, and Qufu in the north. Coal seams Nos. 16 and 17 from the two mines form the primary mineable coal bed; exploration in these areas is threatened by the Ordovician aquifer. Based on the lithology, thickness, water features, and burial conditions of the stratum, the main water aquifers from No. 16 to the bottom of the Ordovician limestone can be divided into two categories. The first is the Carboniferous limestone aquifer, composed of Taiyuan and Benxi limestone. The main fractured karst aquifer in this district has a stable distribution of limestone karst sub-aquifers, called L10, L11, L12, L13, and L14. Below the Carboniferous limestone aquifer is an approximately 30–80 m thick aquitard, followed by coal seams and another aquitard. The second aquifer category is the Ordovician limestone aquifer with a thickness ranging from 450 to 750 m. The sedimentary basement of the coal measure strata has a lower layer composed of thick grey limestone, with some brecciated limestone and yellow-green marl. The upper layer consists of grey or dark grey thick-bedded limestone and dolomitic limestone with some thin-bedded limestone. The karst fissure pressure of the Ordovician limestone in the Yangzhou syncline core is greater than that in the wing. The regional Ordovician karst was influenced by damaged large and thick soluble rock, and karst development originally occurred in the soluble rock layer.
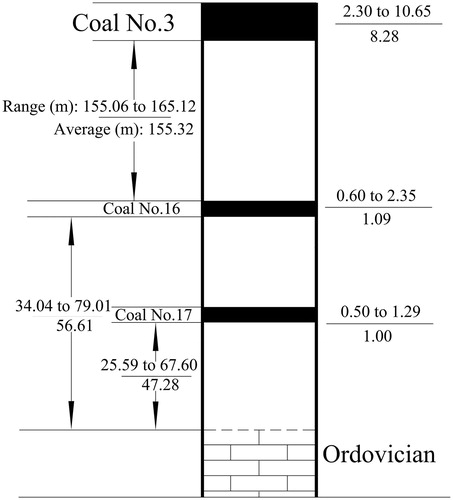
Drilling studies have found that the Badou group is separated from the targeted coal seams by an aquitard in the lowermost coal strata. The aquitard is mostly made up of a lower layer of thick grey limestone with some brecciated limestone and yellow-green marl, and an upper layer consisting of grey or dark grey thick-bedded limestone and dolomitic limestone with thin-bedded limestone. For coal seam No. 16, the thickness of the aquitard ranges from 34.04 m to 79.01 m with an average of 56.61 m ().
Figure 4. Intervals between the top of the Ordovician and coal seams shown as ranges and as averages (meters).
3. Prediction method for multiple factors
For this study, the AHP-GIS-Vulnerability method was used to assess the risks of coal floor water inrush. Wu and Zhou (Citation2008) have proposed coupling GIS and AHP methods. However, many evaluations of coal floor water inrush have only considered faults as geological structures of concern (Wu et al. Citation2015; Wu et al. Citation2016). In these studies, the density of faults, fault intersections, and endpoints have been additional important factors for risk evaluation, but investigators did not highly consider the fold structures. In this paper, the fractal grid method was used to describe the faults and folds and a new integrated method was developed. This technique consists of six steps, as described below:
Analysis of hydrogeological conditions and determination of factors controlling water inrush.
Fractal analysis of geological structures and quantification of faults, synclines, and anticlines.
Thematic map of all the factors.
AHP model, calibration, and analysis.
Spatial GIS analysis and vulnerability calculation.
Prediction results and water inrush risk maps.
In China, the WCM is important for forecasting and is mentioned in the Regulation for Coal Mine Water Prevention and Control, China (SACMSC Citation2009). The water-inrush coefficient is defined as follows: Ts=P/M, where Ts is the water-inrush coefficient (MPa/m), P is the water pressure on the aquiclude between the mining space and the aquifer that is a water-inrush source (MPa), and M is the thickness of the aquiclude (m). According to the SACMSC (Citation2009), prior to 1964, water inrush did not tend to occur above the confined aquifer in the Jiaozuo Mining Area if Ts was below 0.06 MPa/m in areas with geological structures or below 0.10 MPa/m in areas without geological structures. Now, there are prediction methods to extend the two factors from the WCM (Li et al. Citation2018). Here, a field study of 50 coal mines was carried out to propose an Integrated Prediction Method (IPM) for the WCM.
4. Prediction model for floor water disasters
4.1. Controlling factors of water inrush
The selection of primary factors controlling water inrush is very important. Each coal mine has its own unique geological conditions. The factors that cause disasters are related to both mining activities as well as geological and hydrogeological features. As evaluation is proposed before mining activities begin, this study only considered the natural factors, i.e. geological and hydrogeological conditions. As many other studies have mentioned, factors that cause coal floor water disasters include water pressure, water abundance, thickness of the effective aquiclude, and characteristics of geological structure. Water pressure and thickness of the effective aquiclude are the two crucial and elementary factors for a risk assessment. Water abundance is an index for interpreting the supply potential of the aquifer. Geological structures could destroy the integrity of the aquiclude and are natural channels for water break over. The accurate quantification of geological structures is important for evaluation and the available geological information determines the factors that can be selected, especially for a deep coal mine. Data from mining explorations, such as geological and hydrogeological wells and geophysical engineering, also contributed to this risk assessment.
The water that threatens coal seam mining mainly comes from the Ordovician aquifer, which is a regional extremely thick aquifer like an underground ocean. The structure and accuracy of AHP are influenced by the selection of water inrush controlling factors. In China’s sub-surface coal mining history, the Ordovician aquifer has caused several water disasters that flooded entire underground engineering systems. According to an analysis of possible types of water inrush conditions in this coal mine area, six main controlling factors for coal seam No. 16 have been identified:
Water pressure acting on the lower aquiclude boundary between coal seam No. 16 and the Ordovician aquifer.
Water abundance in the Ordovician aquifer: In China, the drilling unit water inflow index (q) describes groundwater characteristics.
Aquiclude thickness between coal seam No. 16 and the Ordovician aquifer.
Capacity dimension of the fault.
Capacity dimension of the syncline.
Capacity dimension of the anticline.
4.2. Thematic maps of controlling factors
4.2.1. Geological structure
The characteristics of geological structures have been studied using different methods. The fractal geometry method is useful for studying fault and fold systems. Geometry is widely used to study irregular curves with self-similarity or irregular graphs with self-inversion. The geometries of faults and folds exhibit fractal behaviour (Allègre et al. Citation1982; King Citation1983; Turcotte Citation1986). There are statistical similarities in the geometry, kinematics, and dynamics between faults, joints, and microscopic faults in geological structure, which form the theoretical basis of fractal theory applied to the study of faults and other structures (Francisco and Mauricio Citation2018).
Fractal dimension is an important parameter for quantitative fractal evaluation. F is defined to be the set of bounded points on the plane contained in a rectangle, which is divided into several squares with side length ε. There are some small squares that contain the points in F, and the point number (N(ε)) can be recorded. The capacity dimension Dk is defined as:
(1)
(1)
The geological track line is covered by a grid with edge length ε. Edge length (εi) then decreases continually and N(εi) can be obtained. In this paper, capacity dimensions for the fault, syncline, and anticline were calculated over a rectangular region with a scale of 27,000 m 18,000 m. The whole region was divided into 486 units with a scale of 1000 m
1000 m and then each unit was divided into smaller grids of different sizes (500 m
500 m, 250 m
250 m, 125 m
125 m, and 62.5 m
62.5 m). The number of small grids containing geological structural lines was counted for each level, as well as the capacity dimension. Due to the large number of units, this paper used the powerful image processing functions of Matlab to automatically calculate capacity dimension. Results were then imported into GIS to create the thematic maps ().
Figure 5. (a) Capacity dimension of anticline. (b) Capacity dimension of syncline. (c) Capacity dimension of fault. (d) Thickness of aquiclude. (e) Water pressure distribution. (f) The distribution of q.
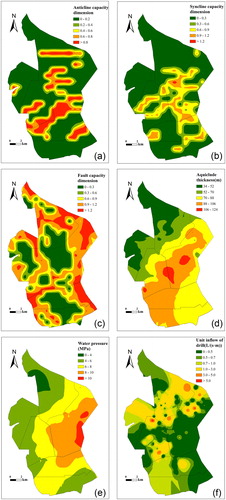
4.2.2. Quantification of other factors
Borehole exploration logs, long-term groundwater table monitoring data, information from pumping wells, examples of water inrush disasters, and deep geological structural results made up the elementary geological data for the analysis of water inrush prevention. Each study area was required to have relatively abundant geological and hydrogeological data for prediction. Data on aquifer water pressure, water abundance, and thickness of the effective aquiclude were obtained from borehole explorations and hydrogeological wells. Information on geological structures was extracted from geophysical explorations and underground excavation results. A GIS provides drawing tools and application functions for mesh generation and interpolation. Therefore, it can be used to quantify area information from point data using interpolation and to establish thematic maps of the controlling factors.
4.2.3. Thickness of the effective aquiclude
An evaluation of aquiclude water-resistance capacity incorporates lithology, rock mass structure, and effective thickness. Mine thickness and panel width are also crucial aspects of mining pressure, which could affect the depth of the damaged floor strata. Water inrush disasters from deep aquifers in underlying coal seams can also be caused by faults and karst collapse pillars, which widely exist in the North China coal fields. Beneath the mining space, the mining-induced failure depth (Cp), which ranged from approximately 5 m to 20 m according to the measured data, should generally be subtracted from the total thickness of the aquiclude. Aquicludes are typically mudstone-sandstone compounds. Mudstone varieties, such as sand-shale, silty mudstone, and argillaceous rock, may have a weak ability to resist high water pressure but have better water absorption. Hard rocks, such as sandstone and limestone, may have a strong ability to resist high water pressure but have poor water absorption ability. The mudstone aquifuge was plastic and quite impervious. Consequently, the permeability of hard rock was good and the mudstone-sandstone compound type, which was mostly met, was good for water inrush and water flow prevention. According to data from wells in the Ordovician aquifer, an isopleth map of the effective aquiclude thickness was constructed, as shown in .
4.2.4. Aquifer water pressure
The high water pressure acting on the aquiclude between mining spaces and the aquifer is the crucial factor and an important power source for inducing water inrush. However, the water table of an aquifer can vary along with time. Therefore, the average water table depth measured over the last 10 years was selected. The water table depth was then converted into hydraulic pressure. shows the water pressure acting on the lower boundary of the aquiclude.
4.2.5. Aquifer water abundance
“Drilling unit water inflow” (q) is a commonly accepted index in China and refers to a well’s ability to supply water. The value of “q” represents the flow rate (yield) that can be obtained from a “standard” diameter well (91 mm) for a 10 m drawdown. If q ≤ 0.1 L/(s·m), the well’s ability to supply water is classified as weak; 0.1 L/(s·m) <q ≤ 1.0 L/(s·m) is regarded as moderate, while 1.0 L/(s·m) <q ≤ 5.0 L/(s·m) demonstrates strong yield capacity. Values of q > 5.0 L/(s·m) indicate wells with a superior ability to supply water. Where boreholes did not conform to the 91 mm “standard” diameter, the data were corrected according to the methodology outlined by Qiao et al. (Citation2017).
4.3. AHP method for risk evaluation
The Analytic Hierarchy Process (AHP) method was used to calculate the contribution of each factor to water inrush. AHP is a structured technique for organizing and analyzing complex decisions based on mathematics and psychology (Saaty Citation1980; Saaty and Vargas Citation2012). AHP is used widely for making decisions about complex and systematic problems including forecasting, risk analysis, policy decisions, technology, etc. (Partovi et al. Citation1990; Gaudenzi and Borghesi Citation2006). The factors controlling water inrush have been evaluated by experienced and knowledgeable experts. The assessment standard is in accordance with the 1–9 scale method (Saaty Citation1977). In the AHP method used in this study, there were three layers for risk evaluation: the target, criterion, and decision layers. The target layer was A, the water inrush risk. The criterion layers included B1 (thickness of aquiclude), B2 (geological structures), and B3 (Ordovician aquifer). The decision layers were C1 (thickness of aquiclude), C2 (capacity dimension of syncline), C3 (capacity dimension of anticline), C4 (capacity dimension of faults), C5 (water pressure), and C6 (drilling unit water inflow). The total score for each factor was compared and a judgment matrix was created (). Based on the judgment matrix, the weight of every factor was calculated, as shown in . The stochastic consistency ratio was also checked. The maximum eigenvalue λmax was 3.0649, the coincidence indicator (CI) was 0.0139, and the stochastic consistency ratio of the judgment matrix (CR) was 0.0559. Based on the AHP results, if CR < 0.1, the judgment matrix had satisfactory consistency.
Table 1. Judgment matrix.
Table 2. Weight of six factors.
4.4. Vulnerability assessment and prediction results
The results described above were used to interpret the vulnerability to floor water inrush at every point. Also, in every grid, the vulnerability index was considered to be the comprehensive criterion for water inrush. Each controlling factor influenced every grid and contributed to the comprehensive criterion. Therefore, the threshold values and discriminate standards of floor water inrush risk were in accordance with the calculated statistical results for the grouped vulnerability index. Finally, the prediction model was calibrated using the known water inrush points.
4.4.1. Data normalization
In order to eliminate the influence from different dimensions of each factor, the data for each factor were normalized for analysis. The normalization method is shown in the following equation:
(2)
(2)
where Ni is the normalized data, xi is the value of one factor i, ximin is the minimum value of one factor i, and ximax is the maximum value of one factor i. All original data came from the exploration wells and GIS was used for data processing prior to normalization.
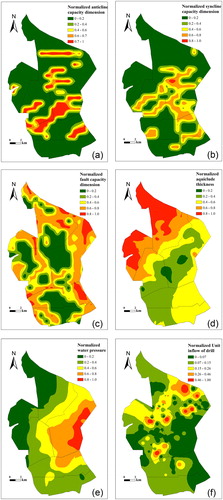
The capacity dimensions (syncline, anticline, and faults), water pressure, and drilling unit water inflow had positive correlations with floor water inrush, indicating that the larger these values were, the more dangerous the water inrush became. In contrast, the thickness of the aquiclude was negatively correlated with water inrush. Therefore, the positive and negative correlations of six factors with the possibility of water inrush should be considered before analyzing the normalized maps. shows the normalization results.
Figure 6. (a) Normalization of anticline. (b) Normalization of syncline. (c) Normalization of faults. (d) Normalization of thickness of aquiclude. (e) Normalization of water pressure. (f) Normalization of unit water inflow.
4.4.2. Analysis of vulnerability
Prior to the vulnerability analysis, normalized thematic maps for all six factors were integrated into one layer. The full map contained all information for the six factors. The topological reconstruction function in GIS was used to create integrated attribute data about the topological relationships between the factors. Therefore, the resulting vulnerability index was a GIS-based integrated criterion of coal floor water inrush at the grid scale. Every grid cell contained six values, one for each factor, which were used to calculate the vulnerability index. Vulnerability results were obtained using EquationEq. (3)(3)
(3) .
(3)
(3)
Where VI is the vulnerability index, Wk is the weight of one factor (), fi (x, y) is the value of each factor after normalization, and n is the number of controlling factors.
Thus, according to EquationEq. (3)(3)
(3) , the vulnerability index was calculated for every grid cell and the prediction model was established to evaluate floor water inrush at coal seam No. 16 in the Yanzhou mining area.
4.4.3. Prediction results
Based on the vulnerability index calculations for each grid cell, thresholds were determined based on statistical frequency of grid results (). There were four classification thresholds for vulnerability to floor water inrush in coal seam No. 16 ():
Figure 7. Number of units vs. vulnerability index.
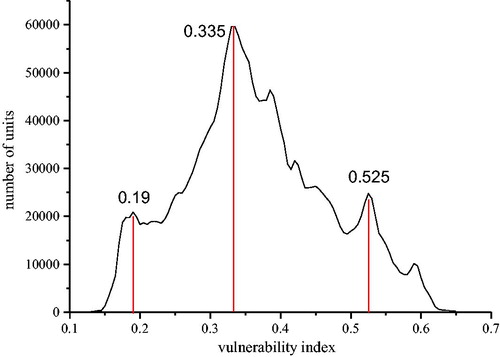
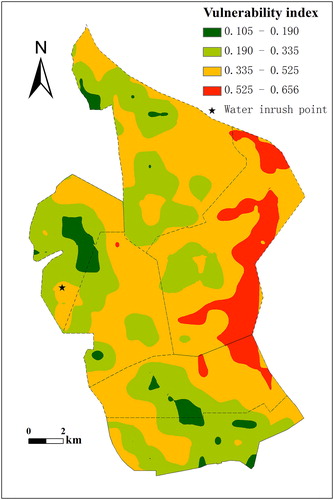
Figure 8. Vulnerability zoning of study area.
VI > 0.525: Areas vulnerable to floor water inrush
0.335 < VI ≤ 0.525: Areas less vulnerable to floor water inrush
0.19 < VI ≤ 0.335 Areas relatively safe from floor water inrush
VI ≤ 0.19 Areas safe from floor water inrush
shows that the areas that were vulnerable to floor water inrush generally had high water pressure, relatively thin aquiclude, greater water abundance, and complicated geological structures. Strict water hazard prevention measures must be formulated in these areas before coal resource extraction. The less vulnerable areas to floor water inrush were distributed widely throughout the study region, indicating that the synclines, anticlines, faults, and drilling unit water inflow had an important influence on water inrush risk. Only one water inrush event has occurred in the less-vulnerable areas of Yangcun. During mining operations in these areas, careful water inrush control methods should be carried out and hydrogeological information must be monitored in real time. The relatively safe areas were mainly distributed to the south and west of the coal mine region. Finally, safe areas were found to the west, south, and north of the study area. Relatively safe and safe areas were generally found in regions with thick aquiclude, smaller drilling unit water inflow, and fewer geological structures.
5. Integrated Prediction Method
Due to the limited mining area around coal seam No. 16 (Yangcun, Beisu, and Nantun coal mines), only one water inrush event has occurred. As shown in , the safe and relatively safe areas were most prominent in the Yangcun and Beisu coal mines. No water disasters occurred from the Ordovician in the Beisu coal mine. Current coal seam No. 16 mining areas in the Nantun coal mine were all located in the safe or relatively safe zones, so there was no water inrush at Nantun. With the expansion of the mining area at Yangcun, mining activities have moved from safe and relatively safe areas to less vulnerable areas, and one accident is shown in . The prediction results were therefore suitable for the practical conditions. However, due to the fact that there are no mining activities at coal No.16 in the Xinglongzhuang, Baodian, and Dongtan mines, we could only calibrate the less vulnerable, safe, and relatively safe prediction results for Yangcun, Beisu, and Nantun. If there were more practical examples of water inrush disasters, we would be able to propose further model calibration and nonlinear prediction using artificial neural networks, least squares support vector machines, or nonlinear regression. However, these nonlinear methods are not suitable for water-inrush disaster prediction. The more examples there are of water inrush for a specific area, the more precise the prediction results will be. The vulnerability method is therefore effective for floor water inrush prediction prior to large-scale mining activities.
The WCM was proposed in 1964 and statistical instances were obtained prior to 1964. We carried out a mining field study and reviewed water inrush data in the literature (Ge et al. Citation2000; Shi and Han. Citation2004; Li et al. Citation1990; Wang 1996; Zheng et al. Citation1998; Zhang and Zhao Citation2009), obtaining 314 examples of floor water inrush disasters from 1949 to 2017 in China. These included 100 survey data results and 214 samples from the literature. The sample points are shown in , where it can be seen that the lines for Ts = 0.06MPa/m and Ts = 0.1MPa/m were accurately predicted. Nevertheless, Equationequation (4)(4)
(4) resulted in a more realistic form of the equation for the water inrush points. Based on Equationequation (4)
(4)
(4) and through the addition of a first-power item and a constant term, the prediction line in provided better prediction criteria compared to the WCM.
(4)
(4)
Figure 9. (a) Prediction line and water-inrush coefficient. (b) Prediction line and water-inrush coefficient.
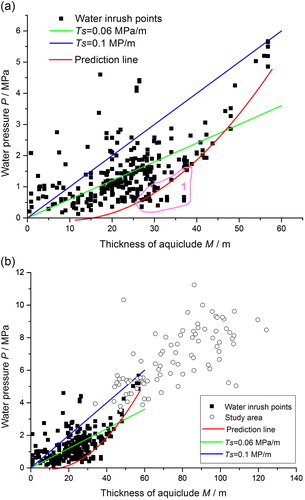
The practical examples shown in were mostly focussed on areas with water pressure less than 3 MPa. When the hydrogeological exploration well points in the study area were plotted in , it was evident that the empirical methods, water-inrush coefficient, and prediction line could not be completely applied to the aquiclude thickness and high water pressure in the study area. Therefore, the predictions for high water pressure and thick effective aquiclude were determined using a method that integrated the prediction line and the water inrush coefficient. shows the water inrush risk zones for disaster prediction. The prediction line was interconnected with the horizontal axis (M), Ts = 0.06MPa/m and Ts = 0.1MPa/m at points A, B, and C, respectively. As indicated in SACMSC (Citation2009), water inrush tended not to occur if Ts was below 0.06 MPa/m in areas with geological structures or below 0.10 MPa/m in areas without geological structures. Therefore, the prediction criteria for IPM were:
Figure 10. Water-inrush risk zones for IPM: A (15,0); B (46.78, 2.81); C (66.45, 6.65); Prediction Line: P = 0.00207M2 − 0.03922M + 0.1112.
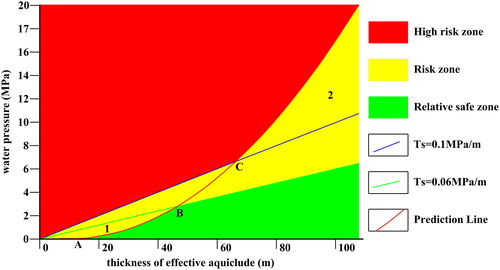
Relatively safe criterion:
High risk criterion:
Other conditions: Risk criterion
6. Discussion and conclusions
The IPM was carried out to amend the WCM in the low water pressure ranges, along with the WCM in the high water pressure ranges (). The prediction results based on the WCM and prediction line method are shown in .
Figure 11. Results of prediction line and water-inrush coefficient: 3 and 7. Risk zone; 8. Relative safe zone; 1, 2, 4, 5, and 6. High risk zone.
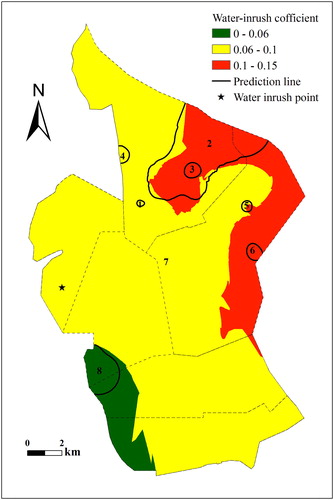
Although the practical water inrush point was also located in the relatively at-risk area identified by the IPM (as shown in ), the safe mining areas of Yangcun, Nantun, and Beisu coal mines were located in the relatively at-risk area. Comparing and , the vulnerability prediction method () gave more accurate and robust results.
The traditional WCM and the promotional IPM were all established based on two factors: water pressure and thickness of the aquiclude. Faults and folds were not considered in the IPM. Many additional factors such as hydrogeology, engineering geology, and especially geologic structures, should be considered prior to making decisions regarding the prevention of and recovery from floor water inrush disasters. Therefore, the following conclusions were drawn:
Six main controlling factors were identified for the prediction of coal floor water inrush in the Yanzhou mining area, which were water pressure, thickness of aquiclude, water abundance of aquifer (drilling unit water inflow, q), faults, syncline, and anticline. The capacity dimensions of the fault, syncline, and anticline were calculated over a rectangular region. The whole study area was divided into a number of units and each unit was divided into smaller grids of different sizes. The number of small grids containing geological structural lines was counted at each level along with the capacity dimension, and the results were imported into a GIS to create thematic maps. Based on the AHP evaluation and the six thematic maps, the vulnerability index method was used to calculate vulnerability and to evaluate and predict floor water inrush at coal seam No. 16 in the Yanzhou mining area. According to the vulnerability results, the mining area was divided into four areas: vulnerable, less vulnerable, relatively safe, and safe. Three-hundred and fourteen examples of floor water inrush disasters from 1949 to 2017 in China were collected based on data from 100 surveys and 214 samples from the literature. A prediction line was derived for input into the WCM and an IPM was proposed. Compared to IPM, the vulnerability method containing multiple factors described the complex nonlinear processes well and the evaluation results were meaningful.
Acknowledgements
The authors also thank the reviewers for their helpful comments.
Additional information
Funding
Related Research Data
References
- Allègre CJ, Le Mouel JL, Provost A. 1982. Scaling rules in rock fracture and possible implications for earthquake prediction. Nature. 297(5861):47–49.
- Boughriba B, Barkaoui A, Zarhloule Y, Lahmer Z, Houadi BE, Verdoya M. 2010. Groundwater vulnerability and risk mapping of the Angad transboundary aquifer using DRASTIC index method in GIS environment. Arab J Geosci. 3(2):207–220.
- Chen W, Li H, Hou E, Wang S, Wang G, Panahi M, Li T, Peng T, Guo C, Niu C, et al. 2018. GIS-based groundwater potential analysis using novel ensemble weights-of-evidence with logistic regression and functional tree models. Sci Total Environ. 634:853–867.
- Dai GL, Xue XY, Xu K, Dong L, Niu C. 2018. A GIS-based method of risk assessment on no. 11 coal-floor water inrush from Ordovician limestone in Hancheng mining area. China Arabian J Geosci. 11:714.
- Francisco V, Mauricio AB. 2018. The transpressive southern termination of the Bucaramanga fault (Colombia): insights from geological mapping, stress tensors, and fractal analysis. J Struct Geol. 115:190–207.
- Gaudenzi B, Borghesi A. 2006. Managing risks in the supply chain using the AHP method. Int J Logistics Manage. 17(1):114–136.
- Ge LT, Ye GJ, Gao HL. 2000. Hydrogeology of CoalField in China. Beijing: China Coal Industry Publishing House; p. 295–304.
- Guo H, Adhikary DP, Craig MS. 2009. Simulation of mine water inflow and gas emission during longwall mining. Rock Mech Rock Eng. 42(1):25–51.
- Istvan B, Lucien D, Ferenc S. 1982. Bayesian analysis of underground flooding. Water Resour. Res. 18(4):1110–1116.
- Jamrah A, Al-Futaisi A, Rajmohan N, Al-Yaroubi S. 2008. Assessment of groundwater vulnerability in the coastal region of Oman using DRASTIC index method in GIS environment. Environ Monit Assess. 147(1–3):125–138.
- Jarvis AP, Younger PL. 2000. Broadening the scope of mine water environmental impact assessment a UK perspective. Environ Impact Assess Rev. 20(1):85–96.
- Kallioras A, Ruzinski N. 2011. Special issue: sustainable development of energy, water and environment systems. Water Resour Manage. 25(12):2917–2918.
- King G. 1983. The accommodation of large strains in the upper lithosphere of the earth and other solids by self-similar fault- system: the geometrical origen of b-value. PAGEOPH. 121(5–6):761–815.
- Li JK. 1990. Prevention and cure of karst water inrush in mine. Beijing: China Coal Industry Publishing House; p. 36–169.
- Li PY. 2018. Mine Water Problems and Solutions in China. Mine Water Environ. 37(2):217–221.
- Li WP, Liu Y, Qiao W, Zhao CX, Yang DD, Guo QC. 2018. An improved vulnerability assessment model for floor water bursting from a confined aquifer based on the water inrush coefficient method. Mine Water Environ. 37(1):196–204.
- Liu WT, Li Q, Zhao JY, Fu B. 2018. Assessment of water inrush risk using the principal component logistic regression model in the Pandao coal mine, China. Arabian J Geosci. 11:463.
- Osenbrück K, Fiedler S, KnÖller K, Weise SM, Sültenfuß J, Oster H, Strauch G. 2006. Timescales and development of groundwater pollution by nitrate in drinking water wells of the Jahna-Aue, Saxonia, Germany. Water Resour Res. 42:W12416.
- Partovi FY, Burton J, Banerjee A. 1990. Application of analytical hierarchy process in operations management. Int J Op Prod Manage. 10(3):5–19.
- Qiao W, Li WP, Li T, Chang JY. 2017. Effects of Coal Mining on Shallow Water Resources in Semiarid Regions: A Case Study in the Shennan Mining Area, Shaanxi, China. Mine Water Environ. 36(1):104–113.
- Qiu M, Han J, Zhou Y, Shi LQ. 2017. Prediction reliability of water inrush through the coal mine floor. Mine Water Environ. 36(2):217–225.
- Ribeiro L, Pindo JC, Dominguez-Granda L. 2017. Assessment of groundwater vulnerability in the Daule aquifer, Ecuador, using the susceptibility index method. Sci Total Environ. 574:1674–1683.
- Rygel L, O’Sullivan D, Yarnal B. 2006. A method for constructing a social vulnerability index: an application to hurricane storm surges in a developed country. Mitig Adapt Strat Glob Change. 11(3):741–764.
- Saaty TL. 1977. A scaling method for priorities in hierarchical structures. J Math Psychol. 15(3):234–281.
- Saaty TL. 1980. The analytic hierarchy process. New York: McGraw-Hill.
- Saaty TL, Vargas LG. 2012. Models, methods, concepts & applications of the analytic hierarchy process. New York: Springer Science & Business Media.
- SACMSC (State Administration of Coal Mine Safety of China). 2009. Interpretation of the regulations of mine water disaster prevention. Xuzhou: China University of Mining and Technology Press; p. 227–236.
- Shi LQ, Han J. 2004. Mechanics, forecast and prediction of floor water inrush. Xuzhou: China University of Mining and Technology Press; p.159.
- Stempvoort DV, Ewert L, Wassenaar L. 1993. Aquifer vulnerability index: a GIS - compatible method for groundwater vulnerability mapping. Canad Water Resour J. 18(1):25–37.
- Turcotte DL. 1986. A fractal model for crustal deformation. Tectonophysics. 132(1–3):261–269.
- Wu Q, Liu YZ, Liu DH, Zhou WF. 2011. Prediction of floor water inrush: the application of GIS-based AHP vulnerable index method to Donghuantuo Coal Mine, China. Rock Mech Rock Eng. 44(5):591–600.
- Wu Q, Liu YZ, Wu XL, Liu SQ, Sun WJ, Zeng YF. 2016. Assessment of groundwater inrush from underlying aquifers in Tunbai coal mine, Shanxi province, China. Environ Earth Sci. 75:737.
- Wu Q, Liu YZ, Zhou WF, Li BY, Zhao B, Liu SQ, Sun WJ, Zeng YF. 2015. Evaluation of water inrush vulnerability from aquifers overlying coal seams in the Menkeqing Coal Mine, China. Mine Water Environ. 35(3):258–269.
- Wu Q, Zhou W. 2008. Prediction of groundwater inrush into coal mines from aquifers underlying the coal seams in China: vulnerability index method and its construction. Environ Geol. 56(2):245–254.
- Xu DJ, Peng SP, Xiang SY, Liang MX, Liu WM. 2016. The effects of caving of a coal mine’s immediate roof on floor strata failure and water inrush. Mine Water Environ. 35(3):337–349.
- Zhang MX, Zhao W. 2009. Research and application on the mechanism and prevention technology of mine geological disaster. Xuzhou: China University of Mining and Technology Press; p. 12.
- Zhang SC, Guo WJ, Li YY, Sun WB, Yin DW. 2017. Experimental simulation of fault water inrush channel evolution in a coal mine floor. Mine Water Environ. 36(3):443–451.
- Zhao DK, Wu Q, Cui FP, Xu H, Zeng YF, Cao YF, Du YZ. 2018. Using random forest for the risk assessment of coal-floor water inrush in Panjiayao Coal Mine, Northern China. Hydrogeol J. 26(7):2327–2340.
- Zheng SS, Sun YJ, Yang YG. 1998. Compilation of China's experience in coal mine water control technology. Beijing: China Coal Industry Publishing House; p. 304.