
 ?Mathematical formulae have been encoded as MathML and are displayed in this HTML version using MathJax in order to improve their display. Uncheck the box to turn MathJax off. This feature requires Javascript. Click on a formula to zoom.
Abstract
Fire effects consist not only in direct damage to the vegetation but also in the modification of both chemical and physical soil properties. Fire can affect the alteration of soil properties in different ways depending on fire severity and soil type. The most important consequences concern changes in soil responsiveness to the water action and the subsequent increase in sediment transport and erosion. Post fire soil loss can increase in the first year by several orders of magnitude compared to pre-fire erosion. In this study a distributed model based on the Revised Universal Soil Loss Equation (RUSLE) is used to estimate potential post-fire soil loss for four different fire events occurred in Basilicata region in 2017. Geographic Information System techniques and remote sensing data have been adopted to build a prediction model of post-fire soil erosion risk. Results show that this model is not only able to quantify post-fire soil loss but also to identify the complexity of the relationships between fire severity and all the factors that influence soil susceptibility to erosion.
1. Introduction
Forest fires are considered one of the major causes of environmental degradation as they not only impact flora and fauna, but can also strongly affect ecological and geo-morphological processes and permanently compromise ecosystems functionality (Bowman et al. Citation2011; FAO Citation2015). Also in the Mediterranean area, fire has been used for millennia by human beings to modify natural environment in order to satisfy their vital needs. Wildfire therefore represented an ecological factor capable of shaping the biodiversity of mediterranean ecosystems (Pausas and Paula Citation2012; Rulli et al. Citation2013). In recent decades, there has been an alteration of the fire regime caused by socio-economic factors (abandonment of rural areas, modification of human behavior), policies (inadequate management and control of the territory) and environmental issues (climate change) which have led to an increase in the number, frequency, extent, time of occurrence and severity of fires events in the Mediterranean countries (Pausas and Fernandez-Muñoz 2012; Pausas and Paula Citation2012; Chergui et al. Citation2018). The main consequence is a weakening of the fire resilience in the Mediterranean ecosystems determined by the increase in fires frequency and the higher number of fires with higher severity (Rulli et al. Citation2013).
Fire severity affects hydrological response and soil losses (Fox et al. Citation2007; Moody et al. Citation2008; Moody et al. Citation2013). A high soil burn severity is generally associated with an increase in soil water repellency (Debano et al. Citation1998; Doerr et al. Citation2009) and a decrease in infiltration (Robichaud et al. Citation2010). Rainfall on recently burned basins produces increased runoff that commonly transports and deposits large volumes of sediment, both within and downstream from the burned area (Cannon and Gartner Citation2005; Cannon et al. Citation2008; Nyman et al. Citation2011; Moody et al. Citation2013; Riley et al. Citation2013; Santi and Morandi Citation2013). Most of the studies on the Mediterranean area concern fire-induced erosion events starting from about the early 1980s following the increase of fire activity (Shakesby Citation2011). However, the relationship between post-fire erosion and fire severity is still relatively poorly studied in this geographic area on the quantitative level (Pausas et al. Citation2008; Shakesby Citation2011; Parise and Cannon Citation2012). In fact, in the last decade there are few works in Spain (Mataix-Solera and Cerdà Citation2009; García-Ruiz Citation2010; García-Ruiz et al. Citation2013; Neris et al. Citation2016), Portugal (Lourenço et al. Citation2012), Greece (Blake et al. Citation2010), Italy (Calcaterra et al. Citation2007; Terranova et al. Citation2009; Rulli et al. Citation2013; Esposito et al. Citation2017). In contrast in the USA, methods that consider the spatial pattern in fire severity to assess the post-fire erosion risk and the indirect impacts as part of operational procedures are well developed (Parsons et al. Citation2010).
The aim of this study is to predict soil erosion rate in the first post-fire year considering average weather conditions. The study areas are located in the Basilicata region (Southern Italy) and the analysis has been carried out by using Remote Sensing data and geographical information systems (GIS). Here, a spatial version of RUSLE (Renard et al. Citation1997; Van der Knijff et al. Citation2000; Nasiri Citation2013) was applied to predict pre and post-fire water erosion. In order to evaluate the fire impact on RUSLE model (Larsen and MacDonald Citation2007; Terranova et al. Citation2009; Fernandez et al. Citation2010; Fernández and Vega Citation2016), we produce a soil fire severity map as close as possible to the fire events by using Sentinel-2 satellite data.
2. Study area and EO data
2.1. Study area
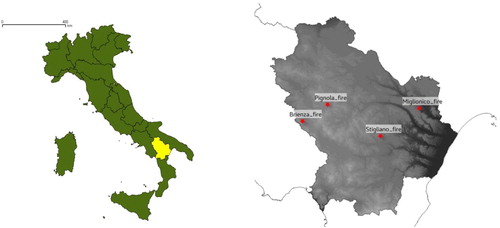
The study sites are located in the Basilicata region (), the most mountainous region of southern Italy, with 47% of 9,992 km2 covered by mountains, 45% is hilly and the remaining 8% is made up of plains.
Figure 1. Geographical localization of Basilicata region (left) and study sites (right).
Climate is influenced by three coastlines (Adriatic, Ionian and Tyrrhenian) and the physical feature complexity of the region. The climate is continental along the mountains and Mediterranean along the coasts. Approximately 35% of the total surface is covered with forest vegetation (mainly Oak woods, Beech woods, Mediterranean maquis, Mixed broadleaf and/or coniferous woods, Mediterranean scrubs). Grasslands, shrublands and cultivated soil cover approximately 45% of the whole surface. Between 2008 and 2017 in Basilicata region fire affected more than 25.000 ha (forest and non-forest) with about 2500 events generally large less than 10 ha. In 2017 (from January to September) about 6000 ha were affected by fires. The territory of Basilicata region is characterized by three main morphological and geological units (Piedilato and Prosser Citation2005) ():
Figure 2. (a) Geological sketch map of the Southern Apennines and surrounding areas; (b) geological cross-section (from Piedilato and Prosser Citation2005).
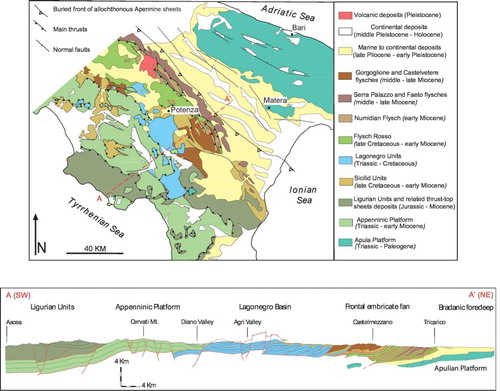
the Apennines, where two fundamental geologic complexes can be distinguished: the first one calcareous-dolomitic (carbonatic series), and the other, largely terrigenous, defined with the widely inclusive name of flysch;
the Bradanic Trough;
the Apulian Platform represented by a western offshoot of the Apulian Foreland.
The Apulian Platform covers a small area of the regional territory (just under 1%), while the other two formations, the Apennines and the Bradanic Trough, are widely represented, constituting respectively 56% and 43%. The Apulian Platform is made up of calcareous rocks of the Cretaceous period, on which variously cemented calcarenites are placed, followed upwards in stratigraphic succession by clays, sand and conglomerates. In correspondence of the Bradanic Trough, clayey-sandy sediments assume a greater development and diffusion. In the south-east zone, towards the Ionian Sea, alluvial sediments, ground debris, river deposits are more frequent; it is incoherent material sometimes weakly compacted, with granulometry variable from coarse to fine. Characteristic of the Bradanic Trough are the calanchi-type badlands defined as ‘typed forms of fast linear erosion’. They are caused by water erosion that penetrates into the cracks of clayey layers dried by sun; this process leads to the formation of small streams that gradually widen and then evolve to more or less large ditches separated by narrow passages.
The Apennines presents more complex geological features. It is a mighty tectonic building made up of geological bodies superimposed on each other. The western area is mainly composed of a powerful calcareous-dolomitic succession, while moving further eastwards there are widespread marly-arenaceous and clayey-marly formations, among which are the so-called ‘Argille varicolori’ which, due to their lithological rock strata characteristics and orientation, identify the typical landslide landscape of the region. The eastern part of the Apennine relief is formed above all by arenaceous and marly-arenaceous soils, which, sometimes, come abruptly into contact with predominantly clayey plio-pleistocene deposits, which fill the Bradanic Trough.
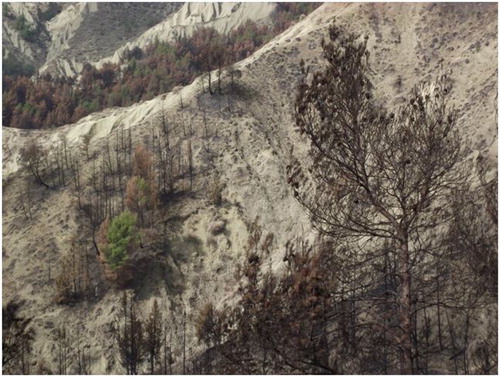
The slope morphology and soil composition make most of the territory highly erodible. In fact, from the genetically unstable geological nature of the territory derives the poor consistency of its soils, largely formed by a substrate of calcareous rocks, on which overlaps mainly clays and sands have been superimposed. In relation to the territory structural features, tectonic movements produced between the end of the Tertiary and the Quaternary era have left numerous and macroscopic effects that are expressed in precise and typical forms of relief. In several places rock masses have been broken and spread from the faults in a series of blocks that, when lowered, raised or moved horizontally, depending on the case, produced reliefs and troughs. Almost everywhere these soils are easily subjected to erosion and runoff, where the loss of vegetation cover and wood in past eras, has constituted an aggravating factor that has led to serious hydrogeological instability. In fact, half of the territory of the Basilicata Region is under risk of desertification and/or presents serious phenomena of superficial erosion (Piccarreta et al. Citation2006; Piccarreta et al. Citation2012; Salvati et al. Citation2013). The soil erosion is aggravated by the climatic regime increasingly characterized by marked seasonality and intense rainfalls. These geologically unstable conditions are aggravated in the burned areas due to the reduction of vegetal coverage and soil features () resulting in a high risk of soil erosion.
Figure 3. Soil erosion after wildfire (Pisticci, Basilicata).
To assess pre- and post-fire soil erosion we selected four fire events that occurred in the summer 2017 into the study area (). One of them (Miglionico fire) is located within the morpho-geological unit of the Bradanic Trough, two of them (Stigliano fire and Rifreddo fire) are located within the morpho-geological unit of the flysch, the last (Brienza fire) is included in the calcareous-dolomitic complex of the Apennines.
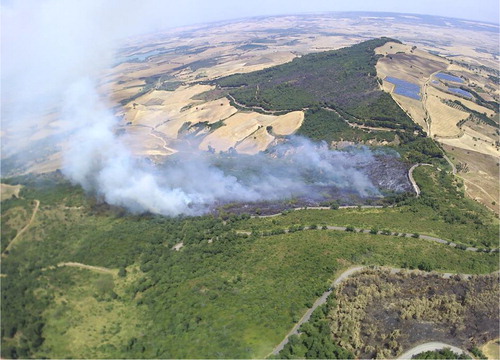
The Miglionico fire () occurred on 4–5th August affecting about 150 ha at an elevation between 130 and 450 meters masl. Geology of the territory is mainly constituted by quarzarenites at the highest elevations and gray-blue marly clays at the lower elevation where badland conditions are common. Vegetational cover consists of typical maquis shrublands and their degraded version (garigue), oak and Mediterranean pine woods.
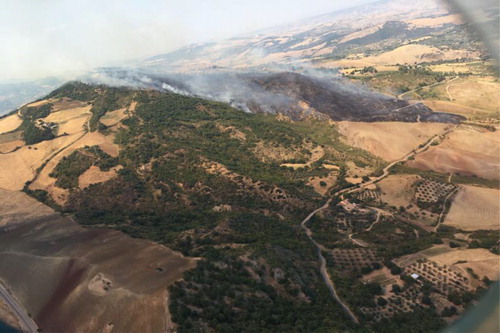
Figure 4. Miglionico fire aerial image. (source: Civil Protection Department - Basilicata Region).
The Stigliano fire () occurred on 9–10th August and it covered an area of about 90 ha at an altitude between 600 and 1000 meters masl. From the geological point of view this area is characterized by quarzarenites with subtle intercalations of clayey rocks (Numidian Flysch). Vegetation consists of degraded mediterranean maquis (garigue) and oak woods.
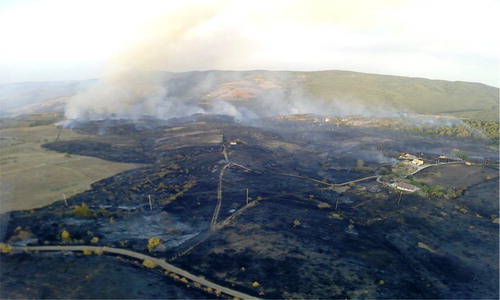
Figure 5. Stigliano fire aerial image. (source: Civil Protection Department - Basilicata Region).
The Rifreddo fire () occurred on 9–11th August on a surface covering about 270 ha at an elevation between 750 and 1100 meters masl. The geology of this area is dominated by brown marly clays with intercalation of marly limestone (Flysch Rosso) (Cavalcante et al. Citation2011). Here vegetation is characterized by low and tall shrublands, mountain pine woods and oak woods.
Figure 6. Rifreddo fire aerial image. (source: Civil Protection Department - Basilicata Region).
The Brienza fire occurred on 16–21st August and it affected 250 ha at an elevation between 800 and 1250 meters masl. The area is part of the geological unit of carbonatic series with soils consisting of alternating calcarenites and calcirudites. Vegetation cover consists of meso-xerophytic grasslands, shrublands and mixed broad-leaved woods (Forest Map of Basilicata – http://basilicata.podis.it/startpage/cartaForStart.htm).
2.2. EO Data – Sentinel-2 satellite
To assess fire severity, images of ESA (European Space Agency) Sentinel-2 satellite were used. Sentinel-2 mission is a land monitoring constellation of two satellites consisting of Sentinel-2A, launched on 23 June 2015 (Nowakowski Citation2015), and Sentinel-2B, launched on 7 March 2017 in the European Union Copernicus programme framework (Drusch et al. Citation2012; Hagolle et al. Citation2015; Segl et al. Citation2015). This twin satellites fly in the same orbit, phased at 180°, with a revisit frequency of five days at the Equator and a field of view of 290 km. They provide high resolution multi-spectral optical imagery by using 13 spectral bands of the MSI (Multispectral Imager) instrument with four bands at 10 m, six bands at 20 m, and three bands at 60 m spatial resolution () (Agancy Citation2015).
Table 1. Sentinel-2 overview.
Sentinel-2 standard level-2A (L2A) products are freely available from the Copernicus Scientific Data Hub website as surface reflectance ortho-images. For this study we acquired five Sentinel-2 images () in order to assess the four fire events severity occurred in our study area.
Figure 7. Sentinel-2 Multispectral Instrument (MSI) imagery (26 August 2017). True-colour composite of Red, Green and Blue bands in Bottom-of-Atmosphere reflectance data.
3. Material and methods
The entire procedure was carried out with the open source QGIS software and related plugins. In particular, given the use of satellite images, semi-automatic classification plugin (SCP) was deployed, which allows both image download and pre and post processing.
3.1. Soil fire severity assessment
Fire severity was assessed using the Sentinel 2A bands most sensitive to post-fire reflectance changes. In particular, the reflectance in the mid infrared band (Band12 – SWIR), sensitive to the water content of both soil and vegetation, increases after the fire, while in the near infrared region (Band8A – NIR) a reflectance decline occurs due to the decrease of the phytomass chlorophyll content. The normalized burn ratio (NBR) index, widely used to assess fire severity (Cocke et al. Citation2005; Epting et al. Citation2005; Escuin et al. Citation2008; Lanorte et al. Citation2013), was created considering these characteristics (Key and Benson Citation2006; Roy et al. Citation2006).
By using Sentinel-2 images, NBR is calculated as reported in EquationEquation (1)(1)
(1) :
(1)
(1)
Further, the difference between pre and post-fire NBR to obtain the dNBR (see EquationEquation (2)(2)
(2) ) was applied to provide a measure of the change that can be used to characterize the degree of fire severity which is related to the environmental changes caused by the fire.
(2)
(2)
In order to infer fire severity degree, dNBR values was categorized. As it is known that dNBR ranges values are basically site-specific, fixed thresholds were not applied but Holden and Evans (Citation2010) classification approach was adopted. These authors applied an unsupervised fuzzy c-means clustering algorithm (Hartigan and Wong Citation1979) to objectively assign fire severity classes to dNBR on the base of data iterative partitioning (Bezdek Citation1981; Roubens Citation1982; Odeh et al. Citation1992). This approach has benefits such as objectivity, possibility of use in case of unavailability of field data and minimizing the issues due outliers. In this study we selected six classes of dNBR: unburned; very low, low, moderate, high and very high.
Some studies (Safford et al. Citation2008; Collins et al. Citation2009; Collins and Stephens Citation2010) have shown that dNBR is the most suitable index to estimate soil fire effects while a better way of remotely sensing fire effects on vegetation is to use a relative index (RdNBR). In effect such studies seem to show that RdNBR is more sensitive to vegetation mortality and dNBR to soil burn severity; therefore, in this work, the term ‘soil burn severity’ to differentiate post-fire soil properties from fire effects on vegetation was used (Hungerford Citation1996; DeBano et al. Citation1998; Robichaud et al. Citation2000; Certini Citation2005).
3.2. Soil loss modelling. RUSLE factors
Pre and post-fire soil loss was computed using RUSLE (Revised Universal Soil Loss Equation) model (Renard et al. Citation1991, Citation1997), developed on the basis of previous USLE model (Wischmeier and Smith Citation1978). All necessary RUSLE parameters are resampled to the Sentinel 2A spatial resolution (10 m). Soil erosion assessment based on the RUSLE model (EquationEquation 3(3)
(3) ) involves five input parameters related to precipitation, soil features, topography, cover and crop management and conservation practices (Wischmeier and Smith Citation1978; Renard et al. Citation1997; Van der Knijff et al. Citation1999, Citation2002; Grimm et al. Citation2003; Kinnel Citation2010; Lazzari et al. Citation2015).
(3)
(3)
where:
A = annual soil loss (Mg·ha−1·year−1)
R = rainfall erosivity factor (MJ·mm·ha−1·h−1·year−1)
K = soil erodibility factor (Mg·h·MJ−1·mm−1)
LS = slope length factor and slope steepness factor (unitless)
C = crop and cover management factor (unitless)
P = conservation supporting practices factor (unitless)
Due to the high cost of soil erosion measurements, several authors (Claessens et al. Citation2008; Biswas and Pani Citation2015; Karamage et al. Citation2016) highlight the usefulness of erosion models that use secondary data (related to soil, topography, land cover and climate) available in a GIS environment with an adequate spatial resolution to estimate the model inputs.
The assessment of pre and post-fire soil erosion was achieved by the following three phases: (1) collection of geospatial data for burned areas (); (2) development of spatial RUSLE factors for pre and post-fire conditions; (3) estimation of soil loss by RUSLE for pre and post-fire scenarios (QGIS Raster Calculator) considering that the values of K, LS and C factors are influenced by fire (Miller et al. Citation2003; González-Bonorino and Osterkamp Citation2004; Benavides-Solorio and MacDonald Citation2005; Curran et al. Citation2006; Gimeno-García et al. Citation2007; Larsen and MacDonald Citation2007; Terranova et al. Citation2009).
Table 2. Spatial datasets sources used for the five RUSLE factors.
3.2.1. Rainfall-runoff erosivity factor (R)
R-factor is rainfall-runoff erosivity factor (MJ·mm·ha−1·h−1·year−1), significant of rain energy as erosive agent (Panagos et al. Citation2015a). It was calculated on the basis of monthly average accumulated rainfall using the following (Sorrentino Citation2001; Terranova et al. Citation2009):
(4)
(4)
where H (mm·y−1) is mean value of annual precipitation, q is the site elevation using 5m-DTM and NRE is the mean value of rainy events per year.
In this work, those rains that are separated by more than 6 hours and more than 12.7 mm in depth are considered to be erosive events (Renard et al. Citation1997; Panagos et al. Citation2015a). Rainfall values were derived from the historical precipitation data of the weather stations managed by the Basilicata Civil Protection Functional Center. Average of the values for 20 years (1996–2016) with subsequent interpolation in order to have a value for each of the study sites was calculated ().
Table 8. Range and Mean of RUSLE factors and soil loss prediction.
3.2.2. Soil erodibility factor (K)
The K-factor is the soil erodibility factor (Mg·h·MJ−1·mm−1), a numerical description of the susceptibility of soil particles to detachment and transport by rainfall and runoff (Wischmeier and Smith Citation1978) due to a combination of splash during rainfall, runoff and infiltration (Renard et al. Citation1997). Therefore, the K-factor represents susceptibility to soil erosion, transportability of sediments and amount and rate of runoff. Fire modifies soil structure and permeability, decreases total organic matter amount and therefore increases K-factor (Giovannini et al. Citation2001). An accurate estimation of K-factor requires intensive and time-consuming field measurements aimed at obtaining data on texture, structure, organic matter and permeability (Myronidis et al. Citation2010).
In the present study, the reference value of K-factor is the one obtained from the ‘Soil Erodibility in Europe High Resolution dataset’ (Panagos et al. Citation2014) provided by the JRC’s European Soil Data Centre (ESDAC). Larsen and MacDonald (Citation2007), underlining as other authors that high-severity fires increase sediment yields by several orders of magnitude (e.g. Moody and Martin Citation2001; Coelho et al. Citation2004; Benavides-Solorio and MacDonald Citation2005; Shakesby and Doerr Citation2006; Shakesby Citation2011), believe that the burning effect on K factor is always underestimated and an increase of 100% of K-factor is only a small fraction of the 2–3 orders of magnitude increase in sediment yields induced by high-severity fires. Shakesby (Citation2011) notes that most of authors (e.g. Béguin Citation1992; Ballais Citation1993; Martin et al. Citation1993; Badía and Martí Citation2000; Lasanta and Cerdà Citation2005) found this increase throughout Mediterranean area between 1 and 4 orders of magnitude. However, in this work we cautiously used the same criteria applied by Terranova et al. (Citation2009) in Calabria region and therefore K was multiplied by a factor between 1.6 (very low severity) and 2 (very high severity) ().
3.2.3. Slope length and steepness factors (LS)
L and S factors represent the effect of topography on soil erosion rate. Slope length (L) in RUSLE is defined as the point where overland flow starts to the point where deposition occurs or runoff waters are channelized (Panagos et al. Citation2015b). Total soil erosion loss increases if slope length increases as a result of runoff accumulation downslope (Foster et al Citation1977; Wischmeier and Smith Citation1978). Slope steepness (S) describes how erosion increases with slope angle. The soil erosion increases with the slope steepness as a result of the increasing speed and erosivity of runoff (Wischmeier and Smith Citation1978; Farhan and Nawaiseh Citation2015).
Topographic factor LS was calculated using the 5-m grid DTM with the support of QGIS software. For the computation of the LS factor at a point r on a hillslope we used the following equation (Mitasova et al. Citation1996):
(5)
(5)
where a(r) [meters] is the upslope contributing area per unit contour width (in the specific case studies we computed a(r) as product of QGIS functions ‘flow accumulation’ and ‘pixel resolution’); b is the slope in radians; a0 = 22.1 m is the standard USLE plot length; b0 = 9% is the slope grade of the standard USLE plot while μ and n are parameters that depend on type of flow and soil condition. In this study we set up n = 1.2 (Terranova et al. Citation2009), whereas for μ we used the following formula:
(6)
(6)
where β is the rill to interrill erosion ratio. The rill erosion is related to the surface flow while the interrill erosion is due to raindrop impact (Miller et al. Citation2003). According to Foster et al. (Citation2003) the assessment of β parameter implies the knowledge of several factors among which the ground cover effect on rill and interrill erosion where the ground cover affects rill erosion more than it affects interrill erosion (Terranova et al. Citation2009). Therefore the fire modifies rapidly the β value. In this study, we use the values reported by Miller et al. (Citation2003) for the estimate of β for modeling pre-fire and post-fire erosion considering β values ranging between 0.5 (unburned) and 1.0 (very high severity) ().
3.2.4. Crop and cover management factor (C)
C factor reflects surface cover and cover management impacts on soil erosion (Renard et al. Citation1997). Vegetation cover and appropriate crop management reduce runoff and soil erosion (Lee Citation2004) limiting the rain impact on soil surface. C factor is a ratio between soil loss of a parcel with a certain land use and a fallow condition (Wischmeier and Smith Citation1978; Kinnel Citation2010). C-factor for a given land-cover type ranges between 0, for a non-erodible surface, and 1, bare plot (no vegetation). In RUSLE model (Renard et al. Citation1997) C-factor is calculated as a product of five subfactors: prior land use, canopy cover, surface cover, surface roughness and soil moisture. However many authors adopt simplified approaches: for example by using land cover maps and assigning a C-factor to each class (Borrelli et al. Citation2014) or by applying remote sensing techniques such as image classification (Karydas et al. Citation2009; Lazzari et al. Citation2015) and vegetation indices (Vatandaşlar and Yavuz Citation2017).
In this work two different approaches to assess C-factor was adopted. For pre-fire scenario a lookup table was used in order to assign a C-factor to vegetation types obtained from remote sensing image classification. For post-fire scenario the C-factor estimation was based on satellite-derived vegetation indices.
To characterize and map vegetation types, Landsat 8 OLI-TIRS data and supervised classification techniques was used. The OLI and TIRS are sensors onboard the Landsat 8 satellite, which collect images with a 16-day repeat cycle. We used a USGS EROS Center (USGS Citation2015); its acquisition date is 13 August 2015 (). This image was geometrically corrected. Raw digital numbers (DN) were scaled to spectral radiance values (Chander et al. Citation2007; Chander et al. Citation2009) using the coefficients supplied by USGS metadata. Then, radiance values were converted to reflectance according to Chander and Markham (Citation2003). A terrain illumination correction model (Teillet et al. Citation1982; Tan et al. Citation2013) in order to make a topographic normalization was also applied.
Figure 8. Landsat image (left) acquired on 13 August 2015 (RGB 321) and Vegetation Map (right).
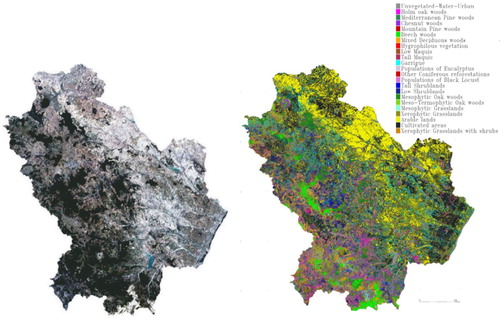
The prerequisite activity for the classification consisted in acquiring ground truth data obtained through an accurate recognition of the study area developed over several years and aimed at vegetation types identification. This is a totally cloud-free and well illuminated (large solar elevation angle) image. In the next step, a supervised classification (Maximum Likelihood Classification) was applied and subsequently a spectral analysis at the sub-pixel level was carried out (Mixture Tuned Matched Filtering) (Shimabukuro and Smith Citation1991) in order to obtain the vegetation-type map (Lazzari et al. Citation2015). The final map includes 22 vegetation types classes () corresponding to the spectral relatively homogeneous vegetation types identified through the ground-truth retrieval and selection of an appropriate number of regions of interest (ROI) to define the classification training points (Riaño et al. Citation2002). Pre-fire C-values were assigned to the resulting 22 classes according to literature C-values (Panagos et al. Citation2015c).
C-factor assessment in burned areas has been addressed by several authors. Cebecauer et al. (Citation2004) set the C-factor post-fire in the range between 0.35 and 0.55 for a soil erosion estimation in Slovakia. According to Larsen and MacDonald (Citation2007), C-factor in burned areas has a mean value of 0.2 but not exceed 0.33. Terranova et al. (Citation2009) in Calabria region (Italy) used C-factor equal to 0.01, 0.05 and 0.2 corresponding to low, medium and high fire severity. Many authors estimate C-factor using vegetation indices. In particular, they analyzed the linear correlation between C-factor and NDVI (Van der Knijff Citation1999; Lin et al. Citation2002; Van der Knijff Citation2002; Vatandaşlar and Yavuz Citation2017). However, Kuo et al. (Citation2016) observed that NDVI is highly variable where the C-factor is high. Therefore they applied another vegetation index, the Soil-Adjusted Vegetation Index (SAVI) (Huete Citation1988) to improve C-factor estimation and their results showed that SAVI is more strongly correlated with C factor than NDVI.
In this work, to estimate the C-factor post-fire SAVI was used because it is less variable than NDVI under scarcely vegetated or bare soil. On the base of the statistical regression analysis performed by Kuo et al. (Citation2016) we use the following equation:
(7)
(7)
where C is the cover management factor and a = 1.18
(8)
(8)
where L is an adjustment length and it was assumed as 0.5 and NIR and RED are the reflectance values in NIR and RED bands. SAVI is computed by using the better Sentinel 2A image acquired during the rainy season (October to November) ().
3.2.5. Support practice factor (P)
Support Practice (P) factor is an expression of the effects of agricultural management practices (terracing, contour, strip cropping, etc.) aimed to reduce the water runoff and consequently the soil loss (Wischmeier and Smith Citation1978). The adoption of supporting conservation practices decreases the p value which range between 0.2 (terraces with reverse slope) and 1.0 (no erosion control practices). To determine the value for the P-factor we apply the following equation (Wener method) to agricultural vegetation classes (Lufafa et al. Citation2003; Fu et al. Citation2005).
(9)
(9)
where S is the slope grade (%) and assuming that the maximum value of P is 1.0. This factor does not significantly affect the soil loss due to the scarce presence of agricultural areas.
4. Results and discussion
Applying methodology described in the previous section allowed us to map fire severity for our four study sites, which were subsequently used as input for the RUSLE model parameters estimation.
4.1. dNBR assessment
The dNBR index is used to produce soil fire severity map. For each fire event we use pre-fire and post-fire images very close to the fire days in order to capture the first-order fire effects on soil ().
Table 3. Fire events and Sentinel-2 data.
The dNBR index generated different spatial patterns of fire severity related to the distribution of fire intensity for each study site ()
Figure 9. Miglionico fire. Upper: Sentinel-2 image (pre-fire); Sentinel image (post-fire). Lower: dNBR; dNBR (range).
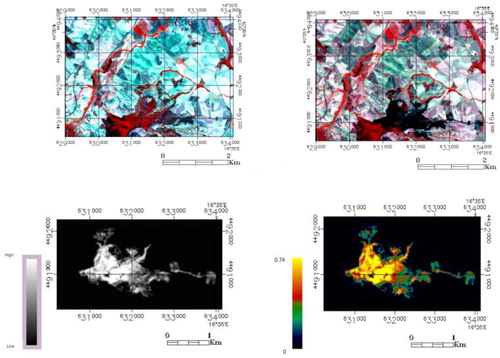
Figure 10. Rifreddo fire. Upper: Sentinel-2 image (pre-fire); Sentinel image (post-fire). Lower: dNBR; dNBR (range).
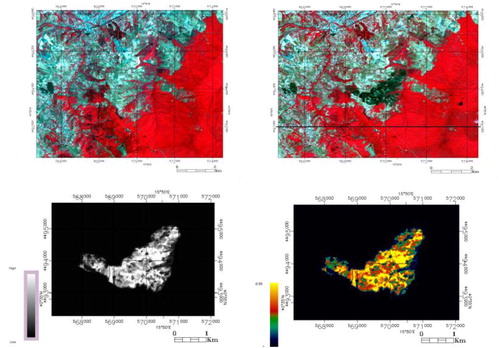
Figure 11. Stigliano fire. Upper: Sentinel-2 image (pre-fire); Sentinel image (post-fire). Lower: dNBR; dNBR (range).
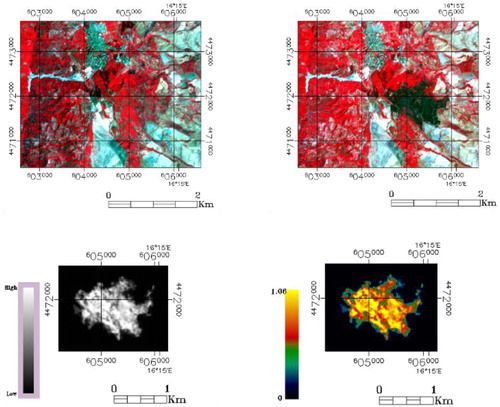
Figure 12. Brienza fire. Upper: Sentinel-2 image (pre-fire); Sentinel image (post-fire). Lower: dNBR; dNBR (range).
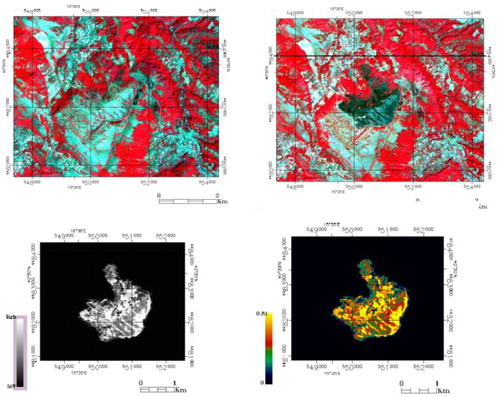
Fire severities assigned by dNBR values agree with field observations of events severity obtained using the field protocol described in the Fire Monitoring Handbook (USDI National Park Service Citation2003). The mean value of dNBR shows significant differences among the four investigated sites.
In fact, Stigliano fire shows the highest average value (0.52) followed by Rifreddo (0.41) and Miglionico fire (0.35) while Brienza fire has the lowest value (0.29).
The differences between the dNBR average values among the four sites are related to the different fire behaviour due to fuel type, as well as to specific morphological (i.e. slope) and meteorological (i.e. wind) conditions. These results indicate in substance that, among considered events, the highest effects of soil heating were found in Stigliano, while in Brienza they were the lowest.
These values are confirmed by analysing how the post-fire surface is distributed in percentage in the fire severity classes for each site ().
Table 4. Burned surface distribution per fire severity class.
It is interesting to analyze which percentage of each site is included in the three higher severity classes. The trend is consistent with the average dNBR values. In confirmation of what was previously stated, Brienza fire is included in the moderate + high + very high fire severity classes with 41% of the burned area, Miglionico with 45%, Rifreddo with 68%, Stigliano with 81%.
4.2. Potential soil loss – RUSLE model
For each fire, two RUSLE-derived potential soil erosion maps, before and after the wildfire event, were obtained for further analysis. The individual RUSLE factors were obtained by applying the methodology described in paragraph 3.2. The maps related to these factors are shown in and .
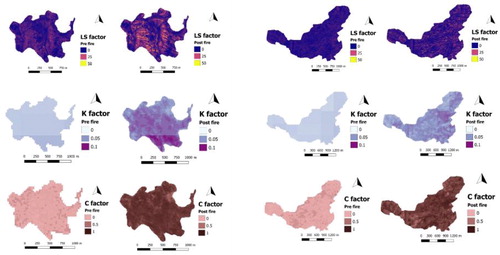
Figure 13. Fire-modified RUSLE factors maps of Brienza (left) and Miglionico (right).
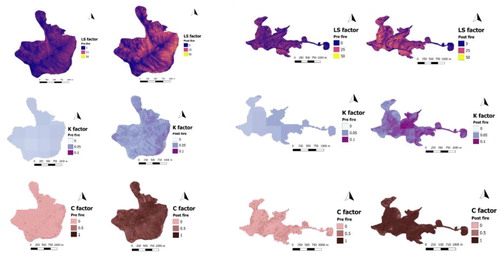
Figure 14. Fire-modified RUSLE factors maps of Stigliano (left) and Rifreddo (right).
In the , the pre and post-fire RUSLE maps are compared for each study area.
Figure 15. Pre-fire (left) and post-fire (right) RUSLE A value. From the top to bottom: Miglionico, Rifreddo, Stigliano, Brienza. Values are expressed in Mg ha−1 yr−1.
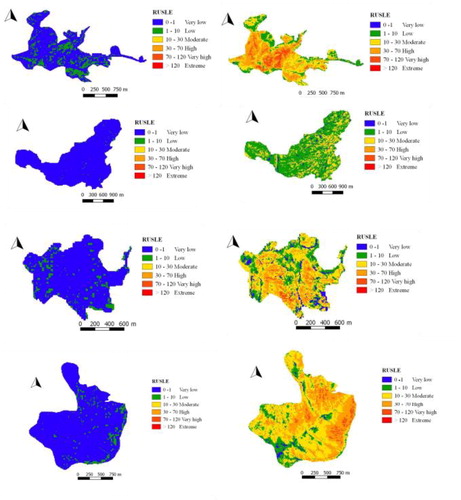
It is immediately evident that wildfire always increases the amount of soil loss, but there are also differences among the sites.
The analysis of the erosion levels distribution on the study areas () shows that the amount of pre-fire estimated soil loss is always less than 10 Mg ha−1yr−1, although it should be noted that our sites areal distribution in the first two classes (0–1 and 1–10) is variable. In particular, it is noted that the Rusle 1–10 pre-fire class is attributed to almost 22% of the Miglionico site area and to less than 1% of the Rifreddo site extension.
Table 5. Pre-fire and post-fire erosion range distribution – RUSLE classes in Mg ha−1yr−1.
In the post-fire analysis it is important to take into account the percentage of burned area attributed to erosion classes greater than 10 Mg ha−1yr−1 for each site. In fact Brienza falls above this threshold with more than 84% of the burned area, Miglionico with 76%, Stigliano with 69% and Rifreddo only with 28%.
Thus, although the fire, according to the model, determines as expected, in all the analyzed cases, an increase in the potential soil loss, this increase shows different trends in the various sites. In particular, in Rifreddo case, the effects of fire on the field appear, on the basis of the data, considerably less severe than the other sites.
Soil losses estimated values per year before and after fire () reflect the different size of the four fires. Calculating the average RUSLE soil loss per hectare pre and post-fire (), Miglionico site shows the highest values both pre and post-fire soil erosion, even though the greatest increase is found in Brienza site.
Table 6. Estimated soil losses per year for the studied sites before and after fire (1st year).
Table 7. Average RUSLE A pre-fire and first year post-fire.
In any case, the mutual positions of the four sites remain unchanged in the post-fire compared to the pre-fire. In fact, the average pre-fire values ranges from a minimum of 0.1504 Mg ha−1yr−1 (Rifreddo), to a maximum of 0.5494 Mg ha−1yr−1 (Miglionico), in accordance with the values found in other studies in forest areas (e.g. Miller et al. Citation2003; Mancino et al. Citation2016), as well as the average post-fire predicted values ranging from a minimum of 8.636 Mg ha−1yr−1 (Rifreddo) to a maximum of 31.476 Mg ha−1yr−1 (Miglionico). Maximum pre-fire erosion rates range from 2.53 Mg ha−1yr−1 (Rifreddo) and 7.9 Mg ha−1yr−1 (Brienza). The maximum predicted erosion in the first year post-fire ranges between 84.5 Mg ha−1yr−1 (Rifreddo) and 160 Mg ha−1yr−1 (Miglionico) ().
However, by comparing for all sites, the average post-fire RUSLE for all fire severity classes with the average post-fire RUSLE estimated considering only the class ‘High’ of fire severity (), results show that the fire severity acts in different ways in relation to the site, so that, on Miglionico the average soil potential erosion in fire severity class ‘High’ increases by 115% compared to the general average at the same site, on Brienza by 94%, on Rifreddo by 34% and on Stigliano by 15%.
Table 9. Comparison between average post-fire RUSLE for all severity classes and average post-fire RUSLE A for fire severity class ‘High’.
Furthermore, the linear regression analysis between RUSLE post-fire erosion estimates and dNBR () confirms these results. The Explained Sum of Squares (Linear Coefficient of Determination or R2) was equal to 0.568 (Miglionico), 0.208 (Brienza), 0.178 (Stigliano), 0.069 (Rifreddo).
Figure 16. dRUSLE-dNBR linear regression analysis. dRUSLE (Mg ha−1 yr−1) is the difference between RUSLE A post-fire and RUSLE A pre-fire.
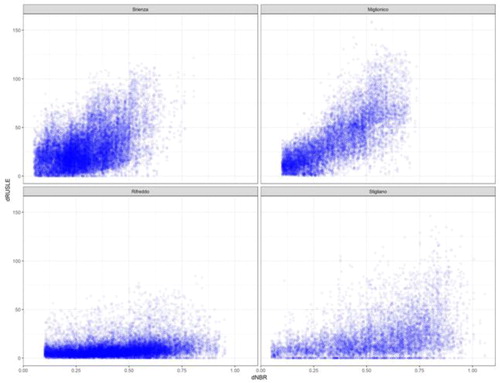
Analyzing and synthesizing site by site, Brienza has the lowest mean dNBR (0.29) and also the lowest percentage of surface included in the three higher fire severity classes (41%). However, Brienza has the highest percentage of potential soil loss in the highest RUSLE classes (84% of the burned area is affected by soil erosion greater than 10 Mg ha−1yr−1) and it is ranked after Miglionico considering the average soil loss per hectare per year (both in pre-fire and in post-fire) and the linear relationship between dNBR and RUSLE post-fire. Therefore, here fire effects are correlated to a substantial increase of soil erosion, higher than in the other sites (), despite a lower fire severity on average. However, in the Brienza site, soil erosion (both pre-fire and post-fire) is strongly dependent on the Rainfall Erosivity factor R (fire-independent) that in this area is averagely higher than in the others sites. Furthermore, in the case of Brienza, post-fire erosion values are also justified by the decisive increase that the fire event causes on the topographic factor LS ().
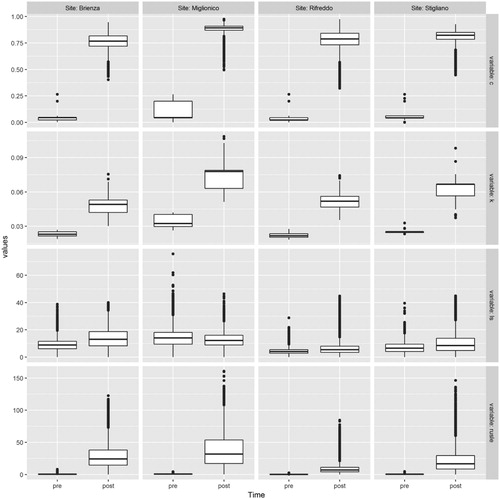
Figure 17. Data distribution for C, K, LS and pre- and post-fire RUSLE-estimated erosion (Mg ha−1 yr−1) for each site. The bottom, the centre and the top of the boxplots represent, respectively, the first, the second and the third quartile of the data distribution. The whiskers extend 1.5 times the interquartile range (IQR).
Opposite considerations can be made in the case of Rifreddo, where the average dNBR is higher than Brienza and Miglionico and also the percentage of surface included in the three higher fire severity classes is higher than Brienza and Miglionico. However, here only the 28% of the burned area is affected by soil erosion greater than 10 Mg ha−1yr−1, the lowest of all sites. This result is influenced by the lower relevance of the R factor (the lowest), but also by the lower weight of factors modified by the fire, in particular LS.
Jointly analyzing the two sites of Stigliano and Miglionico that show average values of the R factor very close to each other, it appears that the average dNBR (0.52 vs 0.35) and also the percentage of surface included in the three higher fire severity classes (81% vs 45%) is higher for Stigliano than Miglionico. However, Miglionico shows the mean RUSLE estimate of erosion (pre and post-fire) and also the percentage of potential soil loss in the highest RUSLE classes (>10 Mg ha−1yr−1), higher than Stigliano.
At this point the comparison of the post-fire estimated erosion rate values related to Miglionico and Stigliano, with the same dNBR class, seems opportune. The calculation performed on pixels with a ‘High’ severity class indicates that in this class the amount of soil loss in Miglionico is almost three times that of Stigliano (). Thus, with the same rain energy, the fire can have a different impact on soil erosion in relation to the site: in particular the Miglionico fire affects both the K and the C factors to a greater extent than Stigliano ().
This analysis leads to some implications. First, the initial conditions are important: the comparison between the four cases analysed shows that soils with lower susceptibility to erosion continue to maintain this characteristic even after fire. Fire always results in an increase in the RUSLE values and the amount of soil loss always increases with the increase of fire severity, but with different trends in relation to the susceptibility of the site to the erosion. The fire seems to have greater effects where initial conditions identify a greater predisposition to soil erosion (Brienza and Miglionico). However, fire also seems to have the ability to ‘select’ the parameters that determine an increase in soil erosion in relation to the characteristics of the specific site. In fact, with very similar R factor values (not fire-affected) and comparing the same dNBR classes (i.e. Miglionico vs Stigliano), we have found different values of potential soil erosion that in the specific case can be attributed to the following reasons:
natural predisposition to greater soil erosion of Miglionico compared to Stigliano site, related to soil, vegetation cover and topographic characteristics;
greater impact of fire on the K factor at the Miglionico site compared to Stigliano in relation to the different characteristics of the soil on which the fire acts;
greater impact of fire on the C factor at the Miglionico site compared to Stigliano in relation to the differences in the vegetation cover type as well as possibly other parameters (surface roughness and soil moisture): therefore the vegetation effects on erosion vary depending on the site.
5. Conclusions
The relevance of fire in increasing sediment detachment and transport is known. Many authors have also investigated the relationships between fire severity and soil loss. For this purpose, the use of erosion estimation models such as USLE and RUSLE, originally developed for applications in the agricultural sector, have proved to be useful and effective also in other ecosystems types. In this study, the integration of the RUSLE model with remote sensing and GIS, aims to verify the potential for post-fire soil erosion risk forecasting in the Basilicata region, an area very prone to soil erosion, due to its geological and climatic characteristics, but also with a high fire susceptibility. In relation to the high geological, geomorphological and vegetational variability, four study sites were compared. First of all, final results show that the pre-fire soil loss amount undergoes a considerable increase after fire, but also that fire has a different impact on the soil loss in relation to the specific site properties (from a geological, geomorphological and vegetational point of view). Further work is underway in validating RUSLE outputs as well as in deepening the knowledge of all the relationships between topography, land cover, soil properties and burning severity parameters as a function of post-fire soil erosion risk assessment.
Disclosure statement
No potential conflict of interest was reported by the authors.
Related Research Data
References
- Agancy ES. 2015. Sentinel-2 MSI: overview. https://sentinel.esa.int/documents/247904/685211/Sentinel-2_User_Handbook. Last Accessed February 19, 2019.
- Badía D, Martí C. 2000. Seeding and mulching treatments as conservation measures of two burned soils in the central Ebro valley, NE Spain. Arid Soil Res Rehabil. 13:219–232.
- Ballais JL. 1993. L'érosion consecutive a l'incendie d'août 1989 sur la Montagne Sainte-Victoire: trois années d'observation (1989–1992). BAGF. 70(5):423–437.
- Béguin E. 1992. Erosion mécanique après l'incendie de forêt du Massif des Maures de 1990: exemple du bassin versant de Rimbaud. Mémoire de Diplome D'Etudes Approfondies. Université Aix-Marseille I, 40 p.
- Benavides-Solorio JD, MacDonald LH. 2005. Measurement and prediction of post-fire erosion at the hillslope scale, Colorado Front Range. Int J Wildland Fire. 14(4):457–474.
- Bezdek JC. 1981. Pattern recognition with fuzzy objective function algorithms. New York (NY): Plenum Press.
- Biswas SS, Pani P. 2015. Estimation of soil erosion using RUSLE and GIS techniques: a case study of Barakar river basin, Jharkhand, India. Model. Earth Syst. Environ. 1:1–13.
- Blake WH, Theocharopoulos SP, Skoulikidis N, Clark P, Tountas P, Hartley R, Amaxidis Y. 2010. Wildfire impacts on hillslope sediment and phosphorus yields. J Soils Sediments. 10(4):671–682.
- Borrelli P, Märker M, Panagos P, Schütt B. 2014. Modeling soil erosion and river sediment yield for an intermountain drainage basin of the Central Apennines, Italy. Catena. 114:45–58.
- Bowman DMJS, Balch J, Artaxo P, Bond WJ, Cochrane MA, D’Antonio CM, Defries R, Johnston FH, Keeley JE, Krawchuk ME, et al. 2011. The human dimension of fire regimes on Earth. Journal of Biogeography. 38:2223–2236.
- Calcaterra D, Parise M, Strumia S, Mazzella E. 2007. Relations between fire, vegetation and landslides in the heavily populated metropolitan area of Naples, Italy. Proceedings 1st North American Landslides Conference; Vail (Colorado): AEG Special Publication 23. p. 1448–1461.
- Cannon SH, Gartner JE. 2005. Wildfire-related debris flow from a hazards perspective. In: Hung O, Jakob M, editors. Debris-flow hazards and related phenomena. Chichester (UK): Springer-Praxis Books in Geophysical Sciences; p. 321–344.
- Cannon SH, Gartner JE, Wilson RC, Bowers JC, Laber JL. 2008. Storm rainfall conditions for floods and debris flows for recently burned areas in southwestern Colorado and southern California. Geomorphology. 96(3–4):250–269.
- Cavalcante F, Belviso C, Bentivenga M, Fiore S, Prosser G. 2011. Occurence of palygorskite and sepiolite in upper Paleocene – middle Eocene marine deep sediments of the Lagonegro basin (Southern Apennines – Italy): paleoenvironmental and provenante inferences. Sediment Geol. 233(1–4):42–52.
- Cebecauer T, Šúri M, Hofierka J, Fulajtár E. 2004. CORINE land cover in the context of soil erosion assessment at a regional scale. In: Mohaupt-Jahr B, Keil M, Kiefl R, editors. CORINE LAND COVER 2000 in Germany and Europe and its use for environmental applications, 20–21 January. Berlin (Germany): Umweltbundesamt; p. 74–80.
- Certini G. 2005. Effects of fire on properties of forest soils: a review. Oecologia. 143(1):1–10.
- Chander G, Markham BL. 2003. Revised Landsat-5 TM radiometric calibration procedures, and post-calibration dynamic ranges. IEEE Trans Geosci Remote Sens. 41(11):2674–2677.
- Chander G, Markham BL, Barsi JA. 2007. Revised Landsat5 thematic mapper radiometric calibration. IEEE Trans Geosci Remote Sens Lett. 44:490–494.
- Chander G, Markham B, Helder DL. 2009. Summary of current radiometric calibration coefficients for Landsat MSS, TM, ETM+, and EO-1 ALI sensors. Remote Sens Environ. 113(5):893–903.
- Chergui B, Fahd S, Santos X, Pausas JG. 2018. Socioeconomics drive fire-regime variability in the Mediterranean Basin. Ecosystems 21(4):619–628.
- Claessens L, Van Breugel P, Notenbaert A, Herrero M, Van De Steeg J. 2008. Mapping potential soil erosion in east Africa using the universal soil loss equation and secondary data. IAHS Publ. 325:398–407.
- Cocke AE, Fulé PZ, Crouse JE. 2005. Comparison of burn severity assessments using Differenced Normalized Burn Ratio and ground data. Int J Wildland Fire. 14(2):189–198.
- Coelho COA, Ferreira AJD, Boulet AK, Keizer JJ. 2004. Overland flow generation processes, erosion yields and solute loss following different intensity fires. Q J Eng Geol Hydrogeol. 37(3):233–240.
- Collins BM, Miller JD, Thode AE, Kelly M, van Wagtendonk JW, Stephens SL. 2009. Interactions among wildland fires in a long-established Sierra Nevada natural fire area. Ecosystems. 12(1):114–128.
- Collins BM, Stephens SL. 2010. Stand-replacing patches within a ‘mixed severity’ fire regime: quantitative characterization using recent fires in a long-established natural fire area. Landscape Ecol. 25(6):927–939.
- Curran MP, Chapman B, Hope GD, Scott D. 2006. Large scale erosion and flooding after wildfires: understanding the soil conditions. Victoria (BC): Ministry of Forests and Range, Research Branch. Technical Report 030.
- Debano LF, Neary DG, Folliott PF. 1998. Fire’s effects on ecosystems. New York (NY): John Wiley & Sons, Inc.; p. 333.
- Doerr SH, Woods SW, Martin DA, Casimiro M. 2009. Natural background” soil water repellency in conifer forests of the north-western USA: its prediction and relationship to wildfire occurrence. J Hydrol. 371(1–4):12–21.
- Drusch M, Del Bello U, Carlier S, Colin O, Fernandez V, Gascon F, Hoersch B, Isola C, Laberinti P, Martimort P, et al. 2012. Sentinel-2: ESA’s optical high-resolution mission for GMES operational services. Remote Sens Environ. 120:25–36.
- Epting J, Verbyla D, Sorbel B. 2005. Evaluation of remotely sensed indices for assessing burn severity in interior Alaska using Landsat TM and ETM+. Remote Sens Environ. 96(3–4):328–339.
- Escuin S, Navarro R, Fernandez P. 2008. Fire severity assessment by using NBR (normalized burn ratio) and NDVI (normalized difference vegetation index) derived from LANDSAT TM/ETM images. Int J Remote Sens. 29(4):1053–1073.
- Esposito G, Matano F, Molisso F, Ruoppolo G, Di Benedetto A, Sacchi M. 2017. Post-fire erosion response in a watershed mantled by volcaniclastic deposits, Sarno Mountains, Southern Italy. Catena. 152:227–241.
- FAO 2015. Global forest resources assessment 2015. Rome (Italy): Food and Agriculture Organization. FAO Forestry Paper No. 1.
- Farhan Y, Nawaiseh S. 2015. Spatial assessment of soil erosion risk using RUSLE and GIS techniques. Environ Earth Sci. 74(6):4649–4669.
- Fernández C, Vega JA. 2016. Modelling the effect of soil burn severity on soil erosion at hillslope scale in the first year following wildfire in NW Spain. Earth Surf Process Landforms. 41(7):928–935.
- Fernandez C, Vega JA, Vieira DCS. 2010. Assessing soil erosion after fire and rehabilitation treatments in NW Spain: performance of RUSLE and revised Morgan–Morgan–Finney models. Land Degrad Dev. 21:74–87.
- Foster GR, Meyer LD, Onstad CA. 1977. A runoff erosivity factor and variable slope length exponents for soil loss estimates. Trans Am Soc Agric Eng. 20(4):683–687.
- Foster GR, Toy TE, Renard KG. 2003. Comparison of the USLE, RUSLE1.06c, and RUSLE2 for application to highly disturbed lands. Proceedings of the First Interagency Conference on Research in the Watersheds, Benson, Arizona; Oct 27–30. Washington, DC: USDA - Agricultural Research Service; p. 154–160.
- Fox DM, Darboux F, Carrega P. 2007. Effects of fire-induced water repellency on soil aggregate stability, splash erosion and saturated hydraulic conductivity for different size fractions. Hydrol Process. 21(17):2377–2238.
- Fu BJ, Zhao WW, Chen LD, Zhang QJ, Lu YH, Gulinck H, Poesen J. 2005. Assessment of soil erosion at large watershed scale using RUSLE and GIS: a case study in the Loess Plateau of China. Land Degrad Dev. 16(1):73–85.
- García-Ruiz JM. 2010. The effects of land uses on soil erosion in Spain: a review. Catena. 81(1):1–11.
- García-Ruiz JM, Nadal-Romero E, Lana-Renault N, Beguería S. 2013. Erosion in Mediterranean landscapes: changes and future challenges. Geomorphology. 198:20–36.
- Gimeno-García E, Andreu V, Rubio JL. 2007. Influence of vegetation recovery on water erosion at short and medium-term after experimental fires in a Mediterranean shrubland. Catena. 69(2):150–160.
- Giovannini G, Vallejo R, Lucchesi S, Bautista S, Ciompi S, Llovet J. 2001. Effects of land use and eventual fire on soil erodibility in dry Mediterranean conditions. Forest Ecol Manage. 147(1):15–23.
- González-Bonorino G, Osterkamp WR. 2004. Applying RUSLE 2.0 on burned-forest lands: an appraisal. J Soil Water Conserv. 59(1):36–42.
- Grimm M, Jones RJA, Rusco E, Montanarella L. 2003. Soil erosion risk in Italy: a revised USLE approach. Luxembourg (Europe): Office for Official Publications of the European Communities. European Soil Bureau Research Report No. 11, EUR 20677 EN; p. 26.
- Hagolle O, Sylvia S, Mireille H, Martin C, Dominique C, Cécile D, Vincent L, Vincent P. 2015. SPOT-4 (Take 5): simulation of sentinel-2 time series on 45 large sites. Remote Sens. 7(9):12242–12264.
- Hartigan JA, Wong MA. 1979. Algorithm AS 136: a K-means clustering algorithm. Appl Stat. 28(1):100–108.
- Holden ZA, Evans JS. 2010. Clustering burn severity data using the Landsat-derived dNBR, local autocorrelation statistics and a fuzzy C-means clustering algorithm. Int J Wildland Fire. 19(7):853–860.
- Huete AR. 1988. A soil-adjusted vegetation index (SAVI). Remote Sens Environ. 25(3):295–309.
- Hungerford RD. 1996. Soils - fire in ecosystem management notes: unit II-I. Marana (AZ): U.S. Department of Agriculture, Forest Service, National Advanced Resource Technology Center.
- Karamage F, Shao H, Chen X, Ndayisaba F, Nahayo L, Kayiranga A, Omifolaji JK, Liu T, Zhang C. 2016. Deforestation effects on soil erosion in the Lake Kivu Basin, D.R. Congo-Rwanda. Forests. 7(12):281.
- Key CH, Benson NC. 2006. Landscape assessment: Sampling and analysis methods: Firemon: Fire effects monitoring and inventory system. General Technical Report. USDA Forest Service, Rocky Mountain Research Station, Fort Collins CO., RMRS-GTR-164-CD
- Key CH, Benson NC. 2006. Landscape assessment (LA) sampling and analysis methods. USDA Forest Service General Technical Report, RMRS-GTR-164-CD.
- Kuo KT, Sekiyama A, Mihara M. 2016. Determining C factor of universal soil loss equation (USLE) based on remote sensing. International Journal of Environmental and Rural Development . 7–2.
- Kuo KT, Sekiyama A, Mihara M. 2016. Determining C factor of universal soil loss equation (USLE) based on remote sensing. Int J Environ Rural Dev. 7–2.
- Lanorte A, Danese M, Lasaponara R, Murgante B. 2013. Multiscale mapping of burn area and severity using multisensor satellite data and spatial autocorrelation analysis. Int J Appl Earth Observ Geoinf. 20:42–51.
- Larsen IJ, MacDonald LH. 2007. Predicting postfire sediment yields at the hillslope scale: testing RUSLE and disturbed WEPP. Water Resour Res. 43:W11412.
- Lasanta T, Cerdà A. 2005. Long-term erosional responses after fire in the Central Spanish Pyrenees 2. Catena. 60(1):81–100.
- Lazzari M, Gioia D, Piccarreta M, Danese M, Lanorte A. 2015. Sediment yield and erosion rate estimation in the mountain catchments of the Camastra artificial reservoir (Southern Italy): a comparison between different empirical methods. Catena. 127:323–339.
- Lee S. 2004. Soil erosion assessment and its verification using the universal soil loss equation and geographic information system: a case study at Boun, Korea. Environ Geol. 45(4):457–465.
- Lin C, Lin W, Chou W. 2002. Soil erosion prediction and sediment yield estimation, the Taiwan experience. Soil Tillage Res. 68:143–152.
- Lourenço L, Bento-Gonçalves A, Vieira A, Nunes A, Ferreira-Leite F. 2012. Forest fires in Portugal. In: Bento-Gonçalves A, Vieira A, editors. Portugal: economic, political and social issues. New York (NY): Nova Science Publishers; p. 97–111.
- Lufafa A, Tenywa MM, Isabirye M, Majaliwa MJG, Woomer PL. 2003. Prediction of soil erosion in a Lake Victoria basin catchment using a GIS-based universal soil loss model. Agric Syst. 76(3):883–894.
- Mancino G, Nolè A, Salvati L, Ferrara A. 2016. In-between forest expansion and cropland decline: a revised USLE model for soil erosion risk under land-use change in a Mediterranean region. Ecol Indicat. 71:544–550.
- Martin C, Bernard-Allee P, Béguin E, Levant M, Quillard J. 1993. Conséquences de l'incendie de forêt de l'été 1990 sur l'érosion mécanique des sols dans le massif des Maure. Bull Assoc Geogr Fr. 70(5):438–447.
- Mataix-Solera J, Cerdà A. 2009. Incendios forestales en España. Ecosistemas terrestres y suelos. In: Cerdà A, Mataix-Solera J, editors. Efectos de los incendios forestales sobre los suelos en España. El estado de la cuestión visto por los científicos españoles. Valencia (Spain): Càtedra de Divulgació de la Ciència, Universitat de Valencia; p. 25–53.
- Miller JD, Nyhan JW, Yool SR. 2003. Modeling potential erosion due to the Cerro Grande fire with a GIS-based implementation of the revised universal soil loss equation. Int J Wildland Fire. 12(1):85–100.
- Mitasova H, Hofierka J, Zlocha M, Iverson LR. 1996. Modeling topographic potential for erosion and deposition using GIS. Int J Geogr Inf Syst. 10(5):629–641.
- Moody JA, Martin DA, Cannon SA. 2008. Post-wildfire erosion response in two geologic terrains in the western USA. Geomorphology. 95(3–4):103–118.
- Moody JA, Martin DA. 2001. Initial hydrologic and geomorphic response following a wildfire in the Colorado Front Range. Earth Surf Process Landforms. 26(10):1049–1070.
- Moody JA, Shakesby RA, Cannon SA, Robichaud PR, Martin DA. 2013. Current research issues related to post-wildfire runoff and erosion processes. Earth Sci Rev. 122:10–37.
- Myronidis DI, Emmanouloudis DA, Mitsopoulos IA, Riggos EE. 2010. Soil erosion potential after fire and rehabilitation treatments in Greece. Environ Model Assess. 15:239–250.
- Nasiri M. 2013. GIS modelling for locating the risk zone of soil erosion in a deciduous forest. J Forest Sci. 59(No. 2):87–91.
- Neris J, Santamarta JC, Doerr SH, Prieto F, Agulló-Pérez J, García-Villegas P. 2016. Post-fire soil hydrology, water erosion and restoration strategies in Andosols: a review of evidence from the Canary Islands (Spain). iForest. 9(4):583–592.
- Nowakowski T. 2015. Arianespace successfully launches Europe ’s Sentinel-2A earth observation satellite. In Spaceflight insider. https://www.spaceflightinsider.com/missions/earth-science/arianespace-successfully-launches-europes-sentinel-2a-earth-observation-satellite/. Last Accessed February 19, 2019.
- Nyman P, Sheridan GJ, Smith HG, Lane PNJ. 2011. Evidence of debris flow occurrence after wildfire in upland catchments of south-east Australia. Geomorphology. 125(3):383–401.
- Odeh IOA, McBratney AB, Chittleborough DJ. 1992. Soil pattern recognition with fuzzy-c-means: applications to classification and soil-landform interrelationships. Soil Sci Soc Am J. 56(2):505–516.
- Panagos P, Meusburger K, Ballabio C, Borrelli P, Alewell C. 2014. Soil erodibility in Europe: a high-resolution dataset based on LUCAS. Sci Total Environ. 479-480(2014):189–200.
- Panagos P, Ballabio C, Borrelli P, Meusburger K, Klik A, Rousseva S, Tadić MP, Michaelides S, Hrabalíková M, Olsen P, et al. 2015. Rainfall erosivity in Europe. Sci Total Environ. 511:801–814.
- Panagos P, Borrelli P, Meusburger K. 2015. A new European slope length and steepness factor (LS-Factor) for modeling soil erosion by water. Geosciences. 5(2):117–126.
- Panagos P, Borrelli P, Meusburger K, Alewell C, Lugato E, Montanarella L. 2015. Estimating the soil erosion cover-management factor at the European scale. Land Use Pol. 48(2015):38–50.
- Parise M, Cannon SH. 2012. Wildfire impacts on the processes that generate debris flows in burned watersheds. Nat Hazards. 6:217–227.
- Parsons A, Robichaud PR, Lewis SA, Napper C, Clark JT. 2010. Field guide for mapping post-fire soil burn severity. Fort Collins, (CO): USDA Forest Service, Rocky Mountain Research Station. General Technical Report RMRS-GTR-243.
- Pausas JG, Fernandez-Muñoz S. 2012. Fire regime changes in the Western Mediterranean Basin: from fuel-limited to drought-driven fire regime. Clim Change. 110(1-2):215–226.
- Pausas JG, Llovet J, Rodrigo A, Vallejo R. 2008. Are wildfires a disaster in the Mediterranean basin? Int J Wildland Fire. 17(6):713–723.
- Pausas JG, Paula S. 2012. Fuel shapes the fire–climate relationship: evidence from Mediterranean ecosystems. Global Ecol Biogeogr. 21(11):1074–1082.
- Piccarreta M, Capolongo D, Miccoli MN, Bentivenga M. 2012. Global change and long-term gully sediment production dynamics in Basilicata, southern Italy. Environ Earth Sci. 67:1619.
- Piedilato S, Prosser G. 2005. Thrust sequences and evolution of the external sector of a fold and thrust belt: example from the Southern Apennines (Italy). J Geodyn. 39(4):386–402.
- Renard KG, Foster GR, Weesies GA, McCool DK, Yoder DC. 1997. Predicting soil erosion by water: a guide to conservation planning with the revised universal soil loss equation (RUSLE). Agriculture Handbook No.703. Washington, DC: U.S. Department of Agriculture Research Service; p. 348.
- Renard KG, Foster GR, Weesies GA, Porter JP. 1991. RUSLE: revised universal soil loss equation. J Soil Water Conserv. 46:30–33.
- Riaño D, Chuvieco E, Salas J, Palacios-Orueta A, Bastarrika A. 2002. Generation of fuel type maps from Landsat TM images and ancillary data in Mediterranean ecosystems. Can J Forest Res. 32(8):1301–1315.
- Riley KL, Bendick R, Hyde KD, Gabet EJ. 2013. Frequency‐magnitude distribution of debris flows compiled from global data, and comparison with post‐fire debris flows in the western U.S. Geomorphology. 191:118–128.
- Robichaud PR, Ashmun LE, Sims BD. 2010. Post-fire treatment effectiveness for hillslope stabilization. Fort Collins (CO): U.S. Department of Agriculture, Forest Service, Rocky Mountain Research Station. Gen. Tech. Rep. RMRS-GTR-240; p. 62.
- Robichaud PR, Beyers JL, Neary DG. 2000. Evaluating the effectiveness of postfire rehabilitation treatments. Fort Collins (CO): U.S. Department of Agriculture, Forest Service, Rocky Mountain Research Station. Gen. Tech. Rep. RMRS-GTR-63; p. 85.
- Roubens M. 1982. Fuzzy clustering algorithms and their cluster validity. Eur J Oper Res. 10(3):294–301.
- Roy DP, Boschetti L, Trigg SN. 2006. Remote sensing of fire severity: assessing the performance of the Normalized Burn Ratio. IEEE Geosci Remote Sens Lett. 3(1):112–116.
- Rulli MC, Offeddu L, Santini M. 2013. Modeling post-fire water erosion mitigation strategies. Hydrol Earth Syst Sci. 17(6):2323–2337.
- Safford HD, Miller J, Schmidt D, Roath B, Parsons A. 2008. BAER soil burn severity maps do not measure fire effects to vegetation. A comment on Odion and Hanson (2006). Ecosystems. 11(1):1–11.
- Salvati L, De Angelis A, Bajocco S, Ferrara A, Barone PM. 2013. Desertification risk, long-term land-use changes and environmental resilience: a case study in Basilicata, Italy. Scot Geogr J. 129(2):85–99.
- Santi PM, Morandi L. 2013. Comparison of debris-flow volumes from burned and unburned areas. Landslides. 10(6):757–769.
- Segl K, Guanter L, Gascon F, Kuester T, Rogass C, Mielke C. 2015. S2eteS: an end-to-end modeling tool for the simulation of Sentinel-2 image products. IEEE Trans Geosci Remote Sens. 53(10):5560–5571.
- Shakesby RA. 2011. Post-wildfire soil erosion in the Mediterranean: review and future research directions. Earth Sci Rev. 105(3–4):71–100.
- Shakesby RA, Doerr SH. 2006. Wildfire as a hydrological and geomorphological agent. Earth Sci Rev. 74(3–4):269–307.
- Shimabukuro YE, Smith A. 1991. The least-squares mixing models to generate fraction images derived from remote sensing multispectral data. IEEE Trans Geosci Remote Sens. 29(1):16–20.
- Sorrentino G, 2001. Indagine regionale sulla stima dell'aggressività della pioggia nello studio dell'erosione idrica [Thesis]. Cosenza (Italy): Università degli Studi della Calabria, Facoltà di Ingegneria; p. 22.
- Tan B, Masek JG, Wolfe R, Gao F, Huang C, Vermote EF, Sexton JO, Ederer G. 2013. Improved forest change detection with terrain illumination corrected Landsat images. Remote Sens Environ. 136:469–483.
- Teillet PM, Guindon B, Goodenough DG. 1982. On the slope-aspect correction of multispectral scanner data. Can J Remote Sens. 8(2):84–106.
- Terranova O, Antronico L, Coscarelli R, Iaquinta P. 2009. Soil erosion risk scenarios in the Mediterranean environment using RUSLE and GIS: an application model for Calabria (southern Italy). Geomorphology. 112(3–4):228–245.
- USDI National Park Service 2003. Fire monitoring handbook. Boise (ID): Fire Management Program Center, National Interagency Fire Center; p. 1–274.
- USGS2015. Landsat missions, Landsat 8 (L8) data users handbook. http://landsat.usgs.gov. Last Accessed February 19,2019.
- Van der Knijff JM, Jones RJA, Montanarella L. 1999. Soil Erosion Risk in Italy. EUR19022 EN, Office for Official Publications of the European Communities, Luxembourg, 54.
- Van der Knijff JM, Jones RJA, Montanarella L. 2000. Soil erosion risk assessment in Europe. Luxembourg (Europe): Office for Official Publications of the European Communities. EUR 19044 EN.
- Van der Knijff J, Jones RJA, Montanarella L. 2002. Soil erosion risk assessment in Italy. In: Rubio JL, Morgan RPC, Asins S, Andreu V, editors. Proceedings of the third international congress man and soil at the third millennium. Logrono (Spain): Geoforma Ediciones; p. 1903–1913.
- Vatandaşlar C, Yavuz M. 2017. Modeling cover management factor of RUSLE using very high-resolution satellite imagery in a semiarid watershed. Environ Earth Sci. 76(2):267.
- Wischmeier WH, Smith DD. 1978. Predicting rainfall erosion losses - a guide for conservation planning. Hyattsville (MD): U.S. Department of Agriculture, Agriculture Handbook No 537; p. 58.