
Abstract
The earthquake is one of the most devastating natural hazards that most of the Iranian cities. District 9 of Tehran will be vulnerable due to old residential texture, proximity to North Tehran fault and industrial land use in case of earthquake. Therefore, reducing the vulnerability to this natural disaster is one of the main goals of this study. In the present research, to evaluate vulnerability due to earthquake hazard, 10 indices are studied as effective factors in cities buildings vulnerability. These factors are selected on the basis of indices in previous studies. Indices involving materials type, type of facade building density, the age of building, the number of floors, ground area of buildings, compatibility of adjacent users, distance from the fault, geology formation and width of passageways are analyzed by using computational method of ANP scored by experts. The criteria weight is applied in effective layers in vulnerability. At last, by integrating the layers in GIS environments, general vulnerability map is extracted in the area. In order to evaluate the buildings vulnerability against earthquake, data obtained and from ANP analysis were made fuzzy. Finally, vulnerability map in district 9 of Tehran against earthquake was extracted. The research results show that if earthquake occurs, in district 9 of Tehran, 19.46% and 10.69% of buildings respectively have trivial and low vulnerability, while 50.29 percent of buildings have medium vulnerability. Also, 17.62% and 1.91% of building have high and very high vulnerability respectively, or they are completely damaged.
1. Introduction
Among natural disasters, earthquake is usually the most common and the most destructive natural hazard (Mohammadi and Nazarpour Citation2016; Ardekani et al. Citation2017; Zebardast Citation2013), and its occurrence mostly causes economical losses and death (Ibrion et al. Citation2015; Janalipour et al. Citation2015; Moradi et al. Citation2015). According to statistics published by United Nation Commission from 1970 to 2014, 173 dangerous and natural disasters occurred in Iran, and the most destructive one is related to earthquake. In the occurred earthquakes, 91,912 persons died, and totally Iran tolerated economical losses as 22,791 million dollars. The main factors of increasing losses due to earthquake are increasing the population density, the city located near to the fault and lack of alarm systems (Frigerio et al. Citation2016; Gu et al. Citation2015; Park et al. Citation2016), wide infrastructures, the buildings made near incompatible users, lack of following building standards and increasing urbanism without programming (Armas Citation2012; Movahed et al. Citation2012; Pourmosavi et al. Citation2012), and due to these factors, resources whose reproductions lasts very much are lost (Patterson et al. Citation2010; Aliabadi et al. Citation2015) Also, in addition to buildings destruction and damage of important urban infrastructures, earthquake covers a complex chain of complex disaster like fire, landslide, flood, contagious disease and social frustration, and it finally results in catastrophic disasters. In such circumstances, emergency management of earthquake is necessary to decrease dangers and disasters (Zhang et al. Citation2018). The fact is that when earthquake, as a natural phenomenon, occurs, it does not necessarily have unpleasant and undesirable results. Damages and harmful outcomes resulting from lack of preparation to confront with this phenomenon cause some disasters (Hashemi et al. Citation2014, p. 22). Measuring vulnerability is a valuable and complex attempt to focus on resources in vulnerable regions (Armas et al. Citation2016). Hence, evaluating the effects of earthquake, before its occurrence, is a crucial step for making decisions and emergency reaction that are effective for urban vulnerability (Parnell Citation2016; Moya et al. Citation2018). In this regard, programming for reducing damages and losses, due to earthquake, without evaluation of vulnerability is not possible. Evaluation of vulnerability against earthquake requires estimation of losses and damages in the present conditions of a city along with assumption of a big earthquake occurrence, and it should be considered that which area has damages, and degree of damages should be taken into account. The amount of losses and damages in buildings and human fatality are factors clarifying the necessity of preparation for taking actions against disasters and programming to improve and develop this program. Evaluation of disasters hazard not only clarifies the importance of disasters prevention and awareness but also organizes urban programming to decrease the losses and damages caused by earthquake.
Zhang et al. (Citation2018) carried out a research entitled a model based on a scenario to evaluate effectiveness of emergency management of earthquake. This study confirms a scenario-based model to evaluate efficiency and effectiveness of emergency management of earthquake. This model devises key elements of emergency management of earthquake, and simulates possible scenes of earthquake. It is evaluated on according to the real situation. It shows that scenario-based model can be used for propagation of earthquake development procedure, and it detects the key factors that can effectively reduce the losses caused by earthquake. Then it helps policy makers to understand earthquake disaster considerably. Ahmed and Morita (Citation2018), in a research, analyzed vulnerability of residential structures in two parts of Dhaka city. Boukri et al. (Citation2018) evaluated seismic vulnerability in urban scale (Algeria buildings). The results reported in this study are decisions made by local authorities with special environmental-social conditions in large urban scale. For this purpose, this study suggests a list of operational actions playing role in reducing seismic risk. Ranjbar and Nekooie (Citation2018), in a research, proposed TOPSYS fuzzy method to detect the buildings exposed to earthquake hazard. Although much studies and programming are performed, considering the important issue like earthquake still has great importance. Firstly, although preventive actions are taken to contrast with earthquake crisis in the country, the news related to recent earthquakes demonstrates that there are no appropriate programming and timely coordination in various procedures of crisis control. Secondly, earthquake is a natural phenomenon, and human cannot present a reliable method to predict the time, location and its range up to now.
2. Materials and methods
2.1. Case study area
Tehran is the capital of Iran and Tehran Province. With a population of around 9 million in the city and 16 million in the wider metropolitan area, Tehran is the largest city and urban area in Iran, the second-largest city in western Asia, and the third-largest city in the Middle East. It is ranked 29th in the world by the population of its metropolitan area (official website of zone 9 of Tehran municipality, 2016). Tehran city is located between the latitudes of 35 and 36 norths and the longitudes of 50 and 53 easts. Tehran is divided into 22 districts in terms of administrative division (Study of Development Pattern of Zone 9, 2005). The zone 9 of Tehran municipality is an area of approximately 19.8 km2 which holds a population of 158,425 people (Rahmati and Ghanei Bafghi Citation2012). This zone is located in the vicinity of zones 2 and 5 in north, 10 and 17 in east, 18 in south and 21 in west (). This zone has 2 districts and 8 neighbourhoods which exist inside the urban limit.
Figure 1. Location of the study area. (a) Map of Iran; (b) Tehran County; (c) Tehran city; (d) district 9.Source:Manisipulity ofTheran
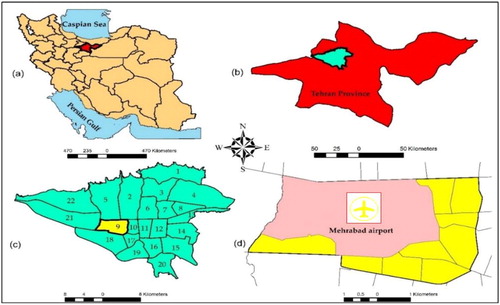
The main reason of earthquake occurrence in Tehran is four main faults including Mosha fault, North Tehran fault, South and North Rey faults. Area 9 of Tehran is located near North Tehran fault and North Rey fault (Feizizadeh et al. Citation2012a). Therefore, due to various faults around Tehran and in Tehran, worn building textures, population aggregation, lack of following standards, vulnerable vital arteries, the focus of all ministries, embassies, the important social and economic centres and unsuitable physical development, Tehran faces with serious danger (JICA Citation2000). In fact, worn textures are obvious features of the area. When we move from Northern areas towards Southern areas, worn building textures and the frequency of smaller building areas are intensified.
2.2. Method
The method type of present research is applied and is analytical descriptive method. The population of research involves 9 district buildings of Tehran municipality. In order to make library information complete to recognize the present situation, studies of municipal communication and information technology organization updated in 2015 are used. ANP method is used to analyze data. The criteria and sub-criteria are weighted by professional experts by using computational method of ANP. The layers effective in buildings vulnerability are integrated in geographical information system on the basis of weights obtained in ANP. Since evaluation criteria in ANP method are presented with different measurement criteria (for example, the width of passageways in meters or the age of building in years), map fuzzation of buildings vulnerability is performed; that is, the criteria importance is defined between 0–1 so that they can be changed to a common scale to evaluate buildings vulnerability. At last, the final vulnerability map in district 9 of Tehran is classified to five classes including very low, low, medium, high and very high vulnerability. In the Present research, AND, GIs and fuzzy tools are used to analyzed data.
3. The factors effective in buildings vulnerability in city
3.1. Type of building materials
Investigation of building materials type means the materials used in buildings of that district. If the materials used in building are durable materials, then vulnerability of that area decreases and vice versa.
3.2. The quality of building
The quality of buildings has crucial importance in area vulnerability against earthquake. The buildings having lower quality are more vulnerable against crisis. If there are more damaged buildings in that area, then the vulnerability of area is higher when earthquake occurs.
3.3. The age of building
The experience obtained in in past earthquakes shows that if the age of buildings is high, then they are more vulnerable against earthquake due exhaustion during the time and using less durable materials in the past. Useful age of buildings in Iran is 30. If there are more buildings whose age is higher than 30, then vulnerability of that area increases against earthquake.
3.4. Type of building facades
The type of building facades is another important index in terms of city vulnerability against earthquake. If there are more building with glass facade than the buildings with stone and bricks, then the vulnerability of buildings increases.
3.5. The number of floors
Buildings show different seismic responses against earthquake on the basis of their height. In multi-storey buildings, the building vibration increases vulnerability. If the percent of multi-storey buildings increases in the area, then vulnerability of that area increases against earthquake due to buildings demolition and blocked passage ways.
3.6. The ground area of building
The ground area of building means underlying floor of buildings. If ground area of buildings has smaller wideness, then they have higher vulnerability and vice versa. If the percent of buildings with larger ground area is higher in the area, then, the area vulnerability decreases.
3.7. Compatibility of adjacent users
The compatibility of adjacent users has important role in the area tolerance against earthquake. Adjacency means locating compatible users next to each other, and separation of incompatible users from each other. If there are higher compatible users in the area, then vulnerability resulting from earthquake decreases in the area.
3.8. Accessing to passages network
The factors involving highways and main roads in the area and making communication with adjacent areas decreases the area vulnerability. Fast transportation network in the area has direct relationship with vulnerability. If there are more main and wide roads in the area, then the vulnerability of that area decreases.
3.9. Distance from the fault
If the area is near the fault or far from the fault, then it influences on the buildings vulnerability against earthquake. If it has less distance from the fault, then the urban buildings vulnerability is higher in against earthquake. This index is measured on the basis of distance.
3.10. Type of geology formation
The type of geology formation determining schematic acceleration and constructed structure has important role in the area vulnerability against earthquake. When there are resistant geology formations against earthquake, the area vulnerability decreases.
4. Results
4.1. Determining the importance of criteria and sub-criteria
In vulnerability evaluation, some criteria are of higher significance than others and play a key role in this Vulnerability (Nazmfar and Beheshti Citation2016). Since the examination of the role and importance of each one of indices and their pairwise comparison and impact of each standard and substandard on those of other indices via ANP method is possible, this method could be adopted as a suitable technique for modelling and evaluation of urban vulnerability to earthquake (Nazmfar and Jafarzadeh Citation2018). Based on this method, each one of sub-criteria in main indices is categorized in a subgroup in line with its significance (Feizizadeh et al. Citation2012a). Like Analytical Hierarchy Process (AHP), measurement of values and relative significance are done in ANP process via pairwise comparison within a range of 1–9 levels (Nazmfar and Roshan Roodi Citation2015). Number 1 indicates the identical significance between the two components while number 9 demonstrates a very high significance of a component compared to another. The former studies carried out domestically and abroad on urban vulnerability to earthquake group cities mostly into five categories in terms of vulnerability. The present research followed suit and grouped the urban buildings into five categories in terms of caused damage degree where scores of sub-criteria in ANP model were grouped as very low vulnerable (number 1), low vulnerable (number 3), average vulnerable (number 5), high vulnerable (number 7), and very high vulnerable (number 9). Every sub-criteria in main criteria is grouped in one of the aforesaid categories based on its level of significance ().
Table 1. Scoring the criteria and sub-criteria used in the study.
Table 2. Weight of used criteria in the study.
4.2. Weight determination using the ANP model
ANP, which is one of the widely used multi-criteria decision making techniques, was first proposed by Saaty and Vargas (Citation1998) . This model is a general form of the analytical hierarchy process (AHP) While the AHP employs a unidirectional hierarchical relationship among decision levels, the ANP enables interrelationships among the decision levels and attributes in a more general form (Saaty and Vargas Citation1998) The ANP model consists of three elements, (1) goal of selecting the best alternative, (2) criteria and sub-criteria for the model, and (3) alternatives. The elements in the hierarchy of determinants are divided into dimensions and attribute enablers. Identification of dimensions and attribute enablers at each level and definition of inter relationships is necessary for the development of decision model. The objective of hierarchy is ultimately to find out the alternatives (Saaty Citation2001, Citation2005).
The current study was carried out aiming at vulnerability evaluation of urban buildings in the zone 9 of Tehran municipality against different earthquake intensities. Therefore, in this research, the vulnerability of urban buildings to various earthquake intensities was evaluated using ten indices comprising material type, face type, building density, age, number of floors, ground area of the building, compatibility of adjacent users, distance from the fault, geological formations and width of passages together with the relevant required sub-standards. To analyze the weight of criteria and sub-criteria in ANP model, already weighed by experts, Super Decisions software was used. shows the cluster analysis of main criteria and sub-criteria effective on vulnerability of passage network of the city in ANP ( and ).
Figure 2. Flowchart for proposed methodology used in this study.
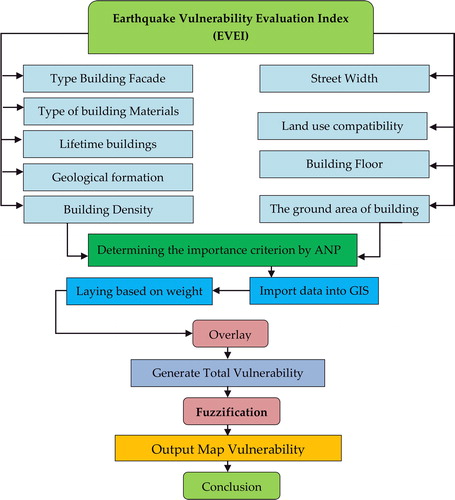
Figure 3. Cluster analysis of main criteria and sub-criteria effective on vulnerability of zone 9 in Super Decisions.
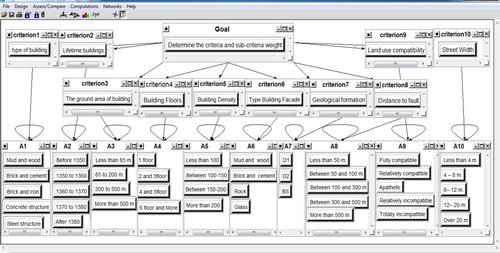
The above matrix indicated vulnerability of each sub-criteria in the main criteria. Then, weight of each sub-criteria was analyzed in ANP and a layer was prepared in GIS for each main criteria. Finally, weights of the main criteria were analyzed in ANP and the generalized vulnerability mapping was provided ( and ).
Figure 4. Composition of layers and weighing the ANP obtained main criteria. Building density (a), floor (b), land use compatibility (c), geological formation (d), street width (e), lifetime buildings (f), distance to fault (g), ground area of building (h), type of building materials (i), type building facade (j).
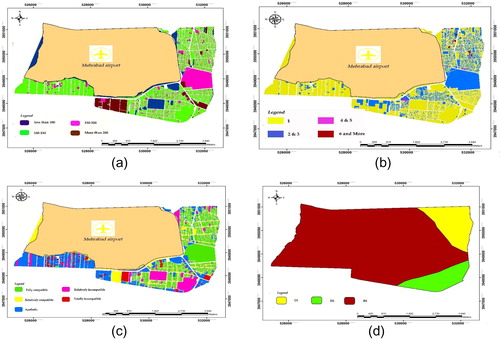
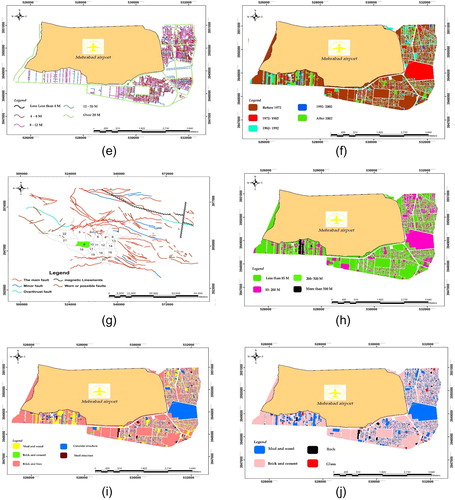
Figure 5. Generalized vulnerability mapping zone 9 of Tehran.
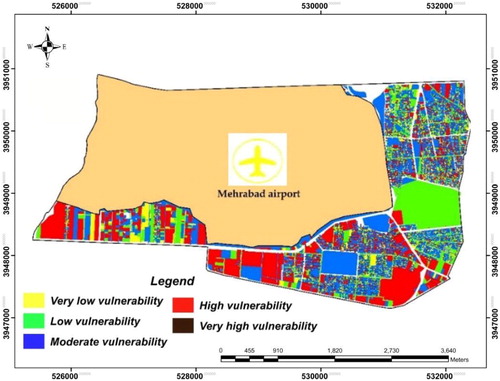
According to the results obtained by the experts' comments shown in , 16% and 14% of the areas have medium and high vulnerability respectively, while 0% of the area has very high vulnerability. The medium and very high vulnerability have the highest and lowest frequency.
Table 3. Level of residential building vulnerability based on expert opinions.
4.3. The map fuzzation
In previous step, general vulnerability map of district 9 in Tehran defined by analyzing weights of ANP model whose importance is between 1.9 is extracted. Since evaluation criteria are presented with various measurement criteria, (for instance, the age of building in years or distance from the fault in meters, etc.), fuzzation is required so that they can be converted to a common scale to evaluate the vulnerability; that is, the criteria importance is defined between 0–1 (Matkan et al. Citation2008; Feizizadeh et al. Citation2012b; Nazmfar Citation2012; Nazmfar Citation2017). This procedure is performed in GIS environment by using the option of fuzzy, weighted overlay. As a result, the final map of buildings vulnerability in district 9 of Tehran is extracted. demonstrates spatial distribution of damaged building in district 9 of Tehran against earthquake The number of damaged buildings in district l and 2 are respectively 21.91% and 18.06% in terms of very low vulnerability, 12.33% and 9.11% in terms of low vulnerability, 47.08% and 55.30% in terms of medium vulnerability, 17.95% and 17.31% in terms of high vulnerability, and 1.70% and 2.12% in terms of very high vulnerability. Totally, in district 9 of Tehran, 19.46% of buildings have trivial vulnerability, 10.69% and 50.29% of buildings face with low and medium vulnerability respectively, while 17.62% and 1.91% of buildings respectively face with high and very high vulnerability, or they are completely damaged ( and ; ).
Figure 6. Damage of buildings in district 9 of Tehran against earthquake.
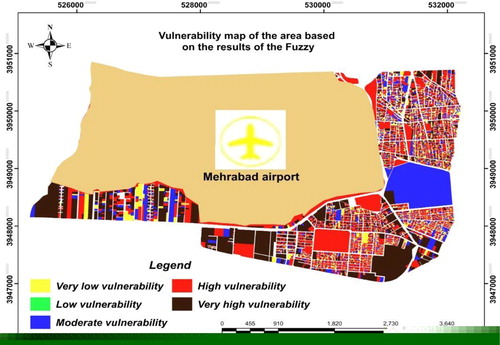
Figure 7. Diagram of the buildings damages in district 9 of Tehran against earthquake.
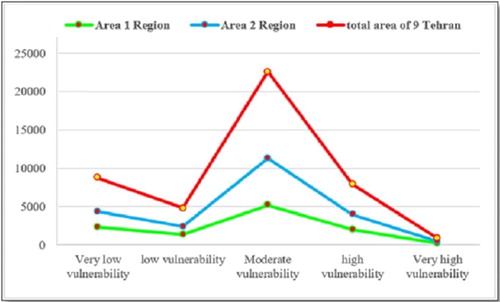
Table 4. The number and percent of damaged buildings in district 9 of Tehran against earthquake.
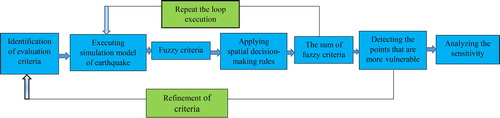
The findings of this research confirms the results of similar research such as the research results presented by Rashed and Weeks (Citation2003) as entitled studying the cities vulnerability against earthquake. In their studies, by using the model of GIS, AHP and fuzzy approach, it was tried to predict the vulnerability of cities building against earthquake in seven steps (), also, it is demonstrated that modelling by using GIS, ANP_AHP and fuzzy approach presents an appropriate model to evaluate the cities vulnerability against earthquake.
Figure 8. Theoretical framework of Rashed to evaluate vulnerability (Rashed and Week 2003, p. 549).
Martinelli et al. (Citation2008) performed a research entitled evaluation of buildings vulnerability and presenting a scenario of damages for Italy cities, and the case sample is Celano city. The result of the present research confirms this issue that masonry buildings have higher vulnerability than concrete building against earthquake. The findings of research confirms that the cities of developing countries are vulnerable against earthquake due to lack of suitable infrastructures, and this research was performed by Karimzadeh et al. (Citation2014) entitled building vulnerability and evaluation of human fatality in earthquake scenario by using AHP and GIs model. Nath et al. (Citation2015) performed the research entitled vulnerability of earthquake and risk evaluation in Kolkata of India by using geographical information system. Another research was performed by Rout et al. (Citation2015) entitled evaluation of building damages. Since all performed studies show that the cities of developing countries are vulnerable against earthquake due to lack of suitable infrastructures and locational and non-locational data, it is necessary to try to improve reinforcement indices in the cities of developing countries to reach urban sustainable development.
5. Conclusion
In order to determine seismic potential of studied area that is the initial and important step in the process of determining vulnerability in different areas against earthquake, preparing the map of important faults in the area, preparing the map of earthquake centres, determining severity and magnitude of earthquakes, estimating characteristics of earthquakes that may occur by important faults of studied area are taken into account. In the present research, to evaluate vulnerability due to earthquake hazard, ten indices are studied as effective factors in cities buildings vulnerability. These factors are selected on the basis of indices in previous studies. Indices involving materials type, type of facade building density, the age of building, the number of floors, ground area of buildings, compatibility of adjacent users, distance from the fault, geology formation and width of passageways are analyzed by using computational method of ANP scored by experts. The criteria weight is applied in effective layers in vulnerability. At last, by integrating the layers in GIS environments, general vulnerability map is extracted in the area. In order to evaluate the buildings vulnerability against earthquake, data obtained and from ANP analysis were made fuzzy. Finally, vulnerability map in district 9 of Tehran against earthquake was extracted. The research results show that if earthquake occurs, in district 9 of Tehran, 19.46% and 10.69% of buildings respectively have trivial and low vulnerability, while 50.29% of buildings have medium vulnerability. Also, 17.62% and 1.91% of building have high and very high vulnerability respectively, or they are completely damaged. The results obtained from the present research show that medium vulnerability is highly related to damage buildings. The reason of area vulnerability is its nearness to faults that are effective in the area vulnerability like Mosha faults, Tehran North, Rey South faults and weak geology formations. Also, it is mostly relate to human factors like high focus of population in old textures of the area, unauthorized and non-principled multi-storey buildings, using incompatible materials in buildings in recent years, especially in multi-storey buildings, urban texture exhaustion in the centre of areas using in unsuitable lands for urban development especially in the east north of the area, narrow passageways in old textures of the area, lack of following resistance and reinforcement rules and regulations and lack of a principled program to face with future crisis. Although losses after the crisis can be decreased by preparing map of urban buildings vulnerability against natural crisis like earthquake, this action cannot be taken into account until authorities seriously attempt to create information bank (buildings, installations, bridges passage ways, gas, electricity, water, etc.) and to encourage performing research activities to reduce the hazard of crises. With regard to the research findings, the following suggestions can be effective to improve the safety and to reduce the losses resulting from earthquake in district 9 of Tehran. These suggestions are proposed to increase the resistance of buildings structures in worn textures in Imamzadeh Abdallah, Dastgheib, Doctor Houshiar Shamshiri and Mehrabade Jonoubi.
Reducing the population density in old and weak textures with narrow passages.
To make consolidation plan of building structures and materials operational to increase the buildings area and to reduce building, density especially in Imamzadeh Abdollah and Mehrabade Jonoubi.
Widening the passageways in worn textures of Dastigheid and doctor Houshiar to solve the problem of accessing when the crisis occurs.
Providing the required fields for training and increasing awareness, expanding the culture of safety and the authorities preparation and people against the natural events and unexpected events especially earthquake hazard.
Developing and reinforcing comprehensive scientific studies and research to recognize and reduce the hazards resulting from natural and unexpected events by considering the priority of earthquake hazard and organizing and protecting scientific research centres.
Participating people in actions and their preparation and providing safety to confront with natural events.
Disclosure statement
No potential conflict of interest was reported by the author.
References
- Ahmed MS, Morita H. 2018. An analysis of housing structures’ earthquake vulnerability in two parts of Dhaka city. Sustainability. 10:1–18.
- Aliabadi SF, Sarsangi A, Modiri E. 2015. The social and physical vulnerability assessment of old texture against earthquake (case study: Fahadan district in Yazd City). Arab J Geosci. 8:10775–10787.
- Ardekani A, Golabchi M, Hosseini SM, Alaghmandan M. 2017. Investigation of the impact of high-rise buildings shapes on their structural stability in order to reduce seismic hazards (case study: the effect of shape of plan). Environ Hazards. 4(1):27–42.
- Armas I. 2012. Multi-criteria vulnerability analysis to earthquake hazard of Bucharest, Romania. Nat Hazards. 63:1129–1156.
- Armas I, Ionescu R, Gavris A, Toma-Danila D. 2016. Identifying seismic vulnerability hotspots in Bucharest. Appl Geogr. 77:49–63.
- Boukri M, Farsi MN, Mebarki A, Belazougui M, Ait-Belkacem M, Yousfi N, Guessoum N, Benamar DA, Naili M, Mezouar N, et al. 2018. Seismic vulnerability assessment at urban scale: case of Algerian buildings. Int J Disaster Risk Reduct. 31:555–575.
- Feizizadeh B, Blaschke T, Nazmfar H. 2012b. GIS-based ordered weighted averaging and Dempster–Shafer methods for landslide susceptibility mapping in Urmia Lake Basin, Iran. Int J Digit Earth. 7(8):688–708.
- Feizizadeh B, Blaschke T, Nazmfar H, Akbari E, and Kohbanani HR. 2012a. Monitoring land surface temperature relationship to land use/land cover from satellite imagery in Maraqeh County, Iran. J Environ Plan Manag. 56(9):1290–1315.
- Frigerio I, Ventura S, Strigaro D, Mattavelli M, Amicis M, Mugnano S, Boffi M. 2016. A GIS-based approach to identify the spatial variability of social vulnerability to seismic hazard in Italy. Appl Geogr. 74:12–22.
- Gu D, Gerland P, Pelletier F, Cohen B. 2015. Risks of exposure and vulnerability to natural disasters at the city level: a global overview. New York: United Nations. United Nations Technical Paper No. 2015/2.
- Hashemi SM, Mahmoudzadeh A, Yousefi F. 2014. Surveying the crises interaction with the emphasis on earthquake crisis using SWOT method: a case study on district 22, Tehran metropolis. Int J Health Syst Disaster Manag. 2(1):22–29.
- Ibrion M, Mokhtari M, Nadim F. 2015. Earthquake disaster risk reduction in Iran: lessons and ‘lessons learned’ from three large earthquake disasters—Tabas 1978, Rudbar 1990 and Bam. Int J Disaster Risk Sci. 6(4):415–427.
- Janalipour M, Mohammadzadeh A, Valadan Zoej MJ, Amirkhani S. 2015. Buildings’ damage determination after the earthquake by using ANFIS model and remote sensing imagery. Emerg Manag. 4(1):79–91.
- Japan International Cooperation Agency (JICA). 2000.
- Karimzadeh S, Miyajima M, Hassanzadeh R, Amiraslanzadeh R, Kamel B. 2014. A GIS-based seismic hazard, building vulnerability and human loss assessment for the earthquake scenario in Tabriz. Soil Dynam Earthq Eng. 66:263–280.
- Martinelli A, Cifani G, Cialone G, Corazza L, Petracca A, Petrucci G. 2008. Building vulnerability assessment and damage scenarios in Celano (Italy) using a quick survey data-based methodology. Soil Dynam Earthq Eng. 28(10–11):875–889.
- Matkan AA, Shakhiba A, Poor AliS H, Nazmfar H. 2008. Locating suitable sites for landfill using GIS (study area: the city of Tabriz). J Environ Sci. 2008(2):121–132.
- Mohammadi M, Nazarpour R. 2016. The modeling of human mortality in nightly earthquake scenario in zone 1 of the city of Ahwaz. Geogr Environ Hazards. 20:21–38.
- Moradi M, Delavar MR, Moshiri B. 2015. A GIS-based multi-criteria decision-making approach for seismic vulnerability assessment using quantifier-guided OWA operator: a case study of Tehran, Iran. Ann GIS. 21(3):209–222.
- Movahed A, Firouzi MA, Isafi A. 2012. Investigation of urban resistance vulnerability to earthquake using inverse hierarchy model (IHWP) in geographic information system: a case study of Masjed Soleyman. J Urban Plan Res. 3(11):115–136.
- Moya L, Mas E, Koshimura S, Yamazaki F. 2018. Synthetic building damage scenarios using empirical fragility functions: a case study of the 2016 Kumamoto earthquake. Int J Disaster Risk Reduct. 31:76–84.
- Nath SK, Adhikari MD, Devaraj N, Maiti SK. 2015. Seismic vulnerability and risk assessment of Kolkata City. Nat Hazards Earth Syst Sci. 15(6):1103–1121.
- Nazmfar H. 2012. An analysis of urban system with emphasis on entropy model (case study: the cities of East Azerbaijan Province). Indian J Sci Technol. 5(9):3340–3344.
- Nazmfar H. 2017. Urban development predictions direction of using a combination GIS and Bayesian the probabilistic model (case study: Ardabil). Hum Geogr Res Q. 49:357–370.
- Nazmfar H, Beheshti B. 2016. Application of combined model analytical network process and fuzzy logic models in landslide susceptibility zonation (case study: Chellichay Catchment). J Geogr Environ Plan. 27(1):53–68 (in Persian).
- Nazmfar H, Jafarzadeh J. 2018. Classification of satellite images in assessing urban land use change using scale optimization in object-oriented processes (a case study: Ardabil city, Iran). J Indian Soc Remote Sens. 46(12):1983.
- Nazmfar H, Roshan Roodi S. 2015. Assessment of development sustainability level in 9th district of Mashhad district based on hierarchy models and network analysis. J Manag Syst 5(15):49–68 (in Persian).
- Park JH, Shin M, Cho GH. 2016. A dynamic estimation of casualties from an earthquake based on a time-use survey: applying HAZUS-MH software to Ulsan. Nat Hazards. 81(1):289–306.
- Parnell S. 2016. Defining a global urban development agenda. World Dev. 78:529–540.
- Patterson O, Weil F, Patel K. 2010. The role of community in disaster response: conceptual models. Popul Res Policy Rev. 29(2):127–141.
- Pourmosavi M, Firoozpour A, Darani M. 2012. The role of local communities on the performance development of disaster management. Disaster Manag Knowl Q. 2(1):32–42.
- Rahmati S, Ghanei Bafghi R. 2012. An analysis on impact of Tehran urban space development on increase of earthquake vulnerability: a time period of recent 200 years. Geogr Res. 27:18218–18240.
- Ranjbar HR, Nekooie MA. 2018. An improved hierarchical fuzzy TOPSIS approach to identify endangered earthquake-induced buildings. Eng Appl Artif Intell. 76:21–39.
- Rashed T, Weeks J. 2003. Assessing vulnerability to earthquake hazards through spatial multicriteria analysis of urban areas. Geogr Inf Sci. 17(6):547–576.
- Rout S, Nanda RP, Panda KC. 2015. Seismic damage evaluation of existing buildings based on shear wave velocity: a case study. Asian J Civ Eng (BHRC). 16(6):909–918.
- Saaty TL. 2001. Decision making with dependence and feedback: the analytic network process. Pittsburgh: RWS Publications.
- Saaty TL. 2005. Theory and applications of the analytic network process. Pittsburgh: RWS Publications.
- Saaty TL, Vargas LG. 1998. Diagnosis with dependent symptoms: Bayes theorem and the analytic network process. Oper Res. 46(4):491–502.
- Zebardast E. 2013. Constructing a social vulnerability index to earthquake hazards using a hybrid factor analysis and analytic network process (F’ANP) model. Nat Hazards. 65(3):1331–1359.
- Zhang Y, Weng WG, Huang ZL. 2018. A scenario-based model for earthquake emergency management effectiveness evaluation. Technol Forecast Soc Change. 128:197–207.