
Abstract
With global warming, precipitation events are often prone to intensify in some regions. Understanding the changing characteristics of annual and daily extreme precipitation as well as the underlying mechanisms plays an import role for early warning of precipitation-induced disaster (e.g. floods, landslides) and water resources management, especially in densely populated urban areas. In this study, we investigate the long-term trend of annual and daily extreme precipitation in China during 1960–2010 based on daily observations from 539 meteorological stations, and the land cover map with impervious information. We find an overall increasing trend in annual and daily extreme precipitation, particularly in South-East and North-West of China. Moreover, 157 stations located in metropolitan regions experience higher increasing trends of daily extreme precipitation, particularly in Shanghai and Guangzhou metropolitan areas. It is noted that the central urban area of one metropolitan region may have significantly higher increasing trends of daily extreme precipitation than corresponding surrounding areas.
1. Introduction
With global warming, precipitations and daily extreme precipitation are expected to intensify in some regions (Alley et al. Citation2003; Trenberth Citation2012; Toride et al. Citation2018). Precipitation events may sometimes occur with particularly strong intensity, which are referred to as rainfall extremes, and may trigger some disasters such as landslides (He et al. Citation2016; Li et al. Citation2017), soil erosion (Nearing et al. Citation2005), and urban flooding (Schreider et al. Citation2000). Deng et al. (Citation2018) used daily precipitation data from rain gauges and analysed the abrupt changes and long-term trends of the intensity and frequency of extreme precipitation over China during 1960–2015. They found an increased trend of precipitation intensity and frequency for 56.44% and 66.23% of all rain gauges. Geographically, extreme precipitation occurred more frequently in the North–West and South–East of China. Climate models have projected an upward trend under the current greenhouse gas emissions resulted from anthropogenic activities (Meehl et al. Citation2005; Tebaldi and Knutti Citation2007). Besides climate change, land surface modification due to the presence of human settlements represents another important factor influencing the occurrence of extreme precipitation (Min et al. Citation2011), yet is under studied in China.
Urban areas are the main areas of human activity including human settlements with high population and density of buildings and infrastructures (Zhang et al. Citation2017). Nowadays, more than half of the Earth’s population is living in cities (Gremm et al. Citation2018). Human-induced urban environment (e.g. including land use, atmospheric boundary layer, and thermal properties) would modify the local weather and hydroclimate, and differentiate the relevant precipitation processes from the ones in the suburbs (Georgescu et al. Citation2014). In recent years, precipitation-induced disasters have been frequently observed in urban areas (Wang et al. Citation2013; Haiden et al. Citation2014; Yu et al. Citation2017; Wai et al. Citation2017).
With the rapid economic growth occurred in the past decades, China has been undergoing a rapid urbanisation process since 1980 (Yang, Citation2013). Coincidently, more extreme precipitation events have been observed in urban areas. For instance, Miao et al. (Citation2011) used the Weather Research and Forecasting (WRF) model to investigate the impacts of urban processes and urbanisation on summer precipitation in Beijing. They found that urban areas play an important role in determining extreme rainfall movement and rainfall amount. Chen et al. (Citation2015) used satellite-based precipitation products and found that the Pearl River Delta (PRD) metropolitan area experienced a larger number of short-duration heavy rainfall events, compared to the surrounding rural areas, possibly due to urbanisation effects. Liang and Ding (Citation2017) found that localised extreme hourly precipitation has increased significantly in Shanghai urban areas during the rapid urbanisation period (1981–2014). Understanding the changes of behaviour of extreme precipitation is of paramount relevance to the large number of population and the huge number of cities and megacities (Kundzewicz and Schellnhuber Citation2004; Yu et al. Citation2018). Previous studies have investigated the spatio-temporal distribution of precipitation and associated extremes in urban areas. However, most of them are case studies focusing on a single urban area or city but overlooked the comparison over multiple urban areas or metropolitan regions with their surrounding rural areas. The latter are constituted by the continuous urban and suburban areas of a city, including the built-up central areas and the suburbs (Gao et al. Citation2017). A metropolitan area is a systematic unit that may influence local surface warming and climate background (Gabriel and Endlicher Citation2011; Wang et al. Citation2012). The 2013 Intergovernmental Panel on Climate Change (IPCC) Report predicts that a number of world’s large metropolitan areas may be exposed to a temperature rise of greater than 1.5 °C under the RCP2.6 scenario (IPCC 2013). Feng et al. (Citation2014) used the WRF model to analyse the impact of anthropogenic heat release in three vast metropolitan areas of China, and indicated that the local weather changes are somewhat related to the presence of metropolitan areas. Therefore, it is of great relevance to afford a more systematic analysis of precipitation in urban and metropolitan areas.
In this study, we analyse the long-term trends of annual and daily extreme precipitation from two perspectives: single urban areas and metropolitan areas. In addition, the possible underlying mechanisms to explain the differences between urban and inner metropolitan areas are investigated.
2. Data and methods
2.1. Data preprocessing
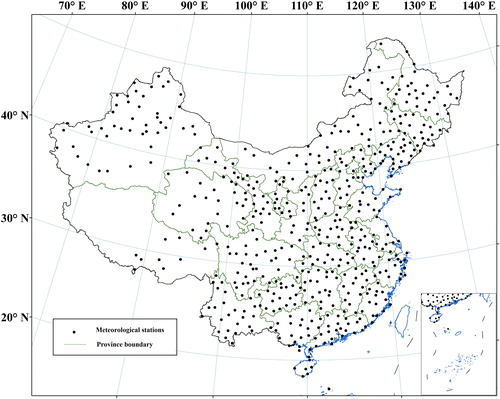
Daily precipitation data from 539 meteorological stations during 1960–2010 are obtained from China Meteorological Data Service Center (http://data.cma.cn/en). Locations of these stations are displayed in . The selected stations are a subset from a total number of 753 meteorological stations with 214 stations with incomplete data records. We therefore decide not to include these 214 stations to increase the robustness of our study.
Figure 1. The distribution of meteorological stations in China.
The impervious surface area (ISA) coverage data is used for extracting the urban areas. The data has been derived from the service of NOAA National Centers for Environmental Information (NCEI) and can be downloaded for free at: https://www.ngdc.noaa.gov/eog/dmsp/download_global_isa.html. The global gridded ISA data was developed by Elvidge et al. (Citation2007) based on two coarse indicators: the brightness of satellite-observed night-time light and the population count.. The time of the latest ISA data is 2010, and the resolution is 1 km × 1 km.
Additionally, the statistical data on Beijing, Shanghai, Guangzhou and Shenzhen urban built-up areas are obtained from China Statistical Yearbook, which is published yearly by China Statistical Press.
2.2. Analysis techniques and methodology
2.2.1. Definition of extreme precipitation and trend estimation approach
In China, heavy rainfalls and severe rainstorms are considered as extremes when the daily rainfall amounts reach above 50 mm and 100 mm, respectively (Domrös and Peng Citation2012). These criteria have been used by researchers and officials as indicators to estimate and simulate the potential urban waterlogging and flooding. The method for determining the extreme precipitation threshold has been widely explored in recent studies (e.g. Frich et al. Citation2002; Zhai et al. Citation2005; Wu et al. 2015). In fact, in most regions of China, precipitation extremes larger than 50 mm are very rare. Particularly in the Western arid region of China, even heavy precipitation events are very rare due to the overall scarcity of precipitations. shows that some meteorological stations are located in the West of China. Therefore, instead of using absolute values, we have defined as relative extreme precipitation events whose amount is larger than the 95th percentile of annual raining days during 1960–2010. In other words, the threshold accounts for 95th percentile of all daily rainfall amounts in one year.
In order to analyse the trends of the annual and daily extreme precipitation, we used a linear model to estimate precipitation trend from 1960 to 2010. Frei and Schär (Citation2001) indicated that the trends in extreme precipitation may be estimated with a logistic regression, a special form of the Generalised Linear Model (GLM). This method assumes the residuals of precipitation follow a normal distribution. It is quite commonly used to compute trends in hydro-meteorological data series (Zhang et al. Citation2000; Zhai et al. Citation2005; Daly et al. Citation2017). In the linear model y(t) = b + at, y(t) is the annual precipitation amount or daily extreme precipitation, t is the time, while parameters a and b are the regression intercept and angular coefficient, respectively. The magnitude of a represents the estimated rate of precipitation changes (ERPC), while its sign shows either an increasing or a decreasing (negative) trend.
2.2.2. Extraction of urban areas and selection of urban meteorological stations
Urban areas are mainly in the form of impervious surfaces (ISs), which include artificial urban structures such as roads, rooftops, parking lots, and sidewalks. Ma et al. (Citation2014) found that most of percent impervious surfaces (PISs) in urban areas are higher than 10% in China. These regions refer to the distribution of urban areas. The ISA data (PISs > 10%) are classified into nine categories, see .
Figure 2. The distribution of urban areas (PISs > 10%) and three typical metropolitan areas in China ((a) Beijing-Tianjin; (b) Yangtze River Delta and (c) Pearl River Delta).
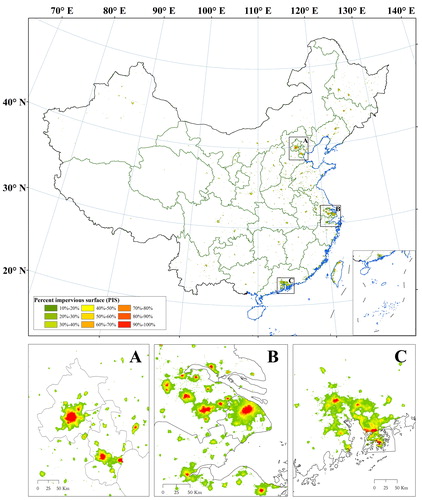
As shown in the Introduction (Sect. 1), local weather and hydroclimate may be affected in densely-populated urban areas. Thus, we select urban meteorological stations based on the following conditions: (1) the presence of a continuous urban area spanning over more than 100 km2 (Shao Citation2015); (2) the shortest distance between the meteorological station and the surrounding urban area is less than 10 km (Yang et al. Citation2013a). According to these criteria, we selected 157 urban metropolitan stations located in or around urban areas.
Usually, a bigger city in China is also a densely populated area with suburban area and rural area that are more sparsely populated. In this study, we have selected three typical metropolitan areas as study areas to compare and analyse the changes of annual and extreme precipitation (see ): Beijing-Tianjin, Yangtze River Delta, and Pearl River Delta.
3. Results
3.1. Trends in annual and extreme precipitation
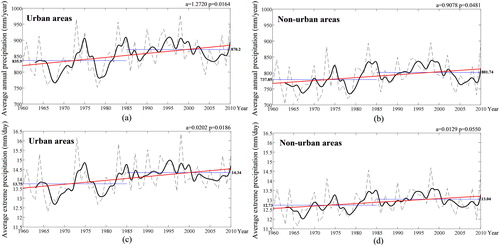
According to Section 2.2.2, all tested meteorological stations include 157 urban stations, in other words, other 382 stations are located in nonurban areas. We used GLM to estimate the trends of annual and extreme precipitation changes. In total, both average annual and extreme precipitation show an upward trend (red line) in urban and nonurban areas. It is evident that urban areas have more statistically significant increasing trend (average annual precipitation: EPRC = 1.2720, p-value = 0.0164; average extreme precipitation: EPRC = 0.0202, p-value = 0.0186) than nonurban areas (average annual precipitation: EPRC = 0.9078, p-value = 0.0481; average extreme precipitation: EPRC = 0.0129, p-value = 0.0550). In addition, precipitation sequences are divided into two periods, i.e. 1960–1985 and 1985–2010; both urban and nonurban areas have higher average annual and extreme precipitation in the second period. Urban areas show more significant differences in the two periods than non-urban areas (see ).
Figure 3. Long-term trends of average annual (first row) and extreme precipitation (second row) from 1960 to 2010 for urban and nonurban areas. Black dotted and thick lines represent the average annual and extreme precipitation, and with a 5-year moving-average window, respectively. Red and two blue dotted lines represent the estimated precipitation trends from 1960 to 2010, and average annual (extreme) precipitation from 1960 to 1985 (before), 1985 to 2010 (later), respectively.
Furthermore, we normalised EPRC values between –1.0 and 1.0 in order to compare spatial differences of precipitation trends. shows ERPC values of 539 meteorological stations from 1960 to 2010 in China. presents the distribution of ERPC at the annual scale. The trends of extreme precipitation are shown in .
Figure 4. Distributions of ERPCs for 539 meteorological stations from 1960 to 2010 (a) annual precipitation; (b) daily extreme precipitation).
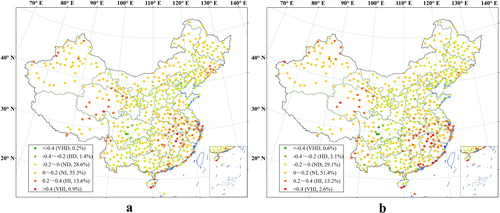
The normalised ERPC values are further classified into six categories:
very high decrease (VHD): ERPC ≤0.4;
high decrease (HD): ERPC between –0.4 and –0.2;
normal decrease (ND): ERPC between –0.2 and 0.0;
normal increase (NI): ERPC between 0.0 and 0.2;
high increase (HI): ERPC between 0.2 and 0.4; and
very high increase (VHI): >0.4.
The outcome of this classification shows that trends of the annual precipitation in the most regions are consistent with the ones of the extreme precipitation (see ). More than 65% of all meteorological stations have an increasing trend of annual and extreme precipitation from 1960 to 2010. Particularly, in South-East and North-West China, annual and extreme precipitation exhibit high increase (HI) and very high increase (VHI) trends over large regions. Numbers of meteorological stations having VHI trends account for 2.6% in extreme precipitation larger than those (0.9%) in annual precipitation. This means that 14 meteorological stations show very high increase (VHI) trends of extreme precipitation.
3.2. Differences between annual and extreme precipitation
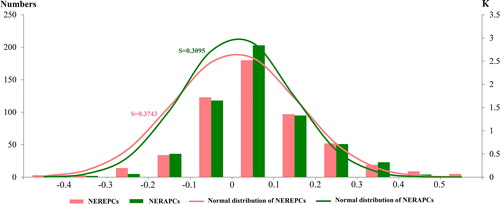
In order to explore the differences between annual and extreme precipitation (in the following referred to as numbers of ERAPC (NERAPC) and numbers of EREPC (NEREPC), respectively), we have estimated the rate of annual (extreme) precipitation changes based on 0.1 steps in the NERPC scale (see ). NERAPCs (based on 203 meteorological stations) are larger than NEREPCs (based on 180 meteorological stations) in the range between 0 and 0.1. When the value is larger than 0.4 (or less than –0.3), more stations feature increasing (or decreasing) trends in extreme precipitation, as expected. We use the normal probability density function to fit the estimated rate of annual (extreme) precipitation changes (ERAPCs and EREPCs). The kurtosis (K - see, e.g. Crosilla et al. Citation2013) of ERAPCs is near the expected value of 3.0, which means that EPARCs have a peaked distribution and EREPCs indicate a relatively flat distribution. Skewness (S - see, e.g. Crosilla et al. Citation2013) is used to characterise the symmetry of precipitation data distribution around the sample mean. Skewness of EREPCs and ERAPCs are 0.3743 and 0.3095, respectively. These values indicate the presence of a tail on the right side of the frequency distribution. Comparing with changes of annual precipitation, observations from more meteorological stations indicate that the extreme precipitation in China is more likely to show an increasing trend from 1960 to 2010.
Figure 5. The distribution of NEREPCS and NERAPCs from 1960 to 2010.
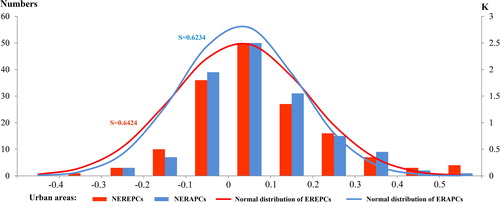
As is mentioned above in Section 2.2.2, 157 meteorological stations located in urban areas are considered in this study. Based on the analysis of ERPC, 108 urban stations show increasing trends in the annual precipitation, while 107 do the same for the extreme precipitation. According to the NERAPCs and NEREPCs computed on the basis of these data sets (see ), the same results for annual and extreme precipitation events have been observed in the range between 0 and 0.1. Within the ranges –0.1 – 0 and 0.1–0.2, NERAPCs are larger than NEREPCs. When the value of ERPC is greater than 0.4, more urban stations obviously show increasing trends of extreme precipitation. After normalisation, the frequency distribution shows that kurtosis of ERAPCs is also larger than the case of EREPCs, and more EREPCs are distributed on both tails of the histogram. This indicates that urban areas have higher probability of extreme precipitation. The skewness of EREPCs frequency histogram (0.6424) is larger than that of ERAPCs (0.6234). Urban meteorological stations indicate that extreme precipitation in urbans areas of China show an increasing trend from 1960 to 2010.
Figure 6. Fitted distribution of NEREPCS and NERAPCs in urban areas of China from 1960 to 2010.
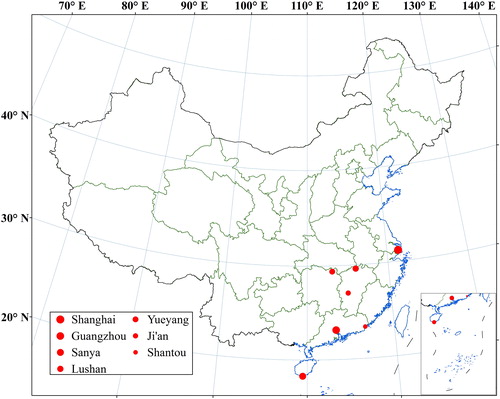
It is noteworthy that there are seven urban stations that show evident increasing trends in extreme precipitation and they account for half of all VHI-trend stations (see ). These seven urban stations are located in the South-East of China. The first two stations lie in the urban areas of Shanghai and Guangzhou which have the largest urban areas in Southeast China.
Figure 7. The distribution of seven urban meteorological stations with highest increasing trends of extreme precipitation.
3.3. Precipitation trends in three bigger metropolitan areas
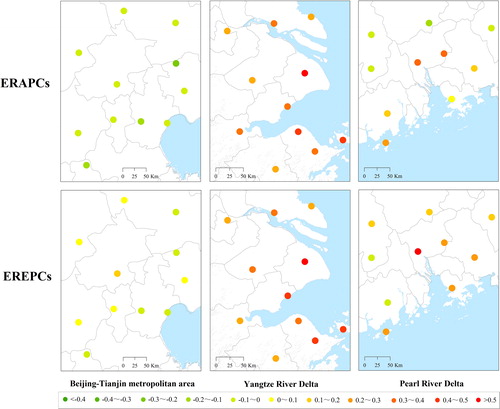
shows the distribution of ERPCs in three bigger metropolitan areas from 1960 to 2010. Beijing-Tianjin metropolitan area shows a decreasing trend of annual precipitation, but some stations in the western part of this region reveal increasing trends of extreme precipitation. Increasing trends of annual and extreme precipitation are observed in Yangtze River Delta. Some coastal areas experience increasing precipitation trends. As far as the Pearl River Delta is concerned, there is a big difference between annual and extreme precipitation. In particular, Guangzhou area shows increasing trends of both annual and extreme precipitation.
Figure 8. Distribution of ERPCs in three bigger metropolitan areas of China from 1960 to 2010.
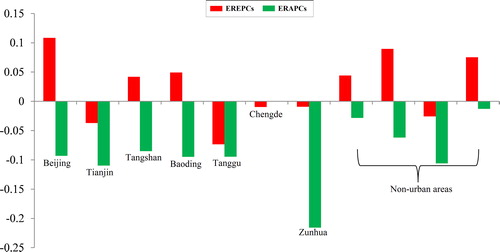
Beijing-Tianjin metropolitan area includes seven meteorological stations that are located at Beijing, Tianjin, Tangshan, Baoding, Tanggu, Chengde, and Zunhua. Further four stations are distributed in non-urban areas (). In this area a quite clear synergy between annual and extreme precipitation may be noticed. All eleven stations have decreasing trends of annual precipitation. However, more than half stations indicate that there are increasing trends of extreme precipitation, particularly in Beijing urban area.
Figure 9. EREPCs and ERAPCs in Beijing-Tianjin metropolitan area from 1960 to 2010.
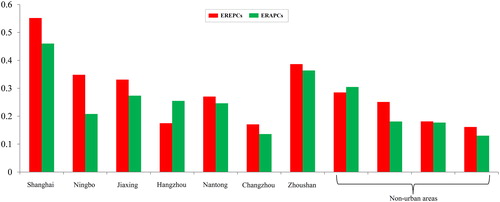
In Yangtze River Delta there are eleven meteorological stations, including seven urban stations and four nonurban stations. All these stations show increasing trends of annual precipitation and extreme precipitation. This area may be prone to face threat from increasing precipitations and extreme precipitation. The Shanghai urban area has the highest estimated rate of precipitation changes, followed by the Zhoushan urban area (). To the westbound of Shanghai, some urban stations (e.g. Hangzhou and Changzhou stations) show lower increasing trends of annual and extreme precipitation.
Figure 10. EREPCs and ERAPCs in Yangtze River Delta metropolitan area from 1960 to 2010.
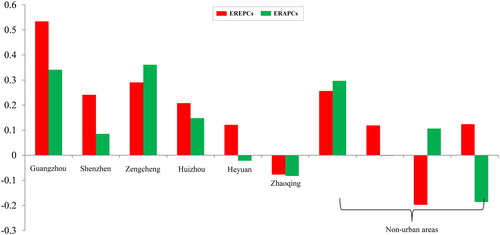
Pearl River Delta includes 10 meteorological stations, six of which are located in Guangzhou, Shenzhen, Zengcheng, Huizhou, Heyuan, and Zhaoqing urban areas. Most of these stations show increasing trends of annual and extreme precipitation. Maximum value of EREPCs can be found in Guangzhou urban area, while the maximum ERAPCs are in Zengcheng urban area close to Guangzhou ().
Figure 11. EREPCs and ERAPCs in Pearl River Delta area from 1960 to 2010.
The analysis described in this section highlights that the metropolitan areas may be liable to be affected by extreme precipitation. In addition to this conclusion, the central parts of the largest metropolitan areas (e.g. Beijing, Shanghai and Guangzhou cities) have higher increasing trends of extreme precipitation. It can be observed that annual precipitation have gradually decreased in some areas, where an upward of precipitation extremes may be addressed, especially in Beijing-Tianjin metropolitan area.
4. Discussion
In this study, two points should be noted: (1) the spatial distribution of precipitation changes and (2) the precipitation extremes over urban areas.
4.1. The spatial distribution of precipitation changes
China is mainly characterised by the East Asian Monsoon (EAM) climate, which is recently recognised that the EAM is significantly affected by El Niño-Southern Oscillation (ENSO) events (Chen et al. Citation2013). Meanwhile, some studies also revealed that the changes in extreme precipitation are related to the large-scale circulation changes (Hoerling et al. Citation2016; Gu et al. Citation2017a), and are affected by tropical cyclone (Ying et al. Citation2011) and topography (Zhang et al. Citation2013). For example, Gu et al. (Citation2017a) found that higher Southern Oscillation Index (SOI) and Pacific Decadal Oscillation (PDO) may trigger an increase in the frequency of heavy of heavy precipitation in northeastern and eastern China. Our results also reveal that the spatial pattern of changes in annual and extreme precipitation show a clear spatial heterogeneity. Overall, most of the meteorological stations in South-East and North-West of China exhibit increasing trends of annual and extreme precipitation. These results are consistent with previous studies (Gu et al. Citation2017b; Deng et al. Citation2018). As the South-East and North-West part of China have relatively wetter and drier climate. These findings also may indicate that extreme precipitation having sharp increasing trends may occur in the driest and wettest regions of the country.
4.2. The precipitation extremes over urban areas
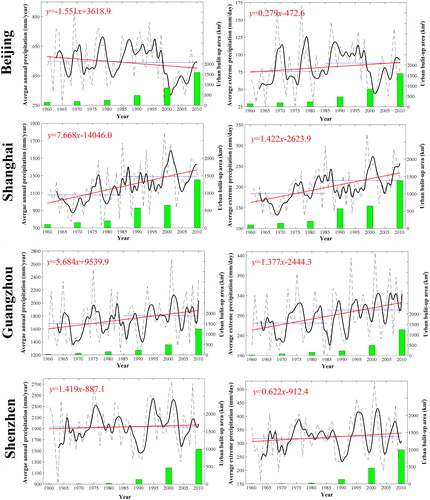
With urban expanding, climate changes induced by human activities (e.g. greenhouse gas emissions, anthropogenic heat, and urbanisation) have aroused more and more attentions (Karl & Trenberth Citation2003; Han et al. Citation2014). Urban areas make the local weather and climate different from that in the surrounding suburbs (Naylor and Sexton Citation2018). In previous studies, the amount and frequency of precipitation tends to be higher in urban centers and downwind than in the surrounding areas (Ganeshan et al. Citation2013; Zhang et al. Citation2018). We found that the extreme precipitation is more likely to occur in urban areas. shows the trends of annual and extreme precipitation in urban areas of four typical megacities (e.g. Beijing, Shanghai, Guangzhou, and Shenzhen) undergoing a period (i.e. since 1990) of rapid urban expansion. In total, four urban areas have increasing trends of extreme precipitation and larger average of extreme precipitation in the period of rapid urban expansion, although in Beijing having a decreasing trend in annual precipitation. It should be noted that such precipitations fluctuate more evident for urban areas in rapid urban expansions of four cities. Extreme precipitation events have been occurring more frequently in the four typical urban areas during the rapid urban expansions (Yang et al. Citation2013b; Liang and Ding Citation2017; Wang et al Citation2015).
Figure 12. Long-term trends of average annual (first row) and extreme precipitation (second row) from 1960 to 2010 in four typical urban areas (from Beijing, Shanghai, Guangzhou and Shenzhen). Black dotted and thick lines represent the average annual and extreme precipitation, and with a 5-year moving-average window, respectively. Red and two blue dotted lines represent the estimated precipitation trends from 1960 to 2010, and average annual (extreme) precipitation from 1960 to 1985 (before), 1985 to 2010 (later), respectively. Green Bars represent the changes of urban built-ups in seven periods.
Additionally, in three typical metropolitan areas, we found that the central part of the urbanised region (e.g. Beijing, Shanghai and Guangzhou cities) have higher increasing trends of extreme precipitation with respect to their surrounding areas. In order to further investigate this phenomenon, nine large metropolitans have been selected in different regions of the country and analysed. Results are listed in .
Table 1. ERAPCs and EREPCs of all metropolitan areas considered in this study.
The central urban areas of the chosen metropolitan regions are: Shenyang, Jinan, Wuhan, Zhengzhou, Urumqi, and Chongqing. All of these areas experience an upward trend of extreme precipitation from 1960 to 2010. There are five central urban areas (e.g. Shanghai, Shenyang, Jinan, Urumqi, and Chongqing) which have the largest ERAPCs and EREPCs. EREPCs has ranked 2 in Wuhan and Zhengzhou urban areas. These results also reflect the phenomenon that the inner urban area of a metropolitan area may have higher increasing trends of extreme precipitation. Indeed, inner metropolitan areas often have the same natural factors such as topography, geomorphology, flow and vegetation cover, while the central urban areas often have higher impervious rate and, since they are densely populated, thus they are more seriously affected by human activities. In other words, a central urban area may have a higher potential risk of precipitation extremes in one metropolitan area.
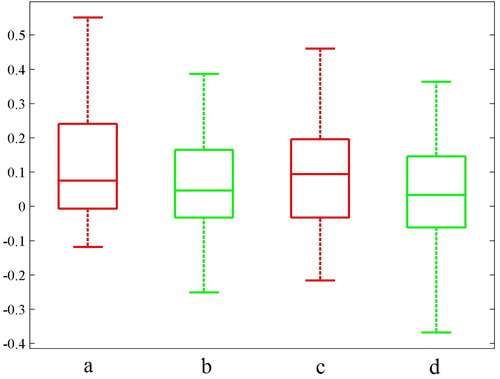
Totally, there are 83 meteorological stations that are located in the above mentioned nine metropolitan areas, including 41 urban and 42 non-urban stations. shows the box plots of urban/non-urban EPEPCs as well as urban/non-urban EPAPCs in the same metropolitan areas. The rectangular box plot shows three horizontal lines that represent the median (intermediate line), the 25th percentile (lower line), and the 75th percentile values (upper line), while the two top and bottom vertical lines represent the maximum and minimum precipitation changes during 1960–2010 in urban and non-urban areas. From a thorough analysis of this figure, the median rises of the annual and extreme precipitation in urban areas are higher than the ones in the nonurban areas. Compared with annual precipitation, extreme precipitation in urban areas has a longer upper whisker, which indicates most of urban areas represent increasing trends in extreme precipitation.
Figure 13. Comparison between the box plot for urban, nonurban EPEPCs and urban, nonurban ERAPCs in the metropolitan areas from 1960 to 2010. (a) EPEPCs in urban areas; (b) EPEPCs in non-urban areas; (c) EPAPCs in urban areas and (d) EPAPCs in nonurban areas).
5. Conclusions
In this study, 539 meteorological stations and 2010-year impervious surface data have been jointly exploited to explore the trends of annual and extreme precipitation in China from 1960 to 2010. Meanwhile, 157 stations were selected in urban areas to specifically investigate the precipitation trends, as well as to find possible differences of the trends inside them. Some major conclusions of this study can be summarised as follows:
More than 65% of all the meteorological stations have shown an increasing trend of annual and extreme precipitation from 1960 to 2010. Especially, the most stations that exhibited clear increasing trends are located in South–East and North–West of China;
Overall, more meteorological stations indicate that the extreme precipitation are more likely to have an increasing trend, particularly in urban areas. It is noted that Shanghai and Guangzhou urban areas have higher upward trends of extreme precipitation;
The inner urban area of a metropolitan area may have significantly higher increasing trends of extreme precipitation than the outer surrounding areas.
This study provides some basic information on the changing characteristics of annual and extreme precipitation in China, which is important for prediction and mitigation of precipitation-induced disasters such as landslides and flooding. Given our findings, precipitation extremes should be paid more and more attention in urban areas. For future study, we plan to use hourly precipitation data and explore the relationship between extreme precipitation and the urbanisation processes of some typical urban areas. Besides the impervious surface data, high-resolution land cover maps (e.g. Chen et al. Citation2015) can be used to further investigate the possible dependency of the precipitation trends with respect to the land use and land cover (LULC).
Conflicts of interest
No potential conflict of interest was reported by the authors.
Additional information
Funding
Related Research Data
References
- Haiden T, Magnusson L, Tsonevsky I, Wetterhall F, Alfieri L, Pappenberger F, de Rosnay P, Muñoz-Sabater J, Balsamo G, Albergel C, et al. 2014. ECMWF forecast performance during the June 2013 flood in Central Europe. Reading, MA: European Centre for Medium-Range Weather Forecasts; p. 1–32.
- Wang J, Feng J, Yan Z, Hu Y, Jia G. 2012. Nested high-resolution modeling of the impact of urbanization on regional climate in three vast urban agglomerations in China. J Geophys Res. 117:D21103.
- Wang K, Wang L, Wei YM, Ye MS. 2013. Beijing storm of July 21, 2012: observations and reflections. Nat Hazards. 67(2):969–974.
- Zhang S, Huang G, Qi Y, Jia G. 2018. Impact of urbanization on summer rainfall in Beijing–Tianjin–Hebei metropolis under different climate backgrounds. Theor Appl Climatol. 133(3–4):1093–1106.
- Zhang X, Vincent LA, Hogg WD, Niitsoo A. 2000. Temperature and precipitation trends in Canada during the 20th century. Atmos Ocean. 38(3):395–429.
- Alley RB, Marotzke J, Nordhaus WD, Overpeck JT, Peteet DM, Pielke Jr RA, Pierrehumbert RT, Rhines PB, Stocker TF, Talley LD, et al. 2003. Abrupt climate change. Science. 299(5615):2005–2010.
- Chen J, Chen J, Liao A, Cao X, Chen L, Chen X, He C, Han G, Peng S, Lu M, et al. 2015. Global land cover mapping at 30 m resolution: a POK-based operational approach. ISPRS J Photogramm Remote Sens. 103:7–27.
- Chen S, Li WB, Du YD, Mao CY, Zhang L. 2015. Urbanization effect on precipitation over the Pearl River Delta based on CMORPH data. Adv Climate Change Res. 6(1):16–22.
- Chen W, Feng J, Wu R. 2013. Roles of ENSO and PDO in the link of the East Asian winter monsoon to the following summer monsoon. J Climate. 26(2):622–635.
- Crosilla F, Macorig D, Scaioni M, Sebastianutti I, Visintini D. 2013. LiDAR data filtering and classification by skewness and kurtosis iterative analysis of multiple point cloud data categories. Appl Geomat. 5(3):225–240.
- Daly C, Slater ME, Roberti JA, Laseter SH, Swift LW. 2017. High-resolution precipitation mapping in a mountainous watershed: ground truth for evaluating uncertainty in a national precipitation dataset. Int J Climatol. 37(S1):124–137.
- Deng Y, Jiang W, He B, Chen Z, Jia K. 2018. Change in intensity and frequency of extreme precipitation and its possible teleconnection with large-scale climate index over the China from 1960 to 2015. J Geophys Res Atmos. 123(4):2068–2081.
- Domrös M, Peng G. 2012. The climate of China. Berlin: Springer; p. 121–125.
- Elvidge C, Tuttle B, Sutton P, Baugh K, Howard A, Milesi C, Bhaduri B, Nemani R. 2007. Global distribution and density of constructed impervious surfaces. Sensors. 7(9):1962–1979.
- Feng J, Wang J, Yan Z. 2014. Impact of anthropogenic heat release on regional climate in three vast urban agglomerations in China. Adv Atmos Sci. 31(2):363–373.
- Frei C, Schär C. 2001. Detection probability of trends in rare events: theory and application to heavy precipitation in the Alpine region. J Climate. 14(7):1568–1584.
- Frich P, Alexander LV, Della-Marta PM, Gleason B, Haylock M, Klein Tank AMG, Peterson T. 2002. Observed coherent changes in climatic extremes during the second half of the twentieth century. Clim Res. 19(3):193–212.
- Gabriel KMA, Endlicher WR. 2011. Urban and rural mortality rates during heat waves in Berlin and Brandenburg, Germany. Environ Pollut. 159(8–9):2044–2050.
- Ganeshan M, Murtugudde R, Imhoff ML. 2013. A multi-city analysis of the UHI-influence on warm season rainfall. Urban Clim. 6:1–23.
- Gao X, Xu Z, Niu F, Long Y. 2017. An evaluation of China’s urban agglomeration development from the spatial perspective. Spat Stat. 21:475–491.
- Georgescu M, Morefield PE, Bierwagen BG, Weaver CP. 2014. Urban adaptation can roll back warming of emerging megapolitan regions. Proc Natl Acad Sci USA. 111(8):2909–2914.
- Gremm J, Barth J, Fietkiewicz KJ, Stock WG. 2018. Informational Cities in the GCC States//Transitioning Towards a Knowledge Society. Cham: Springer; p. 3–36.
- Gu X, Zhang Q, Singh VP, Shi P. 2017a. Changes in magnitude and frequency of heavy precipitation across China and its potential links to summer temperature. J Hydrol. 547:718–731.[InsertedFromOnline
- Gu X, Zhang Q, Singh VP, Shi P. 2017b. Non-stationarities in the occurrence rate of heavy precipitation across China and its relationship to climate teleconnection patterns. Int J Climatol. 37(11):4186–4198.
- Han JY, Baik JJ, Lee H. 2014. Urban impacts on precipitation. Asia-Pacific J Atmos Sci. 50(1):17–30.
- He X, Hong Y, Vergara H, Zhang K, Kirstetter P-E, Gourley JJ, Zhang Y, Qiao G, Liu C. 2016. Development of a coupled hydrological-geotechnical framework for rainfall-induced landslides prediction. J Hydrol. 543:395–405.
- Hoerling M, Eischeid J, Perlwitz J, Quan XW, Wolter K, Cheng L. 2016. Characterizing recent trends in U.S. heavy precipitation. J Climate. 29(7):2313–2332.
- IPCC (Intergovernmental Panel on Climate Change 2013. Summary for policymakers. In Climate change 2013: The physical science basis. Contribution of Working Group I to the fifth assessment report of the Intergovernmental Panel on Climate Change edited by Stocker TF, Qin TF, Plattner D, Tignor G-K, Allen M, Boschung SK, Nauels J, Xia A, Bex YV, Midgley PM. Cambridge, UK: Cambridge University Press.
- Karl TR, Trenberth KE. 2003. Modern global climate change. Science. 302(5651):1719–1723.
- Kundzewicz ZW, Schellnhuber HJ. 2004. Floods in the IPCC TAR perspective. Nat Hazards. 31(1):111–128.
- Li W, Liu C, Marco S, Sun W, Chen Y, Yao D, Chen S, Hong Y, Zhang K, Cheng G.. 2017. Spatio-temporal analysis and simulation on shallow rainfall-induced landslides in China using landslide susceptibility dynamics and rainfall I-D thresholds. Sci China Earth Sci. 60(4):720–732.
- Liang P, Ding Y. 2017. The long-term variation of extreme heavy precipitation and its link to urbanization effects in Shanghai during 1916–2014. Adv Atmos Sci. 34(3):321–334.
- Ma Q, He C, Wu J, Liu Z, Zhang Q, Sun Z. 2014. Quantifying spatiotemporal patterns of urban impervious surfaces in China: an improved assessment using nighttime light data. Landsc Urban Plan. 130:36–49.
- Meehl GA, Arblaster JM, Tebaldi C. 2005. Understanding future patterns of increased precipitation intensity in climate model simulations. Geophys Res Lett. 32:L18719.
- Miao S, Chen F, Li Q, Fan Q. 2011. Impacts of urban processes and urbanization on summer precipitation: a case study of heavy rainfall in Beijing on 1 August 2006. J Appl Meteor Climatol. 50(4):806–825.
- Min SK, Zhang X, Zwiers FW, Hegerl GC. 2011. Human contribution to more-intense precipitation extremes. Nature. 470(7334):378.
- Naylor J, Sexton A. 2018. The relationship between severe weather warnings, storm reports, and storm cell frequency in and around several large metropolitan areas. Weather Forecast. 33(5):1339–1358.
- Nearing MA, Jetten V, Baffaut C, Cerdan O, Couturier A, Hernandez M, Le Bissonnais Y, Nichols MH, Nunes JP, Renschler CS, et al. 2005. Modeling response of soil erosion and runoff to changes in precipitation and cover. Catena. 61(2/3):131–154.,
- Schreider SY, Smith DI, Jakeman AJ. 2000. Climate change impacts on urban flooding. Clim Change. 47(1/22):91–115.
- Shao Z. 2015. The new area development: a case study in China. Heidelberg: Springer; p. 77–79.
- Tebaldi C, Knutti R. 2007. The use of the multi-model ensemble in probabilistic climate projections. Philos Trans R Soc A. 365(1857):2053–2075.
- Toride K, Cawthorne DL, Ishida K, Levent Kavvas M, Anderson ML. 2018. Long-term trend analysis on total and extreme precipitation over Shasta Dam watershed. Sci Total Environ. 626:244–254.
- Trenberth KE. 2012. Framing the way to relate climate extremes to climate change. Clim Change. 115(2):283–290.
- Wai KM, Wang XM, Lin TH, Wong MS, Zeng SK, He N, Ng E, Lau K, Wang DH. 2017. Observational evidence of a long-term increase in precipitation due to urbanization effects and its implications for sustainable urban living. Sci Total Environ. 599:647–654.
- Wang D, Jiang P, Wang G, Wang D. 2015. Urban extent enhances extreme precipitation over the Pearl River Delta, China. Atmos Sci Lett. 16(3):310–317.
- Wu Y, Wu SY, Wen J, Xu M, Tan J. 2016. Changing characteristics of precipitation in China during 1960–2012. Int J Climatol. 36(3):1387–1402.
- Yang P, Ren G, Hou W, Liu W. 2013. Spatial and diurnal characteristics of summer rainfall over Beijing Municipality based on a high-density AWS dataset. Int J Climatol. 33(13):2769–2780.
- Yang P, Ren G, Liu W. 2013. Spatial and temporal characteristics of Beijing urban heat island intensity. J Appl Meteor Climatol. 52(8):1803–1816.
- Yang XJ. 2013. China's rapid urbanization. Science. 342(6156):310.
- Ying M, Chen B, Xu G. 2011. Climate trends in tropical cyclone-induced wind and precipitation over mainland China. Geophys Res Lett. 38:L01702.
- Yu M, Miao S, Li Q. 2017. Synoptic analysis and urban signatures of a heavy rainfall on 7 August 2015 in Beijing. J Geophys Res. 122(1).65-78
- Yu R, Zhai P, Chen Y. 2018. Facing climate change-related extreme events in megacities of China in the context of 1.5 °C global warming. Curr Opin Environ Sustain. 30:75–81.
- Zhai P, Zhang X, Wan H, Pan X. 2005. Trends in total precipitation and frequency of daily precipitation extremes over China. J Climate. 18(7):1096–1108.
- Zhang Q, Huang X, Zhang G. 2017. Urban area extraction by regional and line segment feature fusion and urban morphology analysis. Remote Sens. 9(7):663.
- Zhang Q, Li J, Singh VP, Xiao M. 2013. Spatio-temporal relations between temperature and precipitation regimes: implications for temperature-induced changes in the hydrological cycle. Glob Planet Change. 111:57–76.