
 ?Mathematical formulae have been encoded as MathML and are displayed in this HTML version using MathJax in order to improve their display. Uncheck the box to turn MathJax off. This feature requires Javascript. Click on a formula to zoom.
Abstract
Global navigation satellite systems (GNSS) is widely utilized in marine applications for high accuracy vertical positioning. The errors introduced to charts by the present use of traditional shore-based discrete point chart datum (CD) can become a significant part of the total vertical error and deteriorates the vertical positioning accuracy estimated by GNSS technique. Therefore, a need for developing a CD in a continuous form is essential to replace the traditional CD so that it can be transformed from/to another continuous datum such as the reference ellipsoid (WGS84). The importance of the development of CD-to-WGS84 separation model is that it can be utilized by the hydrographers to develop an accurate vertical control for hydrographic surveys applications and can be utilized by the mariners to produce an accurate dynamic electronic navigation charts (ENC). In this paper, a Saudi continuous chart datum in the Arabian Gulf area is developed to provide CD-to-WGS84 separation model. It is shown that the Saudi continuous chart datum ranges from –14.96 m to –34.64 m and can be achieved with uncertainty ranges from 0.11 m to 0.16 m. The developed CD-to-WGS84 separation model in this paper can meet many maritime applications.
1. Introduction
Traditional vertical control for hydrographic surveying relied on the assumption that the height separation between datums and references are the same as at the nearest tide gage. Tide gauge data sets are then used to reduce bathymetric (seafloor depth) data to a discrete chart datum in this traditional approach. Now with global navigation satellite systems (GNSS), hydrographers can reduce bathymetric data directly with sufficient accuracy to continuous reference systems such the reference ellipsoid (WGS84). However, the bathymetric data shall be reduced to the national chart datum (CD) that represents the lowest astronomical tide (LAT) in Saudi Arabia established at specific time. Therefore, a need for developing a chart datum in a continuous form is essential so that it can be transformed from/to another continuous datum such as mean sea level (MSL) or another continuous reference system such as the reference ellipsoid (WGS84). This continuous chart datum is essential for many applications such as marine route surveys and real-time/post-processing kinematic solution to refer the bathymetric data to the chart datum if GNSS height exists. With the increasing use of accurate GNSS-based vertical positioning in marine applications, errors introduced to charts by the present use of traditional datums can become a significant part of the total vertical error. Therefore, a continuous reference surface for vertical control is better served by continuous datums and transforms (Dodd and Mills Citation2012).
A continuous chart datum is a two-dimensional reference surface relative to a continuous vertical reference datum such as the Lowest Astronomical Tide (LAT) in Saudi Arabia or the reference ellipsoid (WGS84). It is realized by numerous hydrographic organizations around the world that the hydrographic vertical datum, such as a chart datum, now requires a continuous treatment. These continuous chart datums exist, most notably at the National Oceanic and Atmospheric Administration (NOAA’s VDatum datum, Gesch and Wilson Citation2001), the United Kingdom Hydrographic Office (UKHO’s VORF datum, Adams Citation2006; Iliffe et al. Citation2013), the Service Hydrographique et Oceanographique de la Marine (SHOM’s BATHYELLI datum, Pineau-Guillou and Dorst Citation2011), the Australian Hydrographic Service (AHS’s AusCoastVDT, Keysers, et al. Citation2013), Canadian Hydrographic Service (CHS’s CCVD datum, (Lefaivre, et al. Citation2010; De Lange Citation2012; Robin et al. Citation2012, Citation2016; ) and Dutch and Belgium vertical reference datum (NEVREF, Slobbe, et al. Citation2018). In this paper, the Saudi coastal mapping and monitoring (SCM2RS) group takes a lead in developing a Saudi continuous chart datum (SCCD) using the data collected from Saudi coastal areas along with the hydrodynamic ocean model.
This paper investigates the development of the methods, processes and tools required for construction and management of the continuous surfaces in Saudi coastal areas. The objective is to develop a continuous chart datum for the Kingdom of Saudi Arabia (KSA) and is developed in the Arabian Gulf area as a case study. This seamless datum can be developed using data from the hydrodynamic ocean model to provide the continuous CD integrated with coastal discrete point CD values derived from tide gauges data sets to provide the SCCD (CD-to-WGS84 separation model). shows the relationship between different datums and surfaces.
Figure 1. The relationship between different datums and surfaces where SEP means the vertical separation between the datums, MSL is the mean sea level and MDT is the mean dynamic topography.
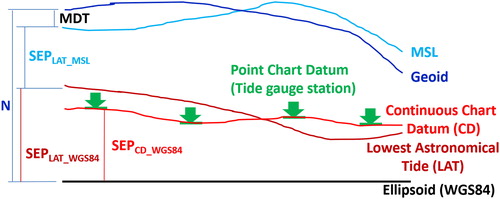
The importance of the development of SCCD (CD-to-WGS84 separation model) is that it can be utilized by the hydrographers to develop an accurate vertical control for hydrographic surveys applications and can be utilized by the mariners to produce an accurate dynamic electronic navigation chart (ENC).
2. Methodology
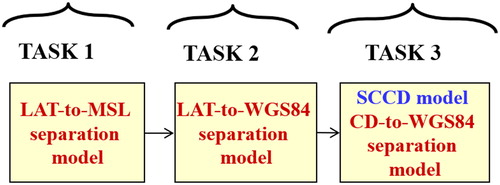
This research is performed over three major stages as shown in . The implementation of these four tasks can be performed through (recall ); (1) developing a model-based separation surface between LAT and MSL (LAT-to-MSL separation model), (2) developing a separation surface between LAT and WGS84 (LAT-to-WGS84 separation model) and (3) developing a Saudi continuous chart datum (SCCD) that represents the separation surface between CD and WGS84 as shown in . This figure summarizes the process of completing the project. The first task involves developing a LAT-to-MSL separation model using a hydrodynamic ocean model at every grid node of the ocean model. The second task involves LAT-to-WGS84 separation model using the integration of the LAT-to-MSL separation model with the sea surface height (SSH) model. The third task involves developing the SCCD that represents the CD-to-WGS84 separation model by adjusting (warping) the LAT-to-WGS84 separation model to honor the shore-based Chart Datum (CD) reference points established from the tide gauge stations observations.
Figure 2. Research process flowchart.
3. Lowest astronomical tide to mean sea level separation model (LAT-to-MSL)
The first task involves developing a LAT-to-MSL separation model using a hydrodynamic ocean model at every grid node of the ocean model. A continuous surface was developed based on the WebTide-based hydrodynamic ocean triangulated (TIN) model, that is a 3 D finite element, barotropic model (BIO 2018). The WebTide tidal prediction tool were developed by the Bedford Institute of Oceanography (BIO) and contains the diurnal and semi-diurnal harmonic tidal constituents of M2, K1, M3, M4, M6, MS4, N2, O1 and S2 to create a tidal prediction height. The tidal constituents for each node of the ocean model grid were utilized to predict tidal heights in Arabian Gulf. Then, the lowest astronomical tide (LAT) was estimated from the predicted data. This provided uncorrected separation height between the LAT and MSL at the ocean model grid nodes. To correct for the scale error exists in the ocean model, the correlation coefficient between the collocated nodes of LAT-to-MSL separations values estimated from the ocean model and tide gauge stations is estimated and considered as scale factor correction. Then, the estimated scale factor was utilized to estimate the corrected separation height between the LAT and MSL (LAT-to-MSL separation model). In summary, this task was performed as follow:
Predicting tidal heights of data points at every node of the ocean model grid,
Estimating the separation between the LAT and MSL to provide uncorrected LAT-to-MSL separation model at the ocean model grid nodes,
Estimating the LAT-to-MSL separation from the ocean model nodes located on the shores,
Predicting tidal heights of data points at every tide gauge station on shore (114 stations),
Estimating the LAT-to-MSL separation from the tide gauge stations (114 stations) located on the shores (collocated with onshore ocean model nodes),
Estimating the correlation coefficient between the collocated nodes of LAT-to-MSL separations values estimated from the ocean model and tide gauge stations that is considered as scale factor correction (0.93) for the estimated LAT-to-MSL separation model.
Correcting the estimated LAT-to-MSL separation model by the scale factor correction (0.93) to provide the corrected LAT-to-MSL separation model.
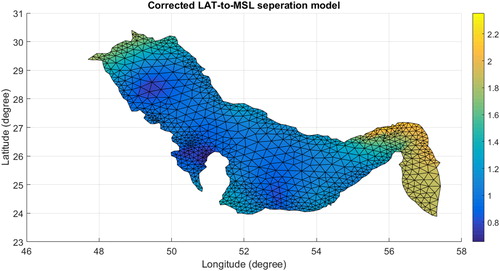
show the model estimated LAT-to-MSL separation model, the LAT-to-MSL separation at tide gauge stations, the LAT-to-MSL correlation coefficients between model and gauges collocated stations and the corrected LAT-to-MSL separation model with the, respectively. The corrected LAT-to-MSL separation model ranges from 0.65 m to 2.20 m. The differences between the corrected LAT-to-MSL separation and the estimated LAT-to-MSL separation ranges from -7 cm to -16 cm with standard deviation of ±2 cm. It is worth noting that the tide wave propagates to the gulf through the Strait of Hormuz as Kelvin wave coming from Gulf of Oman. This is because the size of the gulf is big enough to allow for Coriolis force effect and therefore Kelvin wave effect. Therefore, the corrected LAT-to-MSL separation illustrated in shows that the highest corrected LAT-to-MSL vertical separation is located in the eastern region of the Gulf (Strait of Hormuz) that exhibits high spatial variation, however, the lowest corrected LAT-to-MSL vertical separation is located in the central region of the Gulf that exhibits low spatial variation.
Figure 3. Estimated LAT-to-MSL separation model.

Figure 4. LAT-to-MSL separation at tide gauge stations.
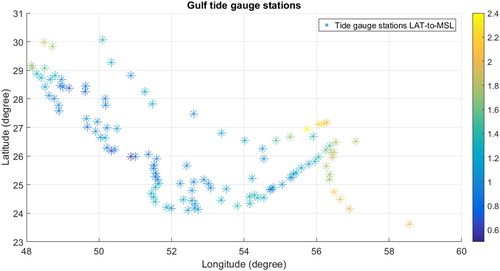
Figure 5. LAT-to-MSL correlation coefficients between model and gauges collocated stations.
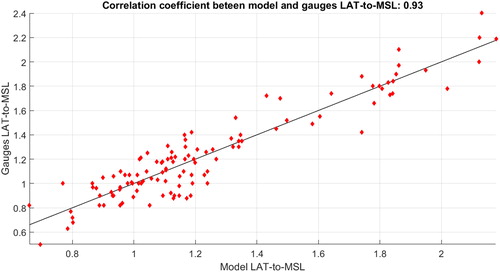
Figure 6. Corrected LAT-to-MSL separation model.
4. Lowest astronomical tide to world geodetic system 84 separation model (LAT-to-WGS84)
The second task involves LAT-to-WGS84 separation model using the integration of the LAT-to-MSL separation model with the EGM08 geoid model (Pavlis et al. Citation2012) and mean dynamic topography (MDT) DTU15MDT model (Knudsen et al. Citation2016). In this task, the geoid undulations and MDT were estimated at ocean model grid nodes and were utilized along with LAT-to-WGS84 separation model to bring the MSL to WGS84 datum. This task was performed as follow:
Estimating the geoid undulations N and MDT at the ocean model grid nodes using EGM08 model and DTU15MDT model respectively,
Adjusting the LAT-to-MSL separation model by geoid undulation N and MDT to provide LAT-to-WGS84 at the ocean model grid nodes,
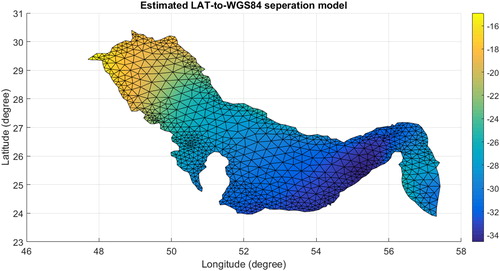
show the geoid undulations, MDT and the LAT-to-WGS84 separation model, respectively. The LAT-to-WGS84 separation model ranges from –34.60 m to –14.91 m. The spatial variation of the LAT-to-WGS84 separation represents the combination effect of three factors; (1) the mass distribution changes, which is reflected by the geoid model, (2) the LAT spatial variation from the hydrodynamic model, and (3) the meteorological change effect from the MDT model. The LAT-to-MSL separation illustrated in shows that the highest absolute LAT-to-WGS84 vertical separation is located in the eastern region of the Gulf (Strait of Hormuz region), however, the lowest absolute LAT-to-MSL vertical separation is located in the northeast region of the Gulf (Shatt Al-Arab region).
Figure 7. Geoid undulations N using EGM08 model.
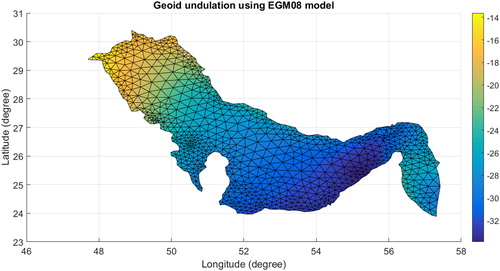
Figure 8. MDT from DTU15MDT model.
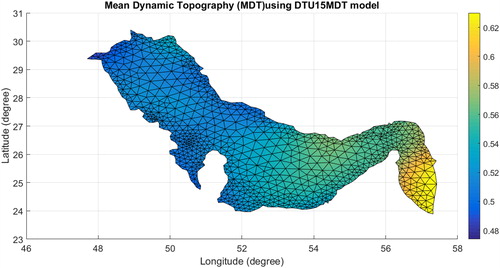
Figure 9. LAT-to-WGS84 separation model.
5. Chart datum to world geodetic system 84 separation model (CD-to-WGS84)
It this task, the main objective is to bring the LAT to CD. In fact, the Saudi shore-based chart datum (CD) reference points represent the LAT estimated at a specific time at tide gauge stations distributed along the shore. Therefore, the objective is to adjust the LAT-to-WGS84 separation model to honor the Saudi shore-based Chart Datum (CD) reference to provide the CD-to-WGS84 separation model at the ocean model grid. The developed CD-to-WGS84 separation model, namely SCCD, was constrained by the CD reference points at the shores and the interior model grids points were respectively corrected. This task was performed as follow:
Estimating the difference between the model-based LAT-to-WGS84 values CD-to-WGS84 values at the Gulf shoreline gauges.
Interpolating the differences at the edges to the model interior model grids modes using ordinary kriging method,
Adjusting (warping) the LAT-to-WGS84 separation model interior grid nodes with the fitted edges to honor the Saudi CD and provide the CD-to-WGS84 separation model, so called SCCD.
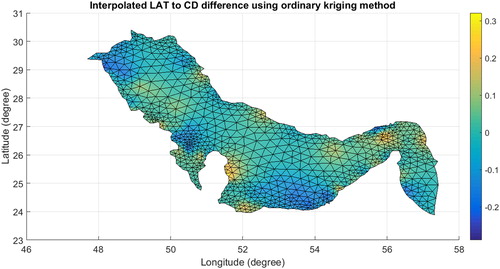
shows the difference between the LAT-to-WGS84 separation model edges and the shore-based Chart Datum (CD) reference points. shows the interpolated difference between LAT and CD at model grid nodes model using ordinary kriging method. The LAT to CD differences shown in ranges from –0.29 m to 0.32 m and with the absolute highest value at the shoreline region and spatially distributed within the entire Gulf using the kriging method to reach the lowest values in the central region. The advantage of the kriging interpolation method over deterministic methods (such as Inverse distance weighted (IDW) method) is that it is considered as a geostatistical method that provides the estimated interpolated value along with its corresponding uncertainty (variance). Kriging assumes that the distance between sample points reflects a spatial correlation that can be used to explain variation in the surface. The Kriging method fits a mathematical function to a specified number of known control points to determine the estimated interpolated value for each location of the model grid nodes.
Figure 10. LAT to CD differences at gauges (114 stations).
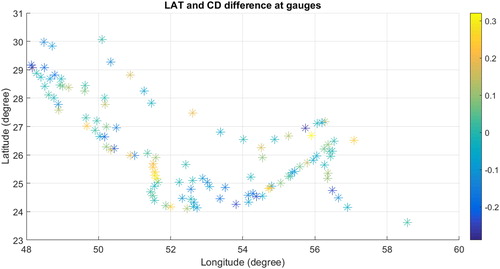
Figure 11. Interpolated difference between LAT and CD at model grid nodes model using ordinary kriging method.
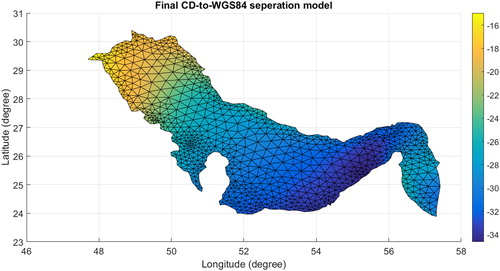
Finally, shows the warped final CD-to-WGS84 separation model that honor the onshore chart datum reference points. It is shown that the estimated the final separation CD-to-WGS84 model values ranges from -14.96 m to -34.64 m. The spatial variation of the CD-to-WGS84 separation model is dominated by the mass changes effect, CD changes effect and meteorological changes effect in the Gulf area. The CD-to-MSL separation illustrated in shows that the highest absolute CD-to-WGS84 vertical separation is located in the eastern region of the Gulf (Strait of Hormuz region), however, the lowest absolute CD-to-MSL vertical separation is located in the northeast region of the Gulf (Shatt Al-Arab region).
Figure 12. Final CD-to-WGS84 separation model.
6. Uncertainty of final CD-to-WGS84 separation model
In summary, the CD-to-WGS84 separation model shown in can be estimated from the combination of the ocean model (WebTide TIN model), geoid model (EGM08), MDT model (DTU15MDT) and warped to honor coastal CD using ordinary kriging method. The propagated errors associated with CD-to-WGS84 separation model were estimated in this research using error propagation principle where that the uncertainty can be estimated by:
(1)
(1)
where is the propagated uncertainty for CD-to-WGS84 separation model,
is the uncertainty of the geoid model,
the uncertainty of the MDT model and
is uncertainty of the kriging model.
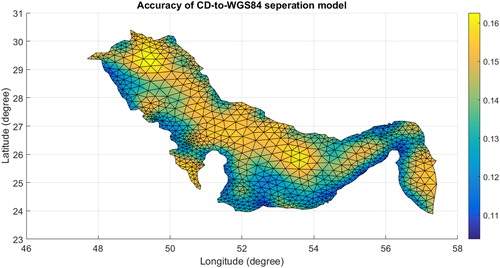
shows the propagated errors for CD-to-WGS84 separation model. It is shown that the uncertainty of final separation CD-to-WGS84 ranges from 0.11 m and 0.16 m (1σ). It is shown in that the maximum uncertainty occurs most probably in offshore areas and in the areas with no constrains (no tide gauges). Therefore, the developed CD-to-WGS84 separation model in this paper can meet many maritime applications such as many hydrographic surveying applications. For example, the developed CD-to-WGS separation model can be employed in hydrographic processing software such as CARIS or HYPACK to estimate the bathymetry referenced to the chart datum when high precision GNSS RTK system is considered as a vertical control system (instead of tide gauges) for the surveyed area with in the Gulf region. Moreover, the developed CD-to-WGS84 separation model and can be utilized by the mariners to produce an accurate dynamic electronic navigation charts (ENC) with in the Gulf region.
Figure 13. Accuracy of final CD-to-WGS84 separation model.
7. Conclusion and recommendation
In this paper, an accurate Saudi continuous chart datum in the Arabian Gulf area is developed using the combination of the ocean model (WebTide TIN model), geoid model (EGM08), MDT model (DTU15MDT) and warped to honor coastal CD using ordinary kriging method. It is shown that the Saudi continuous chart datum ranges from −14.96 m to −34.64 m and can be achieved with uncertainty ranges from 0.11 m to 0.16 m. The importance of the development of Saudi CD-to-WGS84 separation model with high accuracy (0.13 m in average) is that it can be utilized by the hydrographers to develop an accurate vertical control for hydrographic surveys applications and can be utilized by the mariners to produce an accurate dynamic electronic navigation charts (ENC).
Acknowledgment
The authors acknowledge with thanks the Deanship of Scientific Research (DSR), King Abdulaziz University, Jeddah, under grant no. 1-150-36-RG. for financial and technical support.
Disclosure statement
No potential conflict of interest was reported by the authors.
Additional information
Funding
References
- Adams R. 2006. The Development of a Vertical Reference Surface and Model for Hydrography– a Guide. XXIII International FIG Conference. Munich, Germany, October 8–13, 2006.
- BIO, Bedford Institute of Oceanography 2018. WebTide Tidal Prediction Model (V0.7.1). 12 31. http://www.bio.gc.ca/science/research-recherche/ocean/webtide/index-en.php.
- De Lange B. 2012. Vertical Datum Separation Models for the British Columbia Coast. CHC 2012 Conference Proceedings. Niagara Falls, ON, Canada.
- Dodd D, Mills dj. 2012. Ellipsoidally Referenced Surveys Separation Models. FIG Working Week. Rome, Italy, 6-10 May.
- Gesch D, Wilson R. 2001. Development of a seamless multisource topographic/bathymetric elevation model for Tampa Bay. Mar Technol Soc J. 35(4):58–64.
- Iliffe JC, Ziebart MK, Turner JF, Talbot AJ, Lessnoff AP. 2013. Accuracy of vertical datum surfaces in coastal and offshore zones. Surv Rev. 45(331):254–262.
- Keysers JH, Quadros ND, Collier PA. 2013. Developing a method to establish a common vertical datum before integrating land height data with near‐shore seafloor depth data. Report prepared for the Commonwealth Government of Australia, Department of Climate Change and Energy Efficiency
- Knudsen P, Andersen OB, Maximenko N. 2016. The updated geodetic mean dynamic topography model – DTU15MDT. ESA Living Planet Symposium. Prague, Czech Republic, 9-13 May.
- Lefaivre D, Dodd A. Godin D, Herron T, MacAulay P, Sinnott D. 2010. The Continuous Vertical Datum Canadian Waters Project (Beginnings, Vision, Methods and Progress). CHC 2010 Conference Proceedings. Quebec, QC, Canada.
- Pavlis N, Holmes S, Kenyon S, Factor J. 2012. The development and evaluation of the Earth Gravitational Model 2008 (EGM2008. J Geophys Res Solid Earth. 14(B4):1–38." doi:
- Pineau-Guillou L, Dorst L. 2011. Creation of vertical reference surfaces at sea using altimetry and GPS. Ann Hydrogr 8(777):10.1–10.7.
- Robin C, Godin A, Macaulay P, De Lange B, Lefaivre D, Herron T, Sinnott D, Ballantyne A, Maltais L, Veronneau M. 2012. The Canadian Hydrographic Continuous Vertical Datum: Methodology and Accuracy. CHC 2012 Conference Proceedings. Niagara Falls, Canada 15-17 May.
- Robin C, Nudds S, MacAulay P, Godin A, De Lange B, Bartlett J. 2016. Hydrographic vertical separation surfaces (HyVSEPs) for the tidal waters of Canada. Mar Geod. 39(2):195–222.
- Slobbe D, Sumihar J, Frederikse T, Verlaan M, Klees R, Zijl F, Farahani H, Broekman R. 2018. A Kalman filter approach to realize the lowest astronomical tide surface. Mar Geod. 41(1):44–67.