
 ?Mathematical formulae have been encoded as MathML and are displayed in this HTML version using MathJax in order to improve their display. Uncheck the box to turn MathJax off. This feature requires Javascript. Click on a formula to zoom.
Abstract
The focal point of this study is to assess the efficacy of a state-of-the-art optimization technique namely, particle swarm optimization (PSO) for enhancing the performance of the artificial neural network (ANN) in modeling the seismic landslides at Ludian districts, China. Twelve geological and hydrological landslide-conditioning factors namely, elevation, lithology, slope degree, slope aspect, stream power index, peak ground acceleration, topographic wetness index, distance to river, distance to road, distance to fault, normalized difference vegetation index and plan curvature were considered within a geographic information system (GIS). After achieving the optimal structure of the multilayer perceptron neural network, the PSO algorithm was applied to improve its efficiency. The landslide susceptibility maps were generated in a GIS environment and area under the curve (AUC) criterion was used to assess the integrity of employed predictive models. The results showed that after applying the PSO algorithm, AUC experiences a significant increase from 0.765 to 0.825 in the validation phase. Moreover, respective AUCs of 0.812 and 0.828 obtained for the training phase of ANN and PSO-ANN reveal the efficiency of the proposed algorithm in improving the ANN accuracy.
1. Introduction
One of the most recent well-developed techniques in training database (e.g. providing relationships between inputs and outputs of the problems) is set based on the biological neuron, and it is called artificial neural network (ANN) (Asadi et al. Citation2011). The ANN is first proposed by McCulloch and Pitts (Citation1943) and followed by many researchers (e.g. Ghorbani et al. Citation2018; Nguyen et al. Citation2018; Van-Dung et al. Citation2018; Binh Thai et al. Citation2019). However, the first person that suggested this technique to be suggested for training a problem was Hebb (Citation1949). In general, there are some rules in ANN which are mainly based on direct observations and hypothesis of neuro-physiologic nature. The learning systems of the ANN (i.e. used for finding links in a particular training dataset) is well discussed by Mosallanezhad and Moayedi (Citation2017) and Moayedi et al. (Citation2018b).
Landslide is reported to be one of the most widespread geological disaster causing severe loss of property and human life worldwide (Binh Thai et al. Citation2018; Greco Citation2018). China has been recognized as a landslide-prone country, particularly those triggered by significant earthquakes. Generally, strong ground motions trigger heavy landslides which cause more intense damages than earthquake its self (Zhong-sheng Citation2003; Wang et al. Citation2015b). An M6.5 earthquake occurred on 3 August 2014 in Ludian district of Yunnan province, China. Its epicenter was located at 27°1′ N and 103°3′ E, and the depth of the aftershocks mainly varied in the range of [3–15 km]. This earthquake killed 617 people and caused 3143 injuries. Furthermore, thousands of houses ruined or seriously damaged by the Ludian earthquake. However, many theories and methods have been presented in this field; however, seismic landslide assessment is still a serious problem in the world. Thus far, different landslide assessment methods have been developed to appraise the risk of landslide occurrence in a particular study area. Jing-Chun et al. (Citation2015) provided the landslide susceptibility map of the Ludian after the Ludian 2014 earthquake by using random forest model. With approximate accuracy of 92%, they concluded that 80% of the marked landslides are in the areas that have been categorized as moderate and high landslide risk. Relying on the landslide hazard mapping as an effective way to examine a particular place entails providing a real dataset and implementing the approaches at an appropriate working scale (Dong et al. Citation2017). The most influential factors affecting the likelihood of landslide occurrence are elevation, aspect, slope, curvature, soil type, lithology, distance from predefined cells to a fault, rivers and roads, vegetation density, stream power index (SPI) and topographic wetness index (TWI). Plenty of works such as Pradhan and Lee (Citation2010) and Pourghasemi et al. (Citation2013) have argued for, and introduced formulas or landslide susceptibility maps to provide a reliable approximation of the possibility of landslide occurrence in the future.
2. Literature review of landslide susceptibility mapping
Moreover, numerous efforts have outlined the landslide risk assessment by employing simple predictive methods like statistical index (SI), frequency ratio (FR) or regression-based approaches (Demir et al. Citation2015; Chen et al. Citation2016). In this sense, Chen et al. (Citation2015) employed SI, FR and index of entropy (IOE) models for landslide risk zonation of Baozhong Region of China. In this study, 70% of the marked landslides were selected for training the methods and the remaining 30% landslides were used to calculate the areas under the curve (AUC) index to evaluate the accuracy of the applied models. According to their results, FR gives the highest prediction accuracy (84.95%), followed by SI (82.37%) and IOE (82.05%). Also, Wang et al. (Citation2015a) used the index of entropy (IOE) and certainty factor (CF) models to produce the landslide susceptibility map of Qianyang County of China. They considered fifteen landslide conditioning factors including slope angle, slope aspect, general curvature, plan curvature, profile curvature, altitude, distance to faults, distance to rivers, distance to roads, the sediment transport index (STI), the SPI, the TWI, geomorphology, lithology and rainfall. Respective prediction accuracies of 82.32% and 80.88% revealed the superiority of the CF compared to IOE.
In order to achieve more accurate results, soft computing techniques have been used and emerged as capable tools for landslide risk zonation (Tien Bui et al. Citation2018). Pradhan and Lee (Citation2010) applied a back-propagation neural network to evaluate the risk of landslides in Cameron Highland, Malaysia. They could successfully produce a landslides hazard map with an accuracy rate of 83% (Pradhan and Lee Citation2010). In another case, Oh and Pradhan (Citation2011) used the Adaptive neuro-fuzzy inference system (ANFIS) tool with four membership functions, including triangular, trapezoidal, generalized bell and polynomial and introduced ANFIS as a promising tool in local landslide susceptibility assessment. Also, numerous attempts have been carried out to compare different developed models. Li et al. (Citation2017) the efficiency of three advanced intelligent models namely, ANFIS combined with frequency ratio (ANFIS-FR), generalized additive model (GAM) and support vector machine (SVM), was compared in landslide susceptibility analysis in Hanyuan County, China. According to their findings, SVM outperforms ANFIS-Fr and GAM with respective accuracies of 0.875, 0.851 and 0.846. In another research by Bui et al. (Citation2016), five state-of-the-art predictive methods including SVM, multilayer perceptron neural networks (MLP Neural Nets), radial basis function neural networks (RBF Neural Nets), kernel logistic regression (KLR) and logistic model trees (LMT) were applied to model the risk of landslide in Son La hydropower basin, Vietnam. To select the most compatible subset of conditioning factors, they used a k-fold crossvalidation technique. The results of this article revealed that MP and SVR could present the most accuracy of prediction.
Likewise, new evolutionary algorithms have been extensively used to improve the applicability of typical intelligent models (Tien Bui et al. Citation2018; Jaafari et al. Citation2019). In this sense, Moayedi et al. (Citation2018a), evaluated the effectiveness of MLP neural network against its improved version, (i.e. ANN synthesized with particle swarm optimization algorithm, PSO-ANN), in landslide hazard assessment at Kermanshah province, west of Iran. They used twelve landslide conditioning factors of elevation, slope aspect, slope degree, curvature, soil type, lithology, distance to road, distance to river, distance to fault, land use, SPI and TWI to create the spatial database. As the main result of this research, they introduced the PSO as a promising optimization algorithm for landslide hazard assessment. Moreover, Tien Bui et al. (Citation2016) could successfully use differential evolution (DE) optimization method to find the optimal tuning parameters of least-squares support vector machines (LSSVM) model in the spatial prediction of shallow landslides in central Vietnam. Their results revealed the superiority of the proposed models (with the approximate accuracy of 82%) in comparison with SVM, MLP neural networks and J48 decision trees. The applicability of three optimization methods namely, genetic algorithm (GA), DE and PSO synthesized with the ANFIS for landslide spatial modeling was evaluated by Li et al. (Citation2017). Referring to the acquired AUC values, they introduced the ANFIS-DE (AUC = 0.844) as the most accurate ensemble data mining technique, compared to ANFIS-GA (AUC = 0.821) and ANFIS-PSO (AUC = 0.780). Li et al. (Citation2017) proposed a novel GA for optimal selection of landslide conditioning factors in Wenchuan, Ludshan and Ludian areas, China. Based on the results, the proposed method showed slightly higher robustness compared to the typical GA with respective AUC values of 93.48% and 93.47%, 83.48% and 83.45% and 82.28% and 82.21%, respectively, in Wenchuan, Lushan and Ludian districts.
In this research, the PSO evolutionary algorithm is combined with a typical ANN to enhance its efficiency for regional hazard assessment of earthquake-induced landslide in Ludian area, China. To do so, we considered twelve landslide conditioning factors namely, elevation, slope degree, lithology, peak ground acceleration (PGA), SPI, TWI, distance to road, distance to river, distance to fault, normalized difference vegetation index (NDVI), slope aspect and plan curvature. The optimal structure of both MLP and PSO methods were determined by a trial and error process. The landslide susceptibility maps were developed in GIS, and the results are discussed. Hereafter, five general sections form the body of this article. The study area is described in section 3. Data preparation and the spatial interaction between the landslide and its causative factors is presented in section 4. The description of the employed intelligent methods is given in section 5. Following this, the obtained results are presented and discussed in section 6. Eventually, section 7 is the conclusion giving a brief report of the outcomes of the current research.
3. Study area
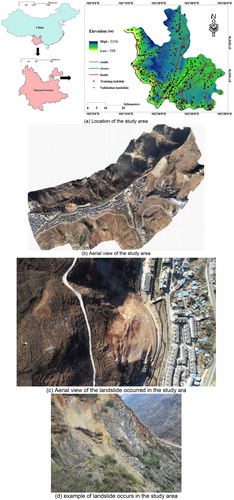
The study area is located in Ludian district, Yunnan province which is the northernmost province of China (). The area of the selected region is roughly 1487 km2 and lies within the east longitude 103°09' to 103°40' and north latitude 26°59' to 27°32'. Topographically, the altitude ranges from 568 to 3356 m, under the monsoon climate. Aerial view of the small portion of the study area is shown in . An example of landslide occurs in the study area is also provided in . According to the geology map of Ludian county, the majority of the area lies on the shale, sandstone and limestone bedrock. In addition, Dongchuan and Jialing Jian group, Dolomite, Quartzose, sandstone and Chert Limestone are common rocks in this region. The slope varies in the approximate range of 0–90° so that more than half of this area has the slope lower than 15°. Meanwhile, the average annual values of temperature and rainfall are approximately 12.1 °C and 924 mm. As illustrates, most of the landslides have occurred along the territorial roads and rivers as well as the recognized faults. Notably, the landslides were categorized as rock falls and shallow, disrupted landslides from steep slopes. As for their size, they mainly cover the areas between 76 m2 and 0.45 km2. For more details, readers may refer to Zhou et al. (Citation2016).
Figure 1. Location of the study area and spatial distribution of landslides.
4. Data preparation and conditioning factors
Landslide is a prevalent disaster in China, especially in the intended area, due to the appreciable number of strong earthquakes in this country. Providing the landslide inventory map is a crucial step in any kind of landslide hazard assessment (Ercanoglu and Gokceoglu Citation2004). In this work, it involved utilizing the recorded information, aerial photos interpretation and field monitoring using GPS in 1:25,000 scale (see ). Overall, 458 landslide points were marked. Then, the landslide inventory map was divided into two separate groups containing 366 landslides (80% of whole landslide locations) for training the proposed models and 92 landslides (20% of whole landslide locations) for evaluating the accuracy of their estimations. In the following, considering the landslide-causative parameters of the region and also regarding the occurred earthquake, twelve of geological and hydrological landslide-triggering factors namely, elevation, slope degree, lithology, PGA, SPI, TWI, distance to road, distance to river, distance to fault, NDVI, slope aspect and plan curvature were considered within a geographic information system (GIS). After the preparation process, the mentioned GIS rasters were generated from their initial formats (i.e. polygons, polylines, points and tabular data). The spatial distribution of the identified landslides on the proposed conditioning factors is shown in . Moreover, details the distribution of the landslides based on the subclasses of each effective factor, as well as the FR of them.
Figure 2. Input data layer maps: (a) elevation, (b) slope degree, (c) lithology, (d) PGA, (e) SPI, (f) TWI, (g) distance from road, (h) distance from river, (i) distance from fault, (j) NDVI, (k) slope aspect, (l) plan curvature.
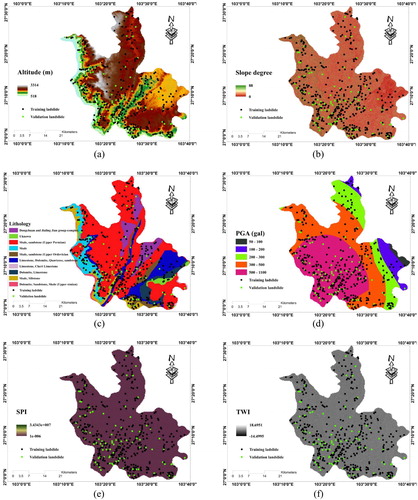
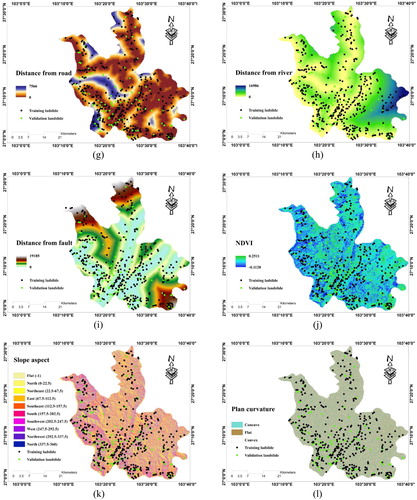
Table 1. Spatial relationship between the landslide and its causative factors.
The altitude layer of Ludian county was extracted from the digital elevation model (DEM) of Yunnan province acquired from Landsat 8 imagery. As stated supra, minimum altitude is 568 m and altitudes more than 2300 m are rarely observed (). As denotes, more than 80% of the identified landslides have occurred in the regions with an altitude between 1300 and 2300. Also, terrain slope (), slope aspect () and plan curvature () maps were subsequently created from DEM. Slope degree changes in the range of 0° to 87°. Notably, approximately equal values of Percentage of domain and Percentage of prone pixels have been acquired for this factor. This is while the acquired FR = 1.32 indicates a high risk of a landslide for areas with a slope more than 62°. According to the lithology map of Ludian, diverse types of bedrocks including Dongchuan and Jialing Jian group, Dolomite, Quartzose, sandstone and Chert Limestone form the geology of the study area. In this regard, 46.52% and 13.69% of the slope failures have been observed on the bedrocks labelled as ‘Shale and sandstone (Upper Permian)’ (FR = 0.85) and ‘Shale’ (FR = 1.70), respectively. shows the PGA map of the Ludian earthquake we used to consider the effect of this event. Note that, PGA is the most commonly used criterion to determine the shaking intensity of the damaged area (Nath Citation2004). For this study, earthquake records were used to draw the PGA map in a GIS environment. Not surprisingly, the most number of landslide-prone pixels (56.80% and FR = 1.37) is observed for the regions with the highest PGA values with (i.e. in the vicinity of the epicenter). Getting away from the epicenter the mentioned value decreases as low as 0.22% at the right margin of the area. Also, to investigate the effects of geo-morphometric conditions, we calculated two broadly used secondary factors namely, SPI () and TWI (). The SPI and TWI parameters, respectively, symbolize the erosion power of streams and the amount of accumulated water in a place, which are expressed by EquationEquations (1)(1)
(1) and Equation(2)
(2)
(2) (Beven and Kirkby Citation1979; Moore et al. Citation1991):
(1)
(1)
(2)
(2)
wherein, α stands for the specific catchment, and β denotes the gradient.
To examine the effect of linear phenomena (e.g. the roads), three factors namely, distance from roads (), distance from rivers () and distance from faults () are used as the independent landslide parameters in this research. As describes, the distance of the farthest point from the road, river and fault lineaments equals to 7566 m, 16,986 m and 19,185 m. Besides, a noticeable number of earthquake-induced slope failures, particularly in the central and western Ludian, have occurred along with the roads (FR = 1.24), rivers (FR = 1.42) and faults (FR = 1.28) in this area. More specifically, between 40% and 50% of prone pixels have crossed with the first sub-class of these factors (). As for NDVI factor which indicates a quantitative evaluation of the plants growth and biomass (Yilmaz Citation2009; Wang et al. Citation2018), it was created through the SPOT5 images processing. In general, when NDVI approaches 1, it describes a dense vegetation cover (rainforest for instance) and values close to zero correspond to barren areas, and further, negative values of NDVI indicate the water bodies. In the case of this study, NDVI varies from -0.1120 to 0.2511 (). Referring to , no significant distinction is observed between the distribution of the landslides based on the NDVI classification. As explained previously, the slope aspect map () was derived from DEM of Ludian county and classified as: North (0–22.5°), North–East (22.5–67.5°), East (67.5–112.5°), South–East (112.5–157.5°), South (157.5–202.5°), South–West (202.5–247.5°), West (247.5–292.5°), North–West (292.5–337.5°) and North (337.5–360°). Roughly 47% of the study area is categorized as Flat which contains the same share of the landslide points. This is while the analysis of FR between earthquake-induced landslides and different aspects of slope demonstrate that North–West (FR = 1.12) has the largest frequency of landslide. In addition, plan curvature factor was taken into consideration to examine the effect of the convergence or divergence in declivitous streams regarding the erosion of slopes (Ercanoglu and Gokceoglu Citation2002). In the current research, plan curvature map produced from DEM and stratified as concave, flat and convex (). This is noteworthy that approximately 27%, 47% and 26% of the study area is labelled as concave (FR = 1.03), flat (FR = 0.99) and convex (FR = 0.99; ).
5. Methodology
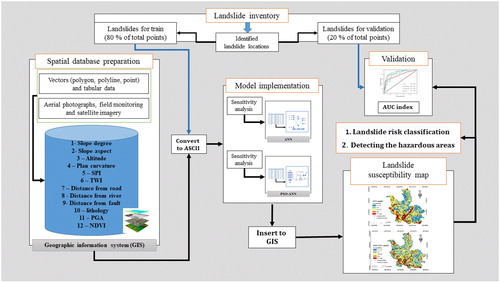
As stated supra, the main effort of this research is to enhance the applicability of ANN for analyzing the earthquake-triggered landslide risk by means of PSO. To this end, 12 landslide-related factors (e.g. influential factors affecting the landslide) were selected as the input layers. To provide the spatial database, factors with basic formats (point, polygon, polyline) were converted to raster and extracted for the intended area. Similar to Wu et al. (Citation2014) and Ahmouda et al. (Citation2018), to reveal the spatial relationship between the distribution of landslide and its causative factors, 80% of landslide points (i.e. 366 landslides) opted for the training process and the remaining 20% (i.e. 92 occurrence point) were used to validate the performance of ANN and PSO-ANN models. Then, the proposed predictive methods were implemented to estimate the landslide susceptibility values. portrays the procedure we carried out in this work.
Figure 3. Graphical methodology of applied procedure for landslide hazard zonation.
5.1. Multilayer perceptron
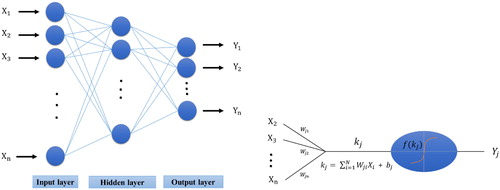
Recent years have witnessed the application of computational intelligence, especially ANN for solving various engineering problems. Inspired by the human neural network ANN was first proposed by McCulloch and Pitts (Citation1943), and first trained by Hebb (Citation1949) to establish the non-linear equations between a set of input–output data (Wang Citation2003). Compared to the statistical methods, the remarkable advantage of ANNs lies in the facility of implementation. In other words, numerical data do not need to be classified to be used by ANN. MLP is known as a robust type of ANNs. As the name connotes, the MLP is constructed by three layers, namely the input layer, hidden layer and output layer containing the computational nodes. presents a graphical description of the MLP performance. In overall, MLP determines the effect of each landslide-conditioning factors through assigning weights and biases. Assuming the input parameter X, it is first multiplied by the weight (W) and then the bias (b) is added. In the last step, an activation function (f) is applied to the obtained value to produce the local output ().
Figure 4. The overall structure and learning mechanism of MLP.
In this study, the activation function (f(x)) is selected to be Tan-sigmoid (Tansig), due to its satisfying performance in previous studies (Seyedashraf et al. Citation2018). This function is expressed as follows:
(3)
(3)
5.2. PSO algorithm
PSO is a robust evolutionary algorithm that is first proposed by Eberhart and Kennedy (Citation1995). The higher learning speed and requiring less memory are the remarkable excellence of the PSO, compared to other optimization algorithms such as GA. During the PSO execution, the best global (gbest) positions and the most convenient personal (pbest) are found by the particle activity. EquationEquations (4)(4)
(4) and Equation(5)
(5)
(5) formulate the position and velocity of the particles, respectively.
(4)
(4)
(5)
(5)
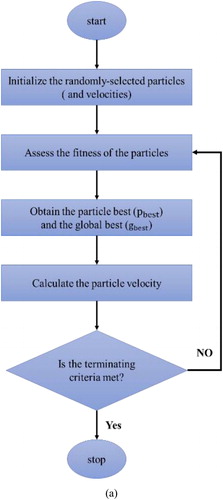
where terms X1, X2, V1 and V2 stand for the existing and new position and velocity of each particle, respectively. Also, C1 and C2 symbolize two positive and constant acceleration values that are selected by the operators. The terms r1 and r2 represent random values which can be defined by the form of (0,1) and ω indicates the inertia weight. The schematic description of PSO implementation is provided in .
Figure 5. General mechanism of (a) PSO algorithm and (b) PSO-ANN method.
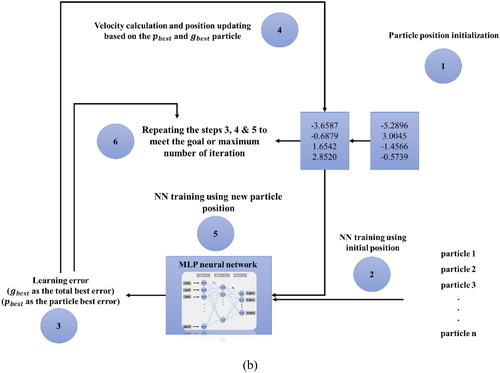
5.3. Combination of ANN with PSO
illustrates the combination process of the PSO algorithm and ANN model. Like other evolutionary algorithms, here the first step is to initialize the particle's position that is chosen randomly. Notably, the mentioned attributes stand for the ANN parameters (e.g. biases and weights). In the following, the PSO performs with initial values of weights and biases. Then, an error criterion (MSE for example) is computed to evaluate the executed model. Two parameters and
which, respectively, symbolize the lowest error obtained by each particle and all particles until that moment, are used to update the velocity equation. The accuracy is projected to increase in each iteration. Meanwhile, if one of the stopping conditions met, the algorithm will be finished. The most appropriate parameters of ANN are determined at the end of this process. Further information about this method is well-detailed in Li et al. (Citation2017).
6. Results and discussion
The results of this study including the optimization process of the ANN and hybrid (PSO-ANN) methods, produced landslide hazard maps and the validation process has been presented in this section. The required dataset for developing the mentioned networks was provided through converting GIS spatial database to ASCII format. A landslide distribution map was used to compose the response variable and 12 inputs (e.g. elevation, slope degree, lithology, PGA, SPI, TWI, distance to road, distance to river, distance to fault, NDVI, slope aspect and plan curvature) were used to train the intelligent models. During the implementation of artificial intelligence tools, at least two groups of data are needed. The first part which called training data is the chief part of the dataset and are used to train the models. The learning process includes adjusting interlayer weights and biases to reduce the error in each iteration. The trained network must be evaluated by the so-called second dataset ‘testing data’. Remarkably, the testing data are different from the first phase. Dividing the dataset was done by 80 and 20 percent ratio (366 and 92 landslide cases), respectively, for the train and test phase. Moreover, achieving the appropriate network architecture is a crucial task in the field of soft computing tools utilization. To this aim, an extensive trial and error process was carried out for ANN and PSO-ANN methods. The mean square error (MSE) was used to evaluate the performance of the models aforementioned. The results of this process are presented in the next sections.
6.1. Artificial neural network
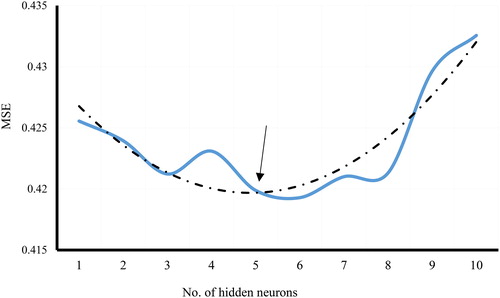
To find the best ANN structure, an MLP network was tested by ten different numbers of neurons in its unique hidden layer (i.e. hidden neurons). Based on the calculated error, MLP with five and seven hidden neurons seems to be suitable; however, the lowest error observed for six neurons. depicts the result of the applied sensitivity analysis. Hence, we used an MP with the overall structure of 12 × 6 × 1. It represents the network with 12, 6 and 1 neurons in its input, hidden and output layers, respectively.
Figure 6. The sensitivity analysis carried out for ANN, based on the number of hidden neurons.
6.2. PSO-ANN model
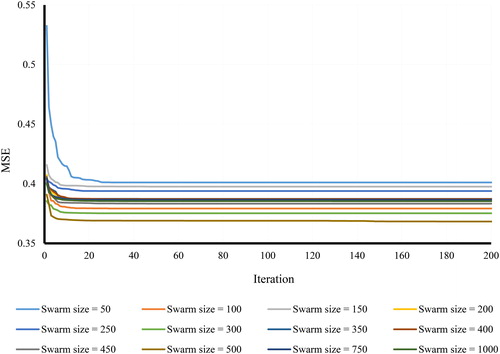
Considering the previous explanation about the PSO algorithm, apart from the number of iterations, several characteristics such as swarm size, inertia weight and coefficient of velocity equation also affect the performance of an applied PSO algorithm. In this subject and due to the variety of determinant factors, the authors decided to use similar values that have been successfully assigned to previous PSO works. The coefficient of velocity equation and inertia weight were considered to receive the values 2 and 0.25, respectively (Clerc and Kennedy Citation2002). In the next step, similar to ANN, a sensitivity analysis was carried out to achieve the most suitable swarm size. The PSO algorithm was tested with twelve different number of swarms (from 50 to 1000) and the MSE was calculated for 1000 iterations. Since the MSE reduction process remained completely steady after the 150 iterations, presents the results of this process until the 200th iteration. This is while the main MSE reduction has occurred in the first 50 iterations for all swarm sizes. Based on the computed error, the PSO-ANN model with 500 swarms yields the most accurate results.
Figure 7. The sensitivity analysis carried out for PSO-ANN model based on different swarm size.
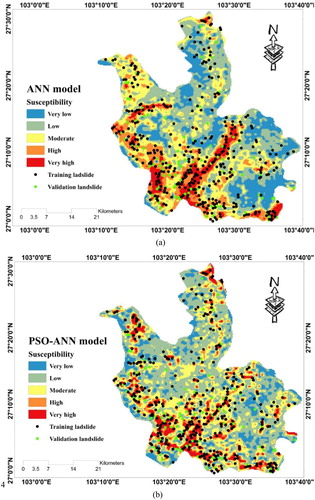
The landslide susceptibility maps were drawn based on the ANN and PSO-ANN estimation are presented in . A natural break classification was considered to classify the resulted maps into five susceptibility groups namely, ‘Very low’, ‘Low’, ‘Moderate’, ‘High’ and ‘Very high’ (Xu et al. Citation2012; Pourghasemi et al. Citation2013). The results represent an acceptable performance rate for both used techniques. According to , the main landslide distribution path (along with the linear phenomena, for example) have been well recognized by either ANN ad PSO-ANN models. In this regard, the areas containing a larger number of landslides (i.e. higher landslide density) are categorized as perilous (i.e. High and Very high classes) in both landslide hazard maps.
Figure 8. Landslide hazard map developed by (a) ANN and (b) PSO-ANN models.
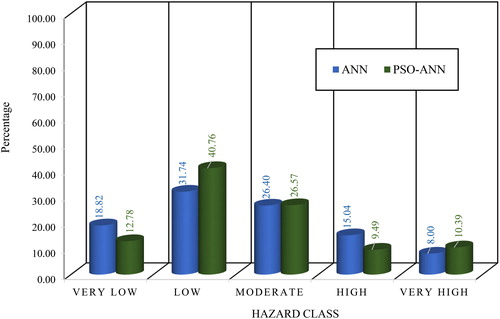
For more details, the percentage of the pixels occupied by each susceptibility class is calculated and presented in the form of a column chart in . According to this figure, roughly half of the studied area (50.56% and 53.54%, respectively, for ANN and PSO-ANN) is known to be relatively safe (Very low and Low hazard classes). Likewise, both predictive models have estimated that roughly 27% of the area is under the moderate risk of landslide occurrence. Moreover, 23.04% and 19.88% of the Ludian county is recognized as the dangerous landslide regions, respectively, by ANN and PSO-ANN models.
Figure 9. Column chart showing the percentage of landslide hazard classes over the study area.
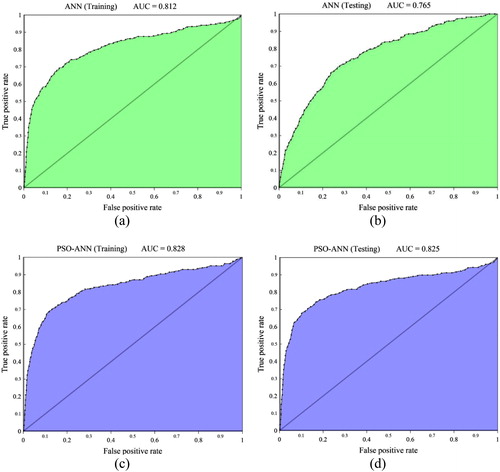
In the following, the accuracy of the resulted landslide hazard maps is measured through drawing the receiving operating characteristic (ROC) curve which yields the AUC index (Yilmaz Citation2009; Pradhan and Lee Citation2010). The AUC criterion can vary from 0.5 to 1 so that a casual prediction is determined by 0.5, and adversely, the latter value indicates an ideal estimation. Note that, either training and testing (i.e. validation) landslides are considered here to evaluate the reliability of ANN and PSO-ANN models. illustrates the ROC curves drawn based on the true positive rate (on the vertical axis) against the false positive rate (on the horizontal axis) for training and testing phase of the ANN and PSO-ANN methods. As the first result, all four ROC curves show a satisfying approximation in both training and testing phase of applied methods. In overall, the obtained results reveal the effectiveness of the PSO algorithm in enhancing the accuracy of the typical ANN. In this sense, the calculated accuracy increases from 81.2% to 82.8% in the training process, and more considerably from 76.5% to 82.5% in the validation phase by applying the PSO evolutionary algorithm.
Figure 10. The ROC diagram, obtained for ANN (a and b) and PSO-ANN (c and d) models for training and testing landslides.
7. Conclusions
This study outlines the efficiency of the PSO algorithm for improving the performance of a common type of ANN namely MLP in earthquake-induced landslide hazard assessment. To develop a reliable zonation of the landslide hazard, various causative parameters such as geological and hydrological effective factors were used through the GIS spatial database. Twelve landslide-related factors, namely: elevation, slope degree, lithology, PGA, SPI, TWI, distance to road, distance to river, distance to fault, NDVI, slope aspect and plan curvature were used to construct the input layers. Also, the landslide inventory map was generated by 458 earthquake-induced landslides. Among those, 366 (80%) landslides were specified to the learning process, and the remaining 92 (20%) were used to evaluate the accuracy of results. As the first result of this research, ANN with 6 hidden neurons and PSO-ANN with swarm size of 500 yields the most accurate prediction. Referring to the obtained accuracy of 81.2% and 82.8% and 76.5% and 82.5%, respectively, for the training and testing phases of ANN and PSO-ANN, both applied approaches perform satisfactorily. The results also revealed that the ANN synthesized with PSO evolutionary algorithms outperform the typical ANN model. Also, based on the resulted landslide hazard maps, a total of 23.04% and 19.88% of the Ludian county is labelled as the dangerous landslide regions, respectively, by ANN and PSO-ANN models.
Acknowledgements
We thank the reviewers for their constructive comments on improving the quality of this article. This work research was supported in part by the Yunnan Provincial Department of education research foundation (2016ZZX067) and Yunnan Provincial Science and Technology Department Fund(2017FB078). Note that in this manuscript, Wenfei Xi provided the data and modification of the article while Hossein Moayedi provided the writing initial draft and analytical part of the article.
Disclosure statement
No potential conflict of interest was reported by the authors.
Additional information
Funding
Related Research Data
References
- Ahmouda A, Hochmair HH, Cvetojevic S. 2018. Analyzing the effect of earthquakes on OpenStreetMap contribution patterns and tweeting activities. Geo Spat Inf Sci. 21(3):195–212.
- Asadi A, Moayedi H, Huat BBK, Parsaie A, Taha MR. 2011. Artificial neural networks approach for electrochemical resistivity of highly organic soil. Int J Electrochem Sci. 6:1135–1145.
- Beven KJ, Kirkby MJ. 1979. A physically based, variable contributing area model of basin hydrology/Un modèle à base physique de zone d'appel variable de l'hydrologie du bassin versant. Hydrol Sci J. 24(1):43–69.
- Binh Thai P, Manh Duc N, Kien-Trinh Thi B, Prakash I, Chapi K, Dieu Tien B. 2019. A novel artificial intelligence approach based on multi-layer perceptron neural network and biogeography-based optimization for predicting coefficient of consolidation of soil. Catena. 173:302–311.
- Binh Thai P, Prakash I, Dieu Tien B. 2018. Spatial prediction of landslides using a hybrid machine learning approach based on random subspace and classification and regression trees. Geomorphology. 303:256–270.
- Bui DT, Tuan TA, Klempe H, Pradhan B, Revhaug I. 2016. Spatial prediction models for shallow landslide hazards: a comparative assessment of the efficacy of support vector machines, artificial neural networks, kernel logistic regression, and logistic model tree. Landslides. 13:361–378.
- Chen W, Chai H, Sun X, Wang Q, Ding X, Hong H. 2016. A GIS-based comparative study of frequency ratio, statistical index and weights-of-evidence models in landslide susceptibility mapping. Arab J Geosci. 9:204.
- Chen W, Li W, Hou E, Bai H, Chai H, Wang D, Cui X, Wang Q. 2015. Application of frequency ratio, statistical index, and index of entropy models and their comparison in landslide susceptibility mapping for the Baozhong Region of Baoji, China. Arab J Geosci. 8(4):1829–1841.
- Clerc M, Kennedy J. 2002. The particle swarm-explosion, stability, and convergence in a multidimensional complex space. IEEE Trans Evol Computat. 6(1):58–73.
- Demir G, Aytekin M, Akgun A. 2015. Landslide susceptibility mapping by frequency ratio and logistic regression methods: an example from Niksar–Resadiye (Tokat, Turkey). Arab J Geosci. 8(3):1801–1812.
- Dong Y, Wang D, Randolph MF. 2017. Runout of submarine landslide simulated with material point method. Proceedings of the 1st International Conference on the Material Point Method. Amsterdam: Elsevier Science Bv; p. 357–364.
- Eberhart R, Kennedy J. 1995. A new optimizer using particle swarm theory. Proceedings of the Sixth International Symposium on Micro Machine and Human Science, Nagoya, Japan'9. IEEE.
- Ercanoglu M, Gokceoglu C. 2002. Assessment of landslide susceptibility for a landslide-prone area (north of Yenice, NW Turkey) by fuzzy approach. Environ Geol. 41:720–730.
- Ercanoglu M, Gokceoglu C. 2004. Use of fuzzy relations to produce landslide susceptibility map of a landslide prone area (West Black Sea Region, Turkey). Eng Geol. 75(3–4):229–250.
- Ghorbani MA, Kazempour R, Chau K-W, Shamshirband S, Ghazvinei PT. 2018. Forecasting pan evaporation with an integrated artificial neural network quantum-behaved particle swarm optimization model: a case study in Talesh, Northern Iran. Eng Appl Comput Fluid Mech. 12:724–737.
- Greco SE. 2018. Seven possible states of geospatial data with respect to map projection and definition: a novel pedagogical device for GIS education. Geo Spat Inf Sci. 21(4):288–293.
- Hebb D. 1949. The organization of behavior: a neurophysiological approach. A Wiley Book in Clinical Psychology., 62–78, 1949, John Wiley & Sons Inc, New York, United States.
- Jaafari A, Panahi M, Pham BT, Shahabi H, Bui DT, Rezaie F, Lee S. 2019. Meta optimization of an adaptive neuro-fuzzy inference system with grey wolf optimizer and biogeography-based optimization algorithms for spatial prediction of landslide susceptibility. Catena. 175:430–445.
- Jing-Chun X, Hui-Wen L, Zi-Li L. 2015. Analysis of landslide hazard area in Ludian earthquake based on Random Forests. The International Archives of the Photogrammetry, Remote Sensing and Spatial Information Sciences, Volume XL-7/W3, 2015 36th International Symposium on Remote Sensing of Environment, 11–15 May 2015, Berlin, Germany
- Li L, Liu R, Pirasteh S, Chen X, He L, Li J. 2017. A novel genetic algorithm for optimization of conditioning factors in shallow translational landslides and susceptibility mapping. Arab J Geosci. 10:209.
- McCulloch WS, Pitts W. 1943. A logical calculus of the ideas immanent in nervous activity. Bull Math Biophys. 5(4):115–133.
- Moayedi H, Mehrabi M, Mosallanezhad M, Rashid ASA, Pradhan B. 2018a. Modification of landslide susceptibility mapping using optimized PSO-ANN technique. Eng Comput. Vol 35, 1–18.
- Moayedi H, Mosallanezhad M, Mehrabi M, Safuan A. 2018b. A systematic review and meta-analysis of artificial neural network application in geotechnical engineering: theory and applications. Neural Comput Appl. 35:1–24.
- Moore ID, Grayson R, Ladson A. 1991. Digital terrain modelling: a review of hydrological, geomorphological, and biological applications. Hydrol Process. 5(1):3–30.
- Mosallanezhad M, Moayedi H. 2017. Developing hybrid artificial neural network model for predicting uplift resistance of screw piles. Arab J Geosci. 10:10.
- Nath SK. 2004. Seismic hazard mapping and microzonation in the Sikkim Himalaya through GIS integration of site effects and strong ground motion attributes. Nat Hazards. 31:319–342.
- Nguyen H, Bui X-N, Bui H-B, Mai NL. 2018. A comparative study of artificial neural networks in predicting blast-induced air-blast overpressure at Deo Nai open-pit coal mine, Vietnam. Neural Comput Appl. 32:1–17.
- Oh H-J, Pradhan B. 2011. Application of a neuro-fuzzy model to landslide-susceptibility mapping for shallow landslides in a tropical hilly area. Comput Geosci. 37:1264–1276.
- Pourghasemi H, Pradhan B, Gokceoglu C, Moezzi KD. 2013. A comparative assessment of prediction capabilities of Dempster–Shafer and weights-of-evidence models in landslide susceptibility mapping using GIS. Geomat Nat Haz Risk. 4(2):93–118.
- Pradhan B, Lee S. 2010. Regional landslide susceptibility analysis using back-propagation neural network model at Cameron Highland, Malaysia. Landslides. 7(1):13–30.
- Seyedashraf O, Mehrabi M, Akhtari AA. 2018. Novel approach for dam break flow modeling using computational intelligence. J Hydrol. 559:1028–1038.
- Tien Bui D, Pham BT, Nguyen QP, Hoang N-D. 2016. Spatial prediction of rainfall-induced shallow landslides using hybrid integration approach of least-squares support vector machines and differential evolution optimization: a case study in Central Vietnam. Int J Digit Earth. 9(11):1077–1097.
- Tien Bui D, Shahabi H, Shirzadi A, Chapi K, Hoang N-D, Pham B, Bui Q-T, Tran C-T, Panahi M, Bin Ahmad B, et al. 2018. A novel integrated approach of relevance vector machine optimized by imperialist competitive algorithm for spatial modeling of shallow landslides. Remote Sens. 10(10):1538.
- Van-Dung H, Le M-H, Truc Thanh T, Van-Huy P. 2018. Improving traffic signs recognition based region proposal and deep neural networks. In: Nguyen N., Hoang D., Hong TP., Pham H., Trawiński B. (eds) Intelligent Information and Database Systems. ACIIDS 2018. Lecture Notes in Computer Science, vol 10752. Springer, Champ. 604–613.
- Wang J, Fu G, Li W, Shi Y, Pang J, Wang Q, Lü W, Liu C, Liu J. 2018. The effects of two free-floating plants (Eichhornia crassipes and Pistia stratiotes) on the burrow morphology and water quality characteristics of pond loach (Misgurnus anguillicaudatus) habitat. Aquac Fish. 3(1):22–29.
- Wang Q, Li W, Chen W, Bai H. 2015a. GIS-based assessment of landslide susceptibility using certainty factor and index of entropy models for the Qianyang County of Baoji city, China. J Earth Syst Sci. 124(7):1399–1415.
- Wang S-C. 2003. Artificial neural network. In: Interdisciplinary computing in java programming. The Springer International Series in Engineering and Computer Science, vol 743. Springer, Boston, MA; vol 743. Springer, Boston, MA, p. 81–100.
- Wang W-J, Huai W-X, Zeng Y-H, Zhou J-F. 2015b. Analytical solution of velocity distribution for flow through submerged large deflection flexible vegetation. Appl Math Mech Engl Ed. 36(1):107–120.
- Wu X, Ren F, Niu R. 2014. Landslide susceptibility assessment using object mapping units, decision tree, and support vector machine models in the Three Gorges of China. Environ Earth Sci. 71(11):4725–4738.
- Xu C, Dai F, Xu X, Lee YH. 2012. GIS-based support vector machine modeling of earthquake-triggered landslide susceptibility in the Jianjiang River watershed, China. Geomorphology. 145:70–80.
- Yilmaz I. 2009. Landslide susceptibility mapping using frequency ratio, logistic regression, artificial neural networks and their comparison: a case study from Kat landslides (Tokat—Turkey). Comput Geosci. 35:1125–1138.
- Zhong-Sheng L. 2003. The State of the Art of the Research on Seismic Landslide Hazard at Home and abroad. J Catastrophol. 4:64–70.
- Zhou S, Chen G, Fang L. 2016. Distribution pattern of landslides triggered by the 2014 Ludian earthquake of China: implications for regional threshold topography and the seismogenic fault identification. ISPRS Int J Geo Inf. 5(4):46.