
 ?Mathematical formulae have been encoded as MathML and are displayed in this HTML version using MathJax in order to improve their display. Uncheck the box to turn MathJax off. This feature requires Javascript. Click on a formula to zoom.
Abstract
Fires are one of the main factors for disturbances in Niassa Reserve-Mozambique, with economic and environmental impacts. There are cyclical records of fire occurrences across the reserve. However, studies on the main causative factors and identification of more susceptible locations are very limited. In this perspective, this study had as objectives: (1) determine the main significant factors for wildfire occurrences; (2) Map the probability of wildfire occurrences, using logistic regression. Independent variables included vegetation index (NDVI), climatic, topographic and socioeconomic data. The analysis period was from 2001 to 2015 and comprised the months with more occurrences of wildfire (May to December). According to the results, the main factors that determine the occurrence of fires were: NDVI, temperature, elevation, followed by precipitation, slope, relative humidity and human settlements. The spatial distribution of probability of fire occurrence reveals that zones with high and very high risk are located at the west and central west zones (areas with higher accumulation of dry biomass); medium risk zones are located in the centre of the reserve, while in central east and east zones the probability of fire occurrence is low and very low risk. Results showed that the expectation of wildfire ignition using logistic regression presented good precision (area under the curve 74%).
1. Introduction
Wildfire is one of the most important sources of economic, social and environmental damages globally (Lozano et al. Citation2008; Renard et al. Citation2012). African savannahs, more specifically, miombo vegetation, are prone to fire. Fire is an integral part of these ecosystems, and is one of the key factors in the dynamics of regeneration, development and spatial distribution of countless species of fauna and flora (Trapnell Citation1959; Chidumayo Citation1988, Citation1997).
Niassa Reserve is the most extensive area of miombo vegetation conservation worldwide (Ribeiro et al. Citation2008), with one of the largest fauna concentrations in Mozambique (Leo-Smith et al. 2007). Though fires can play an ecologically significant role in biogeochemical cycles and functioning of this system, the frequency and intensity of fires many times lead to forest vegetation destruction with huge negative effects in atmospheric chemistry (atmospheric pollution and carbon emission) and in ecology (loss of biodiversity, landscape instability and proliferation of invasive species) (Chuvieco Citation2003; Bond and Keeley Citation2005), becoming a threat to economic goods and to human health (Shlisky et al. Citation2007).
According to Timberlake et al. (Citation2004), every year, from May to October there is a recurrence of fires in Niassa Reserve. From 2000 to 2012 alone, 45% of the reserve area burnt annually or over two years, and 27% burnt each 3–4 years, only 9% of the total area did not record burning during this period (Ribeiro et al. Citation2017). According to this same author, fire in the Reserve presents a return interval of 3.29 years, which means a total frequency of 0.36 year–1.
Miombo forests’ ecological characteristics, their seasonality, climatic factors and physiographic characteristics have influenced the incidence of fires in Niassa Reserve. In addition to these factors, the pressure on this area, with an increase of anthropic activities, has considerably increased the number of fires detected and burnt areas.
However, for the burning to occur, three conditions are required: propitious meteorological conditions; availability of combustible vegetation; existence of an ignition source (Parisien and Moritz Citation2009). The action of each of these factors is different for each region and time of the year, which causes high variability in the pattern observed in fires. In African forests, it is known that this variability is determined by a combination of factors: climatic (rainfall and temperature), herbivory and human activities (Archibald et al. Citation2010).
In this perspective, the understanding of the way the environment is occupied, its physical characterization, including biological and climatic aspects of each geographic region, and the determination of controlling factors of fires can assist in the detection of locations more susceptible to the occurrence of wildfire, facilitating the planning of strategies for fire prevention and fighting (San-Miguel-Ayanz et al. Citation2003; del Hoyo et al. Citation2011).
The modelling of fire risk thus becomes an important tool for forest managers in the identification of locations with high risk of forest fire, also leading to the optimization and allocation of resources for firefighting (San-Miguel-Ayanz et al. Citation2003; Mohammadi et al. Citation2014). In locations like Niassa reserve, the identification of determinant factors to control wildfire and the use of maps of fire risk probability can serve, therefore, as a preventive or protective approach to improve fire management.
Methods coupled to Geographic Information Systems, integrating remote sensing data, have been often used to model the probability of fire risk and determine controlling factors at the large, local and regional scales. Among them, statistical methods are outstanding: Artificial neural network (de Vasconcelos et al. Citation2001; Costafreda-Aumedes et al. Citation2015), the maxent algorithm (Renard et al. Citation2012), the autoregressive model (Prestemon et al. Citation2012), classification trees (Lozano et al. Citation2008), global logistic regression (Zhang et al. Citation2013;), multiple linear regression and random forest (Oliveira et al. Citation2012; Guo et al. Citation2016a).
However, the choice of the modelling method depends on the characteristic of the dependent variable, while using a very fine spatial resolution (for example 1 km), binomial response is required because only presence or absence is recorded (Taylor et al. Citation2013).
For specific cases Logistic Regression was used, which is one of the statistical methods mostly used, both for prediction of fire risk and to determine the causes of fire, at the global level (de Vasconcelos et al. Citation2001; Lozano et al. Citation2008; Syphard et al. Citation2008; del Hoyo et al. Citation2011; Padilla and Vega-Garcıa Citation2011; Magnussen and Taylor Citation2012). Compared to other techniques, it is flexible, variables can be continuous and/or categorical, and it is not necessary to follow the normality principle (Legendre and Legendre Citation1998; Catry et al. Citation2009).
Thus, this study had as objectives (1) determine the main significant factors for wildfire occurrence and (2) map the probability of wildfire occurrence in Niassa Reserve, based on logistic regression.
2. Materials and methods
2.1. Study area
Niassa Reserve is located at the north of Mozambique, between parallels 12°36′46,67″ and 11°26′05.83″ south and meridians 32°25′20.16″ and 38° 31′23.16″ east (). The reserve is part of Rovuma watershed and its territorial extension is 42,311 km2. However, this study is concentrated in the central area of the reserve (Conservation Area), with around 23,040 km2, and the remaining portion is part of the buffer area, administered by the concessionary for touristic purposes. The climate in the region is dry sub-humid tropical, characterized by two distinct climatic seasons: dry (May to September) and rainy (October to April). The average annual temperature ranges from 20° to 26 °C, while average annual rainfall ranges from 770 to 1,140 mm.
Figure 1. Geographic localization of the study area, Niassa Reserve, Mozambique. (a) Localization of the study area; (b) average temperature; (c) average precipitation; (d) total vegetation productivity, Source: Nhongo et al. (Citation2017).
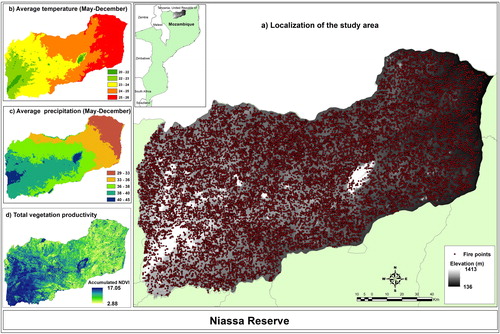
The vegetation cover is characterized by occurrence of four large vegetal formations: Deciduous forest; open semi-deciduous forest, mountain forest, riverside forests (woods) and scrubland (Nhongo et al. Citation2017). From the reserve total area, 72% is covered by the Zambezian dry miombo forest, which occurs in Sandy soils, high lands, with predominance of Brachystegia spiciformis, Bachystegia boehmii and species of Julbernardia globiflora (White 1983). Elevations range from 136 to 1,413 m, above sea level, with gradual increase from east to west, and occurrence of several inselberg rock formations.
The reserve is an area with the lowest demographic density in the country, around 1.3 inhabitants/km2 (Ribeiro et al. Citation2017).
2.2. Dependent variable: active fire
Data from active fire sources obtained for the period from January 2001 to December 2015, from the MODIS sensor on board the Aqua and Terra platforms, with a spatial resolution of 1 km, collection 6, monthly thermal anomalies product MCD14ML, made available by NASA FIRMS (Fire Information for Resource Management System) through the website (https://earthdata.nasa.gov/earth-observation-data/near-real-time/firms/). Each position of MODIS active fire represents the centre of a 1 × 1 km2 pixel that is labelled by the algorithm as containing one or more fires inside the pixel.
To avoid false alarms (commission errors), only high reliability fire pixels were considered (>80% reliability), because in some cases the product underestimates the occurrence of some fires like: short duration burnings, which occur among images available or that start and end before the passing of the satellite; very small fire fronts hardly detectable; cloud coverage at the time images are being taken; heavy smoke and fire only on the ground of a dense forest, without affecting treetops (Oliveras et al. Citation2014; Giglio Citation2015; Anderson et al. Citation2015). It can also overestimate fire pixels in target situations with contrasting temperatures (e.g. forest limit and bare soil, on hot days), sandy soils or exposed rock presenting high temperatures on hot days (Schroeder et al. Citation2008; Devisscher et al. Citation2016), and some fire pixels highly questionable are still classified as nominal reliability, despite the adjustments made in collection 6 (Giglio Citation2015).
2.3. Independent variables
Independent variables comprised four categories: climate, vegetation, topography and socioeconomic factors. Criteria for selection of variables were based on previous studies on fire occurrence (Achard et al. Citation2008; Wotton et al. Citation2010; Gralewicz et al. Citation2012; Oliveira et al. Citation2012; Chuvieco et al. Citation2012) and knowledge of the area of study. It is worth mentioning that variable land use and cover was not included because the area of study presents the lowest demographic density and, therefore, low diversity of land use and cover. 70% of the reserve area is occupied by vegetation cover, represented in this study by NDVI. Details of variables used are presented in .
Topographic parameters: Three topographic parameters were used: elevation, slope, and aspect, extracted from the digital elevation model (DEM), made available by the NASA Shuttle Radar Topographic Mission (SRTM), http://srtm.csi.cgiar.org/) with 90m spatial resolution, re-sampled to 1,000 m (using the nearest neighbor method).
Climatological parameters: Climate data covered the period from May to December, from 2001 to 2015, and comprised: air temperature, precipitation and relative air humidity. For precipitation, a monthly time series was used, made available by the Climate Hazards group InfraRed Precipitation with Station data (CHIRPS), http://chg.geog.ucsb.edu/data/chirps/), version 2, with 5 km × 5 km spatial resolution, re-sampled to 1 km (using the nearest neighbour method).
For temperature, monthly air temperature at 2 m data and dew point temperature at 2 m data (used for calculation of relative humidity), both ERA-Interim reanalysis data, made available by the European Centre for Medium-Range Weather Forecasts (ECMWF), http://apps.ecmwf.int/datasets/data/interim-full-daily/levtype=sfc/, with 0.125° × 0.125° spatial resolution re-sampled to 1 km.Relative humidity was calculated based on dew point temperature and temperature at 2 m data, estimated by Penman Monteith model, parameterized according to FAO bulletin 56 (Allen et al. Citation1998).
Vegetation cover parameters: A time series of NDVI/MODIS data from the Terra satellite, MOD13Q1 (Collection 5) product, 250 m spatial resolution, 16 days’ time composition was used, acquired on website https://mrtweb.cr.usgs.gov/, from 2001 to 2015. However, only images from the period of record of occurrence of fires, from May to December were used. Monthly means were created from the 16-day time composition.
Socioeconomic parameters: Socioeconomic data include roads and human settlements, obtained by CENACARTA (2008). The proximity of roads and human settlements was generated based on the Euclidian distance of each cell to the nearest road or human settlement.
Table 1. Independent variables analysed in logistic regression model.
2.4. Methods
2.4.1. Ignition frequency of wildfire conditioning factors
First, an analysis of ignition frequency of fires in the 15-year period was made with regard to the conditioning factors. Histograms were generated representing the frequency of fire ignition per class in each conditioning factor. Mean and coefficient of variation were also calculated for each factor.
2.4.2. Modelling approach
To estimate the probability of fire risk in Niassa Reserve, logistic regression was applied based on the following equation:
(1)
(1)
(2)
(2)
where P is the probability of occurrence of the event, and should be included as a dichotomous variable; z is obtained from a linear combination of independent variables based on adjustment of maximum likelihood, with constant
coefficient of partial lineal regression
and original values of variables
The use of logistic regression assumes that the predictable variable is dichotomous, the existence of both presence and absence of fire sources. For presence, fire sources recorded from 2001 to 2015 were used, codified as 1 (representing the occurrence). For nonoccurrence (absence) 31,834.5 random points noncoincident with ignition points in the whole reserve were generated, in a 1:1.5 ratio to ignition sources (Catry et al. Citation2009; Chang et al. Citation2013) which were codified as zero (0) (representing nonoccurrence).
Additionally, in order to validate the model, two distinct groups were generated, one to build the model (training) and the other for its validation, a procedure used by several authors (Catry et al. Citation2009; Chuvieco et al. Citation2009; del Hoyo et al. Citation2011; Guo et al. Citation2016b) varying only in the percent used in the construction of the respective groups. In the present work 50% of ignition points (10.612) and 50% of nonignition points (15.917) were selected and used as a subset for training and remaining points to test the model’s predictive capacity, that is, its validation. All analyses were made using the software SPSS 24.0.
Since logistic regression assumes that independent variables should not be correlated (Colinearity), multicollinearity among independent variables was tested using Tolerance and VIF (Variance Inflation Factor). Multicollinearity is present when there is some level of inter-relation among predictive variables (Villagarcía Citation2006). Its existence in a regression model may distort the model estimate or interfere with the precision estimate. Variables presenting significant colinearity (VIF ≥ 10) and coefficient of tolerance (Tolerance >0.1) must be removed from the model. The values of Tolerance and VIF obtained indicated that there are no multicollinearity problems.
The Stepwise Forward method was applied to build the model’s logistic regression. The Forward method is characterized for considering variables with higher coefficients of sample correlation observed with the response variable. It only starts the model with the constant and adds the variables, more correlated, one at a time. When there is no inclusion in a stage, the process is interrupted and the variables selected up to this stage will define the final model ( del Hoyo et al. Citation2011) .
The significance of each variable was assessed by the Wald test (Legendre and Legendre Citation1998) at 5% (P < 0.05) significance level. Besides, the odds ratio was also calculated based on the exponential coefficient Exp (bi), which is an indicator of change in probabilities resulting from the change of one unit in the predictor.
Once the model was defined, the next stage was testing its performance, which was done using different approaches. The global assessment of the model was made using the adjustment to the Hosmer-Lemeshow model test (Hosmer et al. Citation1997; Hosmer and Lemeshow Citation2000). According to Norusis (Citation2002), in case the test result is inferior to 5%, the null hypothesis that there is no difference among values observed and predicted was rejected, meaning that data do not adjust to the model. To assess the predictive capacity of the logistic model 2 × 2 classification tables of values observed predicted were also created, using and comparing the set of training and validation data. However, to determine threshold probability (cutoff), above which fire ignition occurrence is accepted, and below which it is considered that no fire occurred, the Youden index was applied (Garcia et al. Citation1995; Chang et al. Citation2013), which was also used in previous studies to determine the best cutoff values in logistic regression to predict the occurrence of fires (Catry et al. Citation2009; Chang et al. Citation2013). The optimal value corresponds to the value of intersection between sensitivity and specificity (de Vasconcelos et al. Citation2001). For such, the set of training data was used to build the classification table and determine the optimal cutoff value, which was 0.3824 for the present work.
Another procedure used to assess how well a model is parameterized and calibrated was the receiver operating characteristic (ROC) curve, which analyses the proportion of positive true, classified as positive (sensitivity), and negative true classified as negative (specificity) for the model, which is a plotting of sensitivity versus specificity for several thresholds of probability (Swets Citation1988; Fielding and Bell, Citation1997). A model that denotes good performance is the one that covers large areas below the curve (Catry Citation2007; del Hoyo et al. Citation2011; Jiménez-Valverde 2012). Values between 0.5-0.7 indicate low precision, values between 0.7-0.8 indicate acceptable precision, between 0.8-0.9 indicate good precision and values above 0.9 reveal excellent predictive capacity of the model (Swets Citation1988; Hosmer and Lemeshow Citation2000; McCune et al. Citation2002; del Hoyo et al. Citation2011).
2.4.3. Analysis of variables’ importance
To assess the influence of individual variables in the model, several criteria were globally computed and analysed, according to Martínez et al. (Citation2009); Martınez-Fernandez et al. (Citation2013): (i) steps where variables were inserted in the model; (ii) level of statistical significance (Wald statistics); (iii) odds ratio or logit B coefficient exponential (Exp (B)); (iv) simple calculation of standardized coefficients, according the Menard method (2010). For the standardized coefficient, the calculations involve multiplication of each non standardized logistic coefficient by the standard deviation of the variable to which the variable belongs, the higher the absolute value of the standard coefficient, the higher is the importance of the variable (Galán and López Citation2003); and (vi) change in R2 when the variable was removed from the model (the higher the change, the more important is the variable). For the present study, the change in likelihood logarithm was used (−2 LL). And the most important variable to the model is the one that presents the lower global scoring.
2.4.4. Spatial modelling
To produce an ignition probability map, all independent variables were represented in layers, in a geographic information system. The regression model equation was created through map algebra in the ArcGis 10.4 environment, using the coefficients obtained through the regression model and independent variables. The map produced was classified in five classes: Very Low (0.01-0.20); Low (0.20-0.40); Medium (0.40-0.60); High (0.60-0.80) and Very High (>0.80).
2.4.5. Model validation
The validation of the logistic regression model is obtained by applying the model to the validation sample (Hair Citation1998). Thus, independent analysis was made using the validation group to check the efficacy of the predictive model built. For such, the ROC curve and classification table were used. Additionally, to assess the predictive capacity of the risk map produced, a distribution of ignition points of the validation group across classes of the ignition probability map was made.
3. Results
3.1. Analysis of frequency of fire ignition
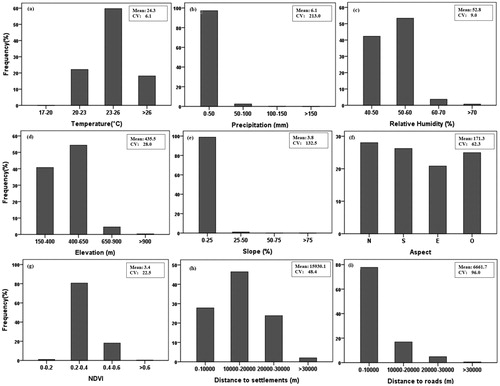
A preliminary analysis of fire spatial distribution against the variables selected () shows that the highest frequencies of fires occurred in areas where temperatures were mild (between 23° and 26°), with low precipitation (<50 mm), while 90% of fires occurred in areas with low to medium relative humidity (40–60%). Most fire sources occurred between low and medium elevation (150–650 m) and around 80% on flat slopes and gentle hillsides (0–25%). However, with regard to Aspect, ignitions were evenly distributed across several north, east, south and west quadrants, but with higher incidence in the north of the reserve. The highest frequencies of fires were also recorded in areas with low and medium NDVI values, 0.2–0.4. Results also revealed that most fires occurred at a distance between 10 and 20 km from human settlements and near roads. This analysis also shows that the variable with more variability was precipitation (Coefficient of variation, CV = 213) and with less variability was air temperature (CV = 6.1).
Figure 2. Fire ignition frequency in relation to different variables: (a) Temperature; (b) Precipitation; (c) Relative Humidity; (d) Elevation; (e) Slope; (f) Aspect; (g) NDVI; (h) Distance to Human Settlement; (i) Distance to Roads. CV: coefficient of variation (%).
3.2. Model of fire ignition
After several interactions, the final model selected the variables most correlated to wildfire, which were NDVI, Air temperature, Elevation, Precipitation, Slope, Relative humidity and Distance to human settlements. These variables were revealed to be significantly related with the probability of occurrence of wildfire ignitions (P < 0.05). Roads and Aspect were excluded. The significance of explanatory variables and their respective coefficients are presented in .
Table 2. Results of binary logistic regression model.
According to the results, a negative relation was found between fire occurrences and NDVI, Air temperature, Slope; and a positive relation was observed among Elevation, Precipitation, Relative humidity and distance to human settlements.
The Hosmer and Lemeshow goodness-of-fit test indicated insufficient fit of the regression to the data (x2 = 310,422, df = 8, P < 0.0001). The model predictive capacity was also assessed using classification tables, comparing observed and predicted values, and using a cutoff value of 0.3830, global classification was 67.10% of correctly classified cases (), using training data. The area under the curve (AUC) was 75% (acceptable precision) () indicating good adjustment. These measurements combined suggest model acceptance as a significant logistic regression model.
Figure 3. ROC curve, training data (a) and ROC curve, validation data (b).
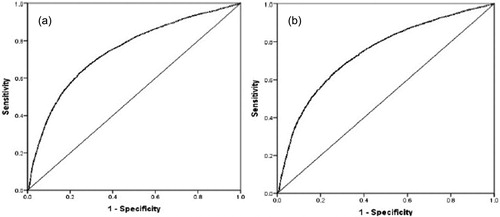
Table 3. Relative importance of variables, assessed based on different criteria.
The model obtained was represented by EquationEquation (2)(2)
(2) :
(2)
(2)
where Pi is the probability of a point to correspond to one ignition per fire; Elev is elevation; Dist_sett is Distance to settlements; NDVI is normalized difference vegetation index; Prec is rainfall; Slop represents Slope; Temp is temperature; UR is relative humidity.
3.3. Relative importance of variables
The result of relative importance of variables is presented in . The global scoring, calculated by the sum of classification of all variables, is presented in the last column. NDVI was the most important variable in fire occurrences, followed by air temperature, elevation, precipitation, slope and air relative humidity, and in last position, distance to human settlements.
Table 4. Contingency table for the set of training and validation data of logistic regression models, with 0.383 cutoff, according to Yueden criterion.
3.4. Spatial modelling of probability of fire occurrence
The spatial distribution of logistic probability of the final model () is the estimate of fire risk for Niassa Reserve. The probability interval scale was divided in five classes: Very low (0.00–0.20) located at east; low (0.20–0.40), located at central east; medium (0.40–0.60) central area of the reserve; high (0.60–0.80), central west of the reserve and very high (>0.80) west of the reserve. In terms of relative distribution, it was identified that 10% of the reserve area presents very low probability of occurrence, 14% low, 21% moderate, 28% high and 27% very high susceptibility ().
Figure 4. Probability of risk of wildfire, Niassa Reserve.
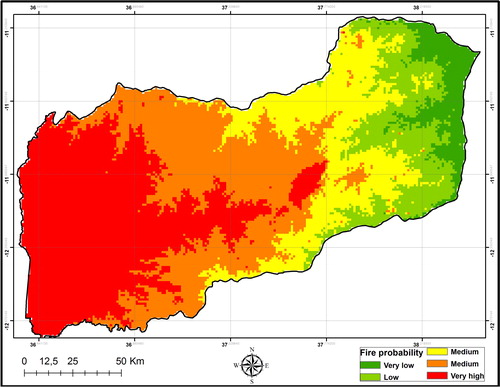
Table 5. Classification of risk areas.
3.5. Model validation
According to validation results, presented in the contingency table, the model classified correctly 66.8% of all observations. This result is slightly inferior to those obtained with the training group (67.1%).
This difference between results obtained in the training group and for validation lead us to conclude that the model revealed good predictive capacity in the ignition points, reducing the capacity of classification of points of nonignition points, which may mean an excess of predicted areas. In short, the correctness rates in the validation sample are almost identical to the correctness rates in the training sample (), and one may conclude that the logistic regression model has strong empirical support both in the validation sample and in the training sample.
The model performance was analysed through the area under the ROC curve. For the validation group, it was 0.74, which reveals acceptable capacity of the model, slightly reducing when compared to the results of the training group (0.75), but both are quite satisfactory.
In order to assess the predictive capacity of the map produced, distribution of ignition points of the validation group across classes of the ignition probability map was made. According to the results (), it can be observed that, though very high probability classes represent 27%, it can predict 39% of the total of ignition points of the validation group and present the highest density (0.66 km2). The high class represents 28% of the area and can predict 29%. The two classes can predict 68% of the total ignition points of the validation group. The medium class, on the other hand, occupies only 21% of the area, but can predict 18% of ignition points. On the other hand, only 13% of ignitions are located in low and very low risk classes which represent 24% of the territory. With these results one can conclude that the ignition probability map presents good predictive capacity.
4. Discussion
4.1. Determinant factors in fire occurrence
The logistic regression analysis provided ground for the understanding of determinant factors for fire occurrence in Niassa Reserve. Results show that NDVI, air temperature, and precipitation are the most important variables, followed by slope and relative humidity, and finally, the less important variable in the determination of fire occurrence is distance to human settlements. These results show consistency with recent studies on determinant factors for occurrence of fire in African savannahs and conservation areas (Berjak and Hearne Citation2002; Trollope and Trollope Citation2004; Archibald et al. Citation2009).
NDVI is the most important variable, it presented strong negative relation with fire occurrence, which means higher probability of fire occurrence as there is reduction in vegetation vigor. According to Eva and Lambin (Citation1998), in African savannahs, NDVI is reduced seasonally, and in the dry season can reach values as low as those of burnings and exposed soil. Works developed by Nhongo et al. (Citation2017) in Niassa reserve report low NDVI values in the dry season, ranging, on average, from 0.2 to 0.4, according to the type of vegetation cover. This means that as NDVI values decrease, there is a reduction in vegetation vigor (moisture content in combustible vegetation) and increase of dry biomass accumulation with consequent fire risk. One can assume that moisture is inversely proportional to the inflammability of the combustible vegetation.
Studies developed globally show that the combustible moisture condition is a critical factor that influences the danger of wildfire in ecosystems prone to fire, like African savannahs (Zarco-Tejada et al. Citation2003). There are records of significant correlation coefficients between vegetation index and combustible moisture content, based on the hypothesis of dependence of chlorophyll content with regard to the content of water in treetops (Dasgupta et al. Citation2007; Glenn et al. Citation2008). Results with obtention of coefficients of negative correlation of vegetation and wildfire were also reached (Leblon et al. Citation2007; Bisquert et al. Citation2011; Fan et al. Citation2017).
According to Fried et al. (Citation2008), high temperatures proportionally reduce the combustible moisture, making zones highly susceptible to fires. Research developed in pastures and savannahs in South Africa indicated that air temperature has a highly important positive effect on fire intensity (Yakubu et al. Citation2015). In the present study a negative relation was obtained between air temperature and fires in Niassa reserve. However, it is important to mention that 60% of them occurred in areas with medium and high temperatures, of ∼23–26 °C (dry season). The negative relation is possibly related to the spatial dynamics of burnings within the reserve, whose dynamics migrate from east (higher temperatures) to west (lower temperatures), as well as to the analysis window (May to December). However, if we consider the analysis in the long term, air temperature presents a positive relation with fire sources. Results with a negative relation between fire and air temperature were also found by Chang et al. (Citation2013); Guo et al. (Citation2015); Ye et al. (Citation2017), again indicating the complexity of these analyses.
Several studies mention that low precipitation is typically described as a determinant factor for fire risk globally (Batista Citation2000; Chang et al. Citation2008). According to the adjusted model of the present work, there is a positive relation between fire probability and precipitation. However, despite the positive relation, 90% of fires occur in areas with low precipitation, of ∼0–50 mm. It is worth highlighting the beginning of the water year, in October, and the occurrence of fire until December, which somehow ends up by influencing the positive relation of rainfall and fires.
Among climatological variables, relative humidity is, in isolation, one of the less important factors in fire susceptibility in Niassa Reserve. High air relative humidity reduces the possibility of fires. This result seems contradictory, because, according to Turner et al. (Citation1961), relative humidity inferior to 30–40% is the optimal condition for start and spread of wildfire. On the other hand, air relative humidity above 60% may avoid sustained vegetation material combustion (Ronde et al. Citation1990). In the present study, despite the positive relation between relative humidity and fires, 90% of fires occur under conditions where relative humidity is below 60%, meaning that fires occur under conditions favorable to vegetal combustion.
The elevation variable, on the other hand, has a significant and positive effect on fire occurrence. Records of higher numbers of fires are observed between 400 and 650 m, where mountain forests and deciduous vegetation occur. According to Castro and Chuvieco (Citation1998), elevation influences vegetation structure, combustible moisture and air humidity. Combustible distribution depends on topography. Certain species of trees, particularly species with larger structures, are located in more elevated altitudes. In Niassa Reserve there is a direct relation between vegetation structure increase (vegetal biomass) and altitude. Vegetation density and structure increase occurs from east (low elevation) to west (high elevation), due to the increase of precipitation and reduction of air temperature (Nhongo et al. Citation2017). Studies developed in subtropical forests have documented the increase of tree density in subtropical forests as altitude increases (Millar et al. Citation2004; Dolanc et al. Citation2014). Considering that the present study was made during the dry period, where vegetation reaches low NDVI values, one can infer that the increase of dry biomass (accumulation of forest’s combustible load), precisely in areas with higher elevation and larger vegetation structures, determines the higher incidence of fires in Niassa reserve. The positive relation between Elevation and wildfire was also found by Schwartz et al. (Citation2015); Sass and Sarcletti (Citation2017) and Zhang et al. (Citation2016).
On the other hand, more declivitous areas are associated with the increase of wildfire risk, which can be due to the increase of speed of fire propagation, and influences wind conditions, air humidity and moisture of combustible material (Jaiswal et al. Citation2002). Results obtained for Niassa Reserve reveal that most wildfire occurs in areas with Slope below 25%.
Finally, it is known that areas near human settlements are more prone to fires, because they are subject to fires of vehicles and loads and fires produced by those who pass by the area and by the human presence (Ferraz and Vettorazzi Citation1998; Jaiswal et al. Citation2005); though previous studies have verified that the probability of fire occurrence in Niassa Reserve did not increase or reduce with increase or reduction of distance to human settlements. One of the reasons may be related to low demographic density, proximity to river courses, and mitigating measures near human settlements. Zumbrunnen et al. (Citation2011) demonstrated the nonlinear character of the relation involving fire occurrence, population density, human settlements and roads, particularly the levelling of fire occurrence when potential anthropic ignition sources increase. Therefore, expected increases in the number of inhabitants and the associate expansion of urbanized areas and road cover may not result in more fires.
4.2. Spatial modelling of probability of occurrence
Areas with very high and high risk probability, located in the central-west and west of the reserve, respectively, are mostly covered by deciduous and mountain forests (Nhongo et al. Citation2017). Though presenting mild temperatures due to elevated altitudes, they are also characterized by occurrence of vegetation with larger structure and higher treetop density. Due to that, this is the region with more accumulation of dry biomass in the dry period, when compared to other areas of the reserve, and consequently with higher fire risk.
The centre of the reserve presents medium probability of wildfire occurrence, with predominance of deciduous forests, dominated by species of trees and a layer of well-developed grasses on the inferior stratum; temperatures are medium to high and altitudes are intermediary. These results were expected, because in these areas there is accumulation of dry biomass, and climatological variables present magnitudes prone to wildfire occurrences.
However, at the reserve’s central east and east, the probability of occurrence is low, despite the high air temperatures, low precipitation and air relative humidity. This pattern can be explained by the occurrence of semi-deciduous open vegetation, constituted mostly by grasses and sparse trees, typical of savannahs, with low biomass density. According to Scholes et al. (Citation1997), the strongly seasonal character of water availability in these phytophysiognomies leads to accumulation of fine, dry and easily inflammable combustibles that can potentially burn every year. However, the low density of biomass influences low occurrence of fires and their nonmaintenance for a long period after the start.
These results are, therefore, in accordance with the analysis of relative importance of variables used, which showed NDVI, air temperature and elevation as determinant factors in fire occurrences.
4.3. Validation of results
The model obtained showed good predictive capacity when applied to the set of validation data. ROC curve analysis, with 74% of agreement (acceptable precision), 66.8% global classification, shows that results were good when compared to other models of logistic regression developed to predict fire occurrences. For example, Bisquert et al. (Citation2011) estimated the probability of fire occurrence in the Galicia Region (northwest of Spain) and obtained global precision of 58.2%; Padilla and Vega-Garcıa (Citation2011) modelled the occurrence of fires caused by humans, with precision ranging from 47.4 to 82.6% for different ecoregions in Spain; Chang et al. (Citation2013) modelled the occurrence of fires based on logistic regression in Heilongjiang province (China) and obtained global accuracy of 64.9%.
Another aspect worth mentioning is the reliability of the final map, since the two classes (high and very high) can predict 68% of the total of ignition points of validation.
5. Conclusions
In this work, the feasibility of modelling fire risks was illustrated, and also which biophysical and human factors are important drivers of fire in Niassa Reserve, based on logistic regression. The model applied showed good performance, proving to be statistically significant with regard to the explanation of spatial correlation between wildfires and their location.
NDVI, air temperature and elevation are the main determinant factors of fire sources, followed by precipitation, Slope, relative humidity and distance from human settlements. NDVI is the most important factor, for it reflects both humidity contained in combustible material and their seasonality, and the amount of combustible material (biomass accumulation), which influences the occurrence of fires in Niassa Reserve.
Areas in the east of the reserve, with higher altitude, larger vegetation structures and consequently more accumulation of biomass in the dry season, are more susceptible to fire source occurrences, showing that vegetation, climate and topography have significant control on fires in this region.
The results obtained in the present study, in addition to providing better understanding of the spatial distribution of wildfire in the reserve, provide an important tool to guide the management of fires in Niassa Reserve, since they consider characteristics of vegetation cover.
Though several studies point to human factors as drivers of fire sources, it was observed that vegetation is one of the main factors for occurrence of fires in Niassa Reserve, due to seasonality and biomass accumulation. However, despite the strong influence of vegetation cover, climatic and topographic factors, as well as the effect of human factors should not be ignored.
One of the strategies for management of fires would be controlled burn to reduce combustibles and fire intensity, and this should be developed in areas with high susceptibility to wildfire.
Acknowledgments
To the National Council for Scientific and Technological Development (CNPq), for the granting of Doctorate scholarship to the first author.
Disclosure statement
No potential conflict of interest was reported by the authors.
Related Research Data
References
- Allen RG, Pereira LS, Raes D, Smith M. 1998. Crop evapotranspiration -Guidelines for computing crop water requirements – FAO Irrigation and drainage paper 56. FAO; 6p.
- Anderson LO, Aragão L, Gloor M, Arai E, Adami M, Saatchi S, Malhi Y, Shimabukuro YE, Barlow J, Berenguer E, Duarte V. 2015. Disentangling the contribution of multiple land covers to fire-mediated carbon emissions in Amazonia during the 2010 drought. Global Biogeochem Cycles. 29(10):1739–1753.
- Archibald S, Roy D, Van Wilgen B, Scholes R. 2009. What limits fire? An examination of drivers of burnt area in Southern Africa. Global Chang. Biol. 15(3):613–630.
- Archibald S, Scholes R, Roy D, Roberts G, Boschetti L. 2010. Southern African fire regimes as revealed by remote sensing. Int J Wildland Fire. 19(7):861–878.
- Achard F, Eva HD, Mollicone D, Beuchle R. 2008. The effect of climate anomalies and human ignition factor on wildfires in Russian boreal forests. Phil. Trans. R. Soc. B Biol.Sci. 363:2331–2339.
- Batista AC. 2000. Mapas de risco: uma alternativa para o planejamento de controle de incêndios florestais. Floresta. 30(1):45–54. v. n.
- Berjak SG, Hearne JW. 2002. An improved cellular automaton model for simulating fire in a spatially heterogeneous Savanna system. Ecological Modelling. 148(2):133–151.
- Bisquert MM, Sánchez JM, Caselles V. 2011. Fire danger estimation from MODIS enhanced vegetation index data: application to Galicia region (north-west Spain). Int J Wildland Fire. 20(3):465–473.
- Bond WJ, Keeley JE. 2005. Fire as a global herbivore: the ecology and evolution of flammable ecosystems. Trends in Ecology and Evolution. 20(7):387–394. doi:10.1016/j.tree.2005.04.025
- CENACARTA, Centro Nacional de Cartografia e Teledetecao 2008. Dados cartograficos de Moçambique. Accessed in 2018. www.cenacarta.com
- Castro R, Chuvieco E. 1998. Modeling forest fire danger from geographic information systems. Geocarto Int. 13(1):15–23.
- Catry FX, Rego FC, Bação FL, Moreira F. 2009. Modeling and mapping wildfire ignition risk in Portugal. Int J Wildland Fire. 18(8):921–931.
- Catry FX. 2007. Modelação espacial do Risco de Ignição em Portugal continental. Dissertação de Mestrado em Ciência e Sistema de Informação Geográfica. Universidade Nova de Lisboa.
- Chang Y, Zhu Z, Bu R, Chen H, Feng Y, Li Y, Hu Y, Wang Z. 2013. Predicting fire occurrence patterns with logistic regression in Heilongjiang Province, China. Landscape Ecol. 28(10):1989–2004.
- Chang Y, He HS, Hu Y, Bu R, Li X. 2008. Historic and current fire regimes in the Great Xing’an Mountains, northeastern China: implications for long-term forest management. For Ecol Manag. 254(3):445–453.
- Chidumayo EN. 1997. Miombo ecology and management: An introduction. Stockholm: Stockholm Environment Institute.
- Chidumayo EN. 1988. A Re-Assessment of Effects of Fire on Miombo Regeneration in the Zambian Copperbelt. J Trop Ecol. 4(04):361–372.
- Chuvieco E, Gonzalez I, Verdu F, Aguado I, Yebra M. 2009. Prediction of fire occurrence from live fuel moisture content measurements in a Mediterranean ecosystem. Int J Wildland Fire. 18(4):430–441.
- Chuvieco E, Aguado I, Jurdao S, Pettinari ML, Yebra M, Salas J, Hantson S, De La Riva J, Ibarra P, Rodrigues M, et al. 2012. Integrating geospatial information into fire risk assessment. Int J Wildland Fire. doi:10.1071/WF12052
- Chuvieco E. 2003. Wildland fire danger estimation and mapping: the role of remote sensing data. River Edge, NJ: World Scientific Publishing Co.
- Costafreda-Aumedes S, Cardil A, Molina DM, Daniel SN, Mavsar R, Vega-Garcia C. 2015. Analysis of factors influencing deployment of fire suppression resources in Spain using artificial neural networks. iForest. (early view).
- Dasgupta S, Qu JJ, Hao X, Bhoi S. 2007. Evaluating remotely sensed live fuel moisture estimations for fire behavior predictions in Georgia, USA. Remote Sens Environ. 108(2):138–150. doi:10.1016/j.rse.2006.06.023
- de Vasconcelos MJP, Silva S, Tome M, Alvim M, Pereira JMC. 2001. Spatial predition of fire ignition probabilities comparing logistic regression and neural networks. Photogr Eng Remote Sensing. 67(1):73–81.
- del Hoyo VL, Martın Isabel M, Vega MF. 2011. Logistic regression models for human-caused wildfire risk estimation: analysing the effect of the spatial accuracy in fire occurrence data. Eur J Res. 130:983–996.
- Devisscher T, Anderson LO, Aragão LEOC, Galván L, Malhi Y. 2016. Increased wildfire risk driven by climate and development interactions in the Bolivian Chiquitania, Southern Amazonia. PLoS One. 11(9):e0161323. pone.0161323
- Dolanc CR, Safford HD, Dobrowski SZ, Thorne JH. 2014. Twentieth century shifts in abundance and composition of vegetation types of the Sierra Nevada, CA, US. Appl Veg Sci. 17(3):442–455.
- Eva H, Lambin EF. 1998. Burnt area mapping in central Africa using ATSR data. Int J Remote Sens. 19(18):3473–3497.
- Fan Q, Wang C, Zhang D, Zang S. 2017. Environmental influences on forest fire regime in the Greater Hinggan Mountains, Northeast China. Forests. 8(10):372.
- Ferraz SFB, Vettorazzi CA. 1998. Mapeamento de risco de incêndios florestais por meio de sistema de informações geográficas (SIG. Scientia Forestalis, v. 53:39–48. doi:10.1590/2179-8087.025615
- Fielding, A H, Bell, J F. 1997. A review of methods for the assessment of prediction errors in conservation presence/absence models. Envir Conserv. 24(1):38–49. doi:10.1017/S0376892997000088.
- Fried JJ, Gilless K, Riley W, Moody T, de Blas C, Hayhoe K, Moritz M, Stephens S, Torn M. 2008. Predicting the effect of climate change on wildfire behavior and initial attack success. Climat Change. 87(S1):251–264.
- Galán C, López R. 2003. Sistemas de información geográfica. Madrid: RA-MA.
- Garcia CV, Woodard P, Titus S, Adamowicz W, Lee B. 1995. A logit model for predicting the daily occurrence of human caused forest-fires. Int J Wildland Fire. 5(2):101–111.
- Giglio L. 2015. MODIS Collection 6 Active Fire Product User’s Guide Revision A. University of Maryland, URL: http://modis-fire.umd.edu/files/MODIS_C6_Fire_User_Guide_A.pdf
- Guo FT, Su ZW, Wang GY. 2015. Predition model human-caused fire occurrence in the boreal forest of northern China. Chin J Appl Ecol. 26:2009–2106.
- Guo F, Zhang L, Jin S, Tigabu M, Su Z, Wang W. 2016a. Modeling anthropogenic fire occurrence in the boreal forest of China using logistic regression and random forests. Forests. 7(12):250.
- Guo F, Su Z, Wang G, Sun L, Lin F, Liu A. 2016b. Wildfire ignition in the forests of southeast china: Identifying drivers and spatial distribution to predict wildfire likelihood. Appl Geogr. 66:12–21.
- Glenn E, Huete A, Nagler P, Nelson S. 2008. Relationship between remotely-sensed vegetation indices, canopy attributes and plant physiological processes: what vegetation indices can and cannot tell us about the landscape. Sensors (Basel). 8(4):2136–2160.
- Gralewicz NJ, Nelson TA, Wulder MA. 2012. Factors in fluencing national scale wildfire susceptibility in Canada. For Ecol Manag. 265:20–29.
- Hair JF. 1998. Multivariate data analysis. 5th ed. NJ: Prentice-Hall.
- Hosmer D, Lemeshow S. 2000. Applied logistic regression. 2nd ed. New York: John Wiley.
- Hosmer DW, Hosmer T, Le Cessie S, Lemeshow S. 1997. A comparison of goodness-of-fit tests for the logistic regression model. Stat Med. 16(9):965–980.
- Jaiswal RK, Mukherjee S, Raju KD, Saxena R. 2002. Forest fire risk zone mapping from satellite imagery and GIS. Int J Appl Earth Observ Geoinf. 4(1):1–10. v. n.
- Jaiswal RK, Krishnamurthy J, Mukherjee S. 2005. Regional study for mapping the natural resources prospect & problem zones using remote sensing and GIS. Geocarto Int. 20(3):21–31. doi:10.1080/10106040508542352
- Jiménez-Valverde A. 2012. Insights into the area under the receiver operating characteristic curve (AUC) as a discrimination measure in species distribution modeling. Glob Ecol Biogeogr. 21:498–507. doi:10.1111/j.1466-8238.2011.00683.x
- Leblon B, Garcia PAF, Oldford S, MacLean DA, Flannigan M. 2007. Using cumulative NOAA-AVHRR spectral indices for estimating fire danger codes in northern boreal forests. Int J Appl Earth Observ Geoinf. 9(3):335–342. doi:10.1016/j.jag.2006.11.001
- Leo-Smith K, Balson EW, Abacar A. 1997. Niassa game reserve. management and development plan 1997–006. vols. I & II. Maputo: Direção Nacional de Florestas e Fauna Bravia, Ministério da Agricultura; p. 120.
- Legendre P, Legendre L. 1998. Numerical ecology. Amsterdam: Elsevier.
- Lozano FJ, Suarez-Seoane S, Kelly M, Luis E. 2008. A multi-scale approach for modeling fire occurrence probability using satellite data and classification trees: a case study in a mountainous Mediterranean region. Remote Sens Environ. 112(3):708–719. doi:10.1016/j.rse.2007.06.006
- MODIS Active Fire Detections extracted from MCD14ML distributed by NASA FIRMS. Available on-line https://earthdata.nasa.gov/firms
- Millar CI, Westfall RD, Delany DL, King JC, Graumlich LJ. 2004. Response of subalpine conifers in the Sierra Nevada, California, USA, to 20th-century warming and decadal climate variability. Arctic Ant Alpine Res. 36(2):181–200.2.0.CO;2]
- Martínez J, Vega-Garcıa C, Chuvieco E. 2009. Human-caused wildfire risk rating for prevention planning in Spain. J Environ Manage. 90(2):1241–1252.
- Martınez-Fernandez J, Chuvieco E, Koutsias N. 2013. Modelling long-term fire occurrence factors in Spain by accounting for local variations with geographically weighted regression. Nat Hazards Earth Syst Sci. 13:311–327.
- Mohammadi F, Bavaghar MP, Shabanian N. 2014. Forest fire risk zone modeling using logistic regression and GIS: an Iranian case study. Small Scale For. 13(1):117–125.
- Magnussen S, Taylor SW. 2012. Prediction of daily lightning- and human-caused fires in British Columbia. Int J Wildland Fire. 21(4):342–356.
- Menard SW. 2010. Logistic regression: from introductory to advanced concepts and applications, London: Sage; p. 377.
- McCune B, Grace JB, Urban DL. 2002. Analysis of ecological communities. MjM software design, 28, Oregon: Gleneden Beach. ISSN 0022–0981
- Norusis MJ. 2002. SPSS 11.0 guide to data analysis. NJ: Prentice Hall.
- Nhongo EJS, Fontana D, Guasselli LA, Esquerdo J. 2017. Caracterização fenológica da cobertura vegetal com base em série temporal NDVI/MODIS na reserva do Niassa – Moçambique. Revista Brasilera de Cartografia. 69(6):1175–1187. No /
- Oliveras I, Anderson LO, Malhi Y. 2014. Application of remote sensing to understanding fire regimes and bio- mass burning emissions of the tropical Andes. Global Biogeochem Cycles. 28(4):480–496.
- Oliveira S, Oehler F, San-Miguel-Ayanz J, Camia A, Pereira J. 2012. Modeling spatial patterns of fire occurrence in Mediterranean Europe using multiple regression and random forest. For Ecol Manag. 275:117–129. doi:10.1016/j.foreco.2012.03.003
- Padilla M, Vega-Garcıa C. 2011. On the comparative importance of fire danger rating indices and their integration with spatial and temporal variables for predicting daily human-caused fire occurrences in Spain. Int J Wildland Fire. 20(1):46–58.
- Parisien MA, Moritz MA. 2009. Environmental controls on the distribution of wildfire at multiple spatial scales. Ecol Monogr. 79(1):127–154.
- Prestemon JP, Chas-Amil ML, Touza JM, Goodrick SL. 2012. Forecasting intentional wildfires using temporal and spatiotemporal autocorrelations. Int J Wildland Fire. 21(6):743–754.
- Renard Q, Pélissier R, Ramesh BR, Kodandapani N. 2012. Environmental susceptibility model for predicting forest fire occurrence in the Western Ghats of India. Int J Wildland Fire. 21(4):368–379. doi:10.1071/WF10109
- Ribeiro NS, Shugart HH, Washington-Allen R. 2008. The effects of fire and elephants on species composition and structure of the Niassa Reserve, northern Mozambique. For Ecol Manage. 225:1626–1636. doi:10.1016/j.foreco.2007.11.033
- Ribeiro NS, Cangela A, Chauque A, Bandeira RR, Ribeiro-Barros AI. 2017. Characterisation of Spatial and temporal distribution of the fire regime in Niassa National Reserve, northern Mozambique. Int J Wildland Fire . 26(12):1021–1029.
- Ronde C, Goldammer JG, Wade DD, Soares RV. 1990. Prescribe fire in industrial plantation. In: Goldammer JG, editor. Fire in the tropical biota. Berlin: Spring-Verlag; pp. 216–278.
- Sass O, Sarcletti S. 2017. Patterns of long-term regeneration of forest fire slopes in the Northern European Alps – a logistic regression approach. Geografiska Annaler: Series A Phys Geogr. 99(1):56–71. doi:10.1080/04353676.2016.1263131
- San-Miguel-Ayanz J, Carlson JD, Alexander M, Tolhurst K, Morgan G, Sneeuwjagt R. 2003. Current methods to assess fire danger potential. In: Chuvieco E, editor. Wildland fire danger estimation and mapping. The role of remote sensing data. Singapore: World Scientific; pp. 21–61.
- Schwartz MW, Butt N, Dolanc CR, Holguin A, Moritz MA, North MP, Safford HD, Stephenson NL, Thorne JH, van Mantgem PJ. 2015. Increasing elevation of fire in the Sierra Nevada and implications for forest change. Ecosphere. 6(7):121. doi:10.1890/ES15-00003.1
- Syphard AD, Radeloff VC, Keuler NS, Taylor RS, Hawbaker TJ, Stewart SI, Clayton MK. 2008. Predicting spatial patterns of fire on a southern California landscape. Int J Wildland Fire. 17(5):602–613.
- Swets JA. 1988. Measuring the accuracy of diagnostic systems. Science. 240(4857):1285–1293.
- Shlisky A, Waugh J, Gonzalez P, Gonzalez M, Manta H, Santoso H, Alvarado A, Ainuddin Nuruddin DA, Rodríguez-Trejo R, Swaty D, Schmidt M, Kaufmann R, Myers R, et al. 2007. Fire, ecosystems and people: threats and strategies for global biodiversity conservation. GFI Technical Report 2007-2. The Nature Conservancy. Arlington, VA.
- Schroeder W, Prins E, Giglio L, Csiszar I, Schmidt C, Morisette J, Morton D. 2008. Validation of GOES and MODIS active fire detection products using ASTER and ETM + data. Rem Sens Environ. 112(5):2711–2726. doi:10.1016/j.rse.2008.01.005
- Scholes RJ, Pickett G, Ellery WN, Blackmore AC. 1997. Plant functional types in African Savannas and grasslands. In Smith TM, Shugart HH, and Woodward FI, editors. Plant functional types. IGBP Book Series No. 1. Cambridge, UK: Cambridge University Press; pp. 255–268.
- Timberlake J, Golding J, Clarke P. 2004. Niassa Botanical Expedition June 2003. Prepared for Sociedade para a Gestão e Desenvolvimento da Reserva do Niassa Moçambique, Biodiversity, N. 12.
- Taylor SW, Woolford DG, Dean CB, Martell DL. 2013. Wildfire prediction to inform fire management: statistical science challenges. Statist Sci. 28(4):586–615.
- Trapnell CG. 1959. Ecological results of woodland and burning experiments in Northern Rhodisia. J Ecol. 47(1):129–168. Vol.
- Turner JA, Lillywhite JWW, Pieslak Z. 1961. Forecasting for forest fire services. Technical note No.42. Geneva, Switzerland: Word Metereological Organization (WMO).
- Trollope WS, Trollope LA. 2004. Fire effects and management in Africa grasslands and savannas. In: Range and animal sciences and resource management.
- Wotton BM, Nock CA, Flannigan MD. 2010. Forest fire occurrence and climate change in Canada. Int J Wildland Fire. 19(3):253–271.
- Villagarcía T. 2006. “Regresión”, Curso de Metodología de Investigación Cuantitativa. Técnicas Estadísticas. CSIC.
- Yakubu I, Mireku-Gyimah D, Duker AA. 2015. Review of methods for modelling forest fire risk and hazard. Afr J Environ Sci Technol. 9(3):155–165.
- Ye T, Wang Y, Guo Z, Li Y. 2017. Factor contribution to fire occurrence, size, and burn probability in a subtropical coniferous forest in East China. PLoS One. 12(2):e0172110.
- Zhang Y, Lim S, Sharples JJ. 2016. Modelling spatial patterns of wildfire occurrence in South-Eastern Australia. Geomat Nat Hazards Risk. 7(6):1800–1815. doi:10.1080/19475705.2016.1155501
- Zhang HJ, Han XY, Dai S. 2013. Fire occurrence probability mapping of Northeast China with binary logistic regression model. IEEE J Sel Top Appl Earth Observations Remote Sensing. 6(1):121–127.
- Zarco-Tejada PJ, Rueda CA, Ustin SL. 2003. Water content estimation in vegetation with MODIS reflectance data and model inversion methods. Remote Sensing Environ. 85(1):109–124.
- Zumbrunnen T, Pezzatti G, Menendez P, Bugmann H, Bürgi M, Conedera M. 2011. Weather and human impacts on forest fires: 100 years of fire history in two climatic regions of Switzerland. For Ecol Manag. 261(12):2188–2199.