
 ?Mathematical formulae have been encoded as MathML and are displayed in this HTML version using MathJax in order to improve their display. Uncheck the box to turn MathJax off. This feature requires Javascript. Click on a formula to zoom.
Abstract
This study presents the liquefaction potential in Kahramanmaras city, which is located on the seismically active zones of East Anatolian and Dead Sea Faults in southern central Turkey. Geotechnical investigations in the city were carried out both in situ and laboratory. A total of 238 boreholes in the city were drilled in order to perform Standard Penetration Tests (SPT) and to define the physical properties (sieve analysis, Atterberg limits, soil classification) of the soils obtained from these boreholes. The stratigraphic structure underlying the city consists of various amounts of silt, clay, gravel and sand. Ground water table levels were found to vary from 0–6 m to 15 m or more in the study area. Liquefaction potential was studied based on the SPT results and a hypothetical earthquake with a magnitude of 7.5. The results indicate that the southern areas of the city have a high potential to liquefy, while the northern parts of the city lie mainly within nonliquefaction area. Analyses of liquefaction potential were mapped by using geographical information system (GIS)-based computer software. Evidently, the complied GIS maps could be effectively used by researchers and engineers for further studies on the purpose of land-use planning and urban development.
Introduction
Soil liquefaction, one of the major reasons of damage during earthquakes, is a phenomenon in which saturated alluvial soils lose their strength and stiffness. Procedure for assessment of liquefaction potential starts with the determination of whether the soils are potentially liquefiable nature in situ. It has been long understood that the liquefaction potential of soils depends on several parameters including grain size distribution, grain shape, density, thickness of deposits, as well as the position of groundwater table (Andrus Citation1994; Finn et al. Citation1994; Andrews and Martin Citation2000; Thevanayagam and Martin Citation2002; Naeini and Baziar Citation2004). During the recent decades, many regions have subjected serious damages because of the soil liquefaction (Seed and Idriss Citation1967; Holzer Citation1998; Yuan et al. Citation2003; Cetin et al. Citation2002, Citation2004; Beroya and Aydin Citation2008; Tosun et al. Citation2011; Lee et al. Citation2012). Structural failures in liquefied soils can take place as results of sand boiling and ground settlement, leading to bearing capacity failure of foundation, uplift of buried structures, slumps of roads and failure in slopes or lateral spreading. Two main approaches are available in order to estimate the liquefaction potential of soils, which are (i) laboratory tests on undisturbed soil samples, (ii) empirical methods developed from in situ tests. In the process of a laboratory test, the samples are almost always disturbed, and they are reconsolidated, which makes it difficult to rely on laboratory methods. Even though, today, very high-quality sampling techniques are available, implying very small disturbance, these high-quality techniques (i.e. Sherbrooke, Laval) may still cause significant loss in structure, and further disturbance may be caused by sample transportation and specimen preparation for an experimental investigation in a laboratory (Clayton et al. Citation1992; Hight et al. Citation1992). On the other hand, field tests offer more practicality, and they do not present the problems associated with laboratory tests; hence, they are being preferred over laboratory tests. However, the Standard Penetration Test (SPT), Cone Penetration Test (CPT), Becker Penetration Test (BPT) and measurement of in situ shear wave velocity (Vs) testing methods have a level of enough reliability to predict the liquefaction potential of soils, the most commonly used in situ testing method is the SPT (Youd et al., Citation2001). The use of SPT for assessment of liquefaction potential was first employed in the Great Alaska (M > 8) and Niigata (M = 7.5) Earthquakes in 1964, and has made a substantial progress by numerous researches (Ohsaki Citation1966; Seed and Idriss Citation1971, Citation1982; Seed et al. Citation1985; Liao et al. Citation1988; NCEER Citation1997; Toprak et al. Citation1999; Youd et al. Citation2001; Cetin et al. Citation2004; Idriss and Boulanger Citation2006; Mhaske and Choudhury Citation2010; Muduli and Das Citation2014; Muduli et al. Citation2014; Muduli and Das Citation2015a, Citation2015b).
The advancement of the technology and computers allowed Geographic Information Systems (GIS) to be utilized for many applications in geotechnical engineering including to generate hazard maps (Dai et al. Citation2001). The GIS is computer software employed to analyse, store and visualize liquefaction potential on a map. The GIS will identify location of potential liquefaction hazards that will help in development in relevant areas, particularly if the area is available for urban and industrial projects requiring various construction facilities. Thus, the GIS softwares have been effectively used to evaluate natural hazards, groundwater vulnerability evaluation and site selection for land-use planning (Malczewski Citation2004; Nikolakaki Citation2004; Mancini et al. Citation2009; La Rosa Citation2014) .
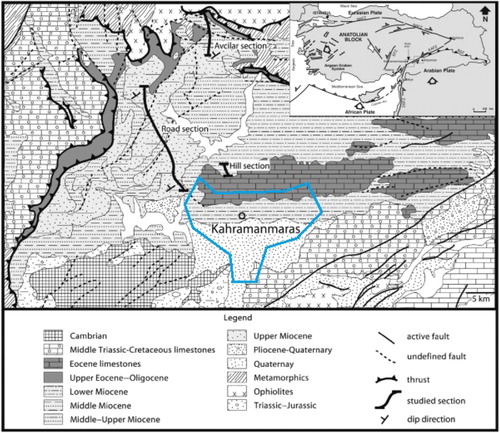
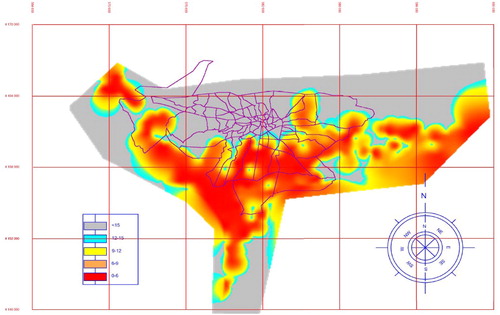
The objective of the present research is to map the liquefaction potential in Kahramanmaras, Turkey, by using GIS-based computer software. The city of Kahramanmaras is located at 37°35'N 36°55'E on the seismically active zones of East Anatolian and Dead Sea Faults in southern central Turkey. The city with a population of 575,000 lies on a plain at the foot of the Ahir Mountain (). Today, its population, tourism potential and industrial importance make the city metropolitan. Liquefaction is one of the most significant factors contributing to the overall earthquake hazard that may produce enormous human and economic losses in the city. Therefore, liquefaction potential in the city has been studied for the first time ever using the approach by Youd et al. (Citation2001). Groundwater depth as well as liquefaction potential maps has been estimated, and the analyses of the results are discussed to be able to reduce the risk of earthquake damage in the study area. High-resolution maps were produced by employing the nearest neighbour value interpolation method.
Figure 1. Location and detailed geological map of Kahramanmaras area (modified from Yilmaz Citation2006; Hüsing et al. Citation2009).
Geology of the study area
Turkey is located on the Mediterranean segment of the Alpide belt or Alpine-Himalayan orogenic belt. The Alpine orogeny is being formed by the collision of Africa and India with Eurasia in the north. Meanwhile, the collision between India and Asia causes the Himalayan orogeny. Alpine-Himalayan orogenic belt has a nonhomogeneous seismicity, which is mainly concentrated along the plate edges. The tectonics of the Mediterranean region influences the Eurasian, Arabian and African plates (McKenzie Citation1970). However, eastern Mediterranean is more complex. The study area receives an increased seismic activity, and the reason for that might be due to the small fast-moving plates(Chorowicz et al. (Citation2005); McKenzie Citation1972; Alptekin Citation1973; Dewey and Şengör Citation1979; Erdik et al. Citation1985; Westaway Citation2003; Cabalar Citation2006, Citation2008).
The Kahramanmaras basin is located in southern central Turkey, where the tectonic plates of Africa, Arabia and Anatoliameet. The collision of Arabian and Eurasian plates along the Bitlis suture zone over the years caused a trough to be formed in front of the thrust sheets, as a result thick alluvial sediments were deposited there (Sengor and Yilmaz Citation1981; Karig and Kozlu Citation1990; Yilmaz Citation1993; Hüsing et al. 2009). Hence, Kahramanmaras is a tectonic-based alluvium plain whose boundaries are under the control of fault lines. The length of Kahramanmaras plain lying between Cimen and Ahir Mountains is 40 km, and the width from north to south is nearly 20 km. According to several researches (Karig and Kozlu Citation1990; Yilmaz Citation1993), the Kahramanmaras basin is part of a basin extending from Hakkari in south-eastern Turkey to Adana in southern central Turkey. The deposits that are dated as far back as the Eocene epoch in the Kahramanmaras area constitute a part of the Arabian Basin (Robertson et al. Citation2004). Gul et al. (Citation2005) suggest that limestone and claystone deposits can be found in the basin, on top of which lies shallow marine deposits. Three various sections of the Kahramanmaras city have been studied by Hüsing et al. (2009): (i) hill section, the lower 200 m was sampled in the southern area of the study region; (ii) road section, around 5 km along the northern Kahramanmaras and (iii) Avcilar section, the upper 1.5 km stratigraphic transect near the Avcilar village. The base of the hill section consists of nummulitic limestones of Eocene age, pursued by red, conglomeratic sediments with several basalt layers (Senel Citation2002; Hüsing et al. 2009). The limestones have macrofossils including sponges, corals, bivalves, echinoderms and gastropods, showing a shallow marine environment. At the base of the Road section, there is 1-km deep stratum composed of enormous conglomerates with sand lenses, which indicates cross-bedding and interlinking of braided river channels. An oyster rich layer accompanied by marl and sandstone follows these conglomerates, which indicates a shift into shallow marine formation. Certain intervals are characterized by massive debris flows and sandstone deposits, while others are dominated by primarily clay. In NW, the bottom level of the stratigraphy can be found, and it continues to the Avcilar section in NE, which suggests the end of the Road section to be at the towards NNW from Kahramanmaras, at the highest point. In NE, in the Avcilar section, 1.5-km-thick debris flow deposits with occasional layers conglomerates can be observed Based on sedimentological properties, a shoaling trend has not been determined close to the upper section (Senel Citation2002; Yilmaz et al. Citation2006; Hüsing et al. 2009) ().
Seismotectonics of the study area
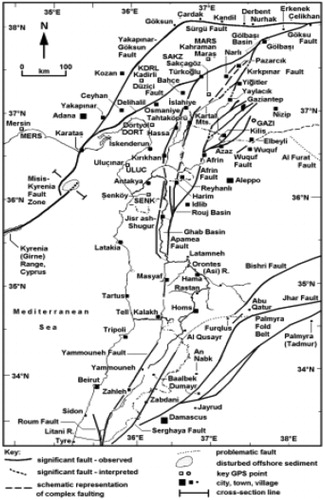
In the seismic hazard map of Turkey, Kahramanmaras is included in a first-degree seismic zone (Ministry of Reconstruction and Settlement Citation1996).The Dead Sea Fault Zone (DSFZ) and East Anatolian Fault Zone (EAFZ) are influential on the structural evolution of the Kahramanmaras Basin (). The DSFZ is a series of faults stretching over 1000-km distance (Garfunkel et al. Citation1981; Gursoy et al. Citation2003; Cabalar Citation2006), uniting the plates of Africa and Arabia. It runs through Israel, Jordan, Lebanon, Syria and Turkey in the north to the Red Sea while it forms the transform boundary between the Arabian and African plates (Westaway Citation1994). It then branches off to the east, where it passes west of Gaziantep Basin to form the EAFZ and merges with the boundaries of the Anatolian and African plates. There have been many kinematic analysis studies of the fault zone that depict it joining the EAFZ at a junction near the city of Kahramanmaras (Tatar et al. Citation2004; Cabalar Citation2006; Citation2008), but a linkage geometry for the EAFZ and for the boundary between the plates of Anatolia and Africa cannot be easily defined (Yurtmen et al. Citation2002; Charovicz et al. 2005; Cabalar Citation2008). The DSFZ has witnessed multiple earthquakes that were high in magnitude. Westaway (Citation1994) studied the DSFZ, and he divided the zone into three segments: (1) northern segment which is north of around a latitude of +34.5°, (2) southern segment at around a latitude of +33.5° and (3) the central segment at + 30°. The three sections forming the braided system of the DSFZ are (i) Afrin fault zone, (ii) East Hatay fault zone and in the west (iii) Amanos Fault Zone (AFZ) which acts as a boundary between the African and Arabian plates (Yurtmen et al. Citation2002).The most recent strike-slip took place east of the Amanos Range and Karasu Rift, and it sidestepped onto the west end of the Gaziantep Basin (Cabalar Citation2008).
Figure 2. Map of significant fault segments of the region (Westaway Citation2003).
Despite the fact that the EAFZ has witnessed many destructive earthquakes over 2000 years (Willis Citation1928; Sieberg Citation1932; Ergin et al. Citation1967; Ambraseys Citation1970, Citation1989; Orgulu et al. Citation2003; Turkelli et al. Citation2003), it has been known as a low seismicity region since last century (Jackson and McKenzie Citation1988; Ambraseys and Jackson Citation1998). The largest known earthquakes in the region took place in the years 1114, 1513 and 1893 with magnitudes of 7.8, 7.4 and 7.1, respectively (Ambraseys and Jackson Citation1998; Nalbant et al. Citation2002). The dormancy of the EAFZ in terms of seismicity suggests the presence of an active fault line, given the active seismicity history of the region (Saroglu et al. Citation1992; Cetin et al. Citation2003). Nalbant et al. (Citation2002), using the Coulomb stress model showed that a hazard is possible near Kahramanmaras, where the segment was ruptured during the earthquakes of 1114(M > 7.8) and 1513 (M > 7.4). The researchers stated that the potential earthquake could be at a magnitude of 7.3 or even higher. In view of this, the study of Balakani and Moskvina (Citation2004) examines the possible locations of major earthquakes by evaluating the seismogenic zone maps of the EAFZ and the north section of the DSFZ. The researchers estimated the recurrence intervals of maximum potential earthquakes, and they calculated the time sequences of the tremors that would occur in later centuries. The study defined the most probable locations for major earthquakes for the study region for the twenty-first century (Cabalar Citation2008).
Field investigations
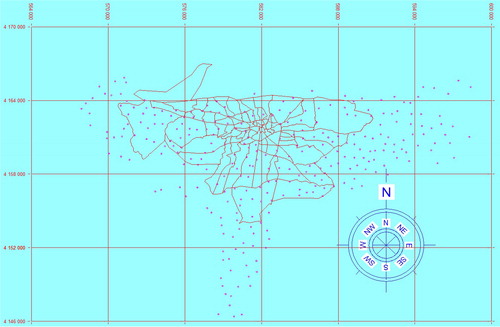
Both laboratory and field investigations were carried out on the study area. In selected points, 238 boreholes were opened, which were of 3570 m length each. Undisturbed and disturbed soil samples were collected from each borehole, and the groundwater table level for every point was also determined. The boreholes depths fell between 4.5 and 22.0 m, with most boreholes having a depth in the region of 15 m belowground level. The locations of the boreholes are illustrated in . A total of 2380 SPT tests were carried out in the field in compliance with ASTM D-1586. The SPT was carried out by a donut-type hammer used at every 1.5 m at the bottom of the boreholes.
Figure 3. Locations of boreholes in the study area.
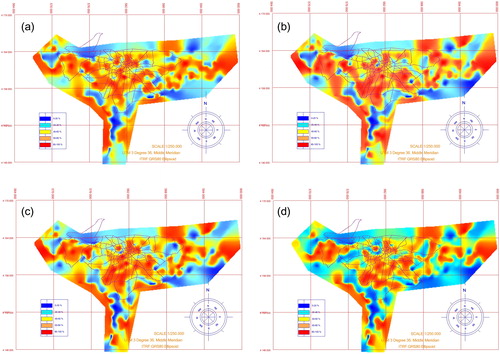
In the field investigations, a variety of soil types were detected. indicates the SPT values recorded at different depths. The SPT values at 1.5–3.0 m, 6.0–7.5 m, 9.0–10.5 m and 13.5–15.0 m are shown in the , respectively. The lowest SPT blow counts were determined in southern part of the Kahramanmaras city. In certain locations at the bottom of a borehole with 4.5 m depth, the overall SPT value was found to be 10, even at certain locations the values fell below 10. At relatively less depths, the SPT values increase and the soil density values at these levels vary. In the region, in relatively low depths in the southern region of city, low SPT counts were seen, whereas at deeper depths, large SPT values were realised. At the depths from 6.0 to 7.5 m, dense and/or very dense sandy gravel and sand were discerned; hence, the SPT values were to be increased. At deeper depths, the SPT values were seen as 40 and more. Actually, the SPT testing is most reliable in granular soils including silt and sand, which are potentially liquefiable deposits with lower SPT records. A major shortcoming with the SPT tasting is that clayey soils have different driving resistance if dry or moist. As can be seen in the SPT values in the southern parts of the city are much lower than those in the northern part of it. As a result, the SPT blows point the presence of certain soil layers prone to liquefaction in some regions particularly southern part of the city. Measurement of groundwater level in boreholes has also been carried out during the field studies, as building up of pore water pressure is one of the major reasons of soil liquefaction phenomena (). Groundwater level in the study area was found to be relatively higher in southern part of the city.
Figure 4 a. Distribution of SPT blow counts at a depth between 1.5 m and 3.0 m. b. Distribution of SPT blow counts at a depth between 6.0 m and 7.5 m. c. Distribution of SPT blow counts at a depth between 9.0 m and 10.5 m. d. Distribution of SPT blow counts at a depth between 13.5 m and 15.0 m.
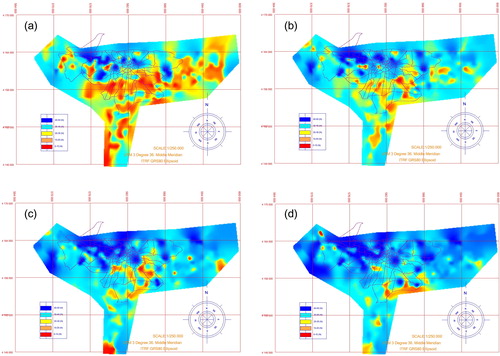
Figure 5. Groundwater level in the study area.
Laboratory studies
Following investigations in the field, laboratory tests were performed in order to calculate some geotechnical properties of soil samples obtained from the boreholes. It is a long understood that sieve analysis results are found to be effective on the liquefaction potential (Iwasaki Citation1986). The sieve analyses results in the present study indicate that all samples are composed of about 60.2% coarse (sand-gravel), and 39.8% fines (clay-silt). The samples displayed varying PL and LL values in the Atterberg limit tests. The liquid limits (LL) of the samples change from 35.0% to 87.0%, while the plasticity indices (PI) vary from 5 to 49. The fines obtained in the northern area of the Kahramanmaras city were found to be in low plastic character, because of the high sand/silt content. The soils were classified in accordance with the Unified Soil Classification System (USCS), and they were identified as a CL-ML, which is a silty clay of low plasticity. The fines in the southern area of the study area were found to be relatively high plasticity soils and have been identified as a CH-MH, which is a silty clay with high plasticity. Coarse soils obtained from the study area compose of both gravel and sand, which built the bottom of alluvium layers in the field. These dense and/or very dense soils, which were composed of around 30% fines (silt-clay), and their sieve analysis results were SW-GW, SM-GM and SP-GP, which are well-graded sand with gravel, silty sand with gravel and poor sand with gravel, respectively. Fine and coarse-grained soils were statistically evaluated, and plots were generated for different depths, which are given in .
Figure 6 a. Fines content of the soil sample at a depth between 1.5 m and 3.0 m. b. Fines content of the soil sample at a depth between 6.0 m and 7.5 m. c. Fines content of the soil sample at a depth between 9.0 m and 10.5 m. d. Fines content of the soil sample at a depth between 13.5 m and 15.0 m.
Assessment of liquefaction potential
Liquefaction potential of soils can be estimated by using cyclic laboratory tests and empirical methods based on in situ tests. However, employing laboratory tests could be hard because of difficulties in obtaining undisturbed samples. Therefore, empirical methods using the in situ penetration testing results have been popular in engineering applications. In our study, the SPT-based approach presented by Youd et al (Citation2001) has been conducted. Seed and Idriss (Citation1971) developed a simpler method that compares the cyclic stress ratio (CSR) with the cyclic resistance ratio (CRR) in order to characterize the earthquake-induced loading. The calculation of CSR is given in EquationEquation 1(1)
(1) .
(1)
(1)
where amax is the maximum gravitational acceleration (g= 9.81 m/s2), σvo and σ'vo are total and effective vertical stresses, rd is the stress reduction factor, which is estimated using EquationEquations 2
(2)
(2) and Equation3
(3)
(3) for different depths (z) (Liao, Veneziano, and Whitman Citation1988).
(2)
(2)
(3)
(3)
The CRR, which is obtained using the correlation between corrected SPT-N60 and the CSR, indicates the capability of the soil against liquefaction. The relation is suggested for cohesionless soils with fines contents of 35%, 15% and 5% or less (Youd et al. Citation2001). As stated by Idriss and Boulanger (Citation2008), the more the fines contents are the more resistant the soil is to liquefaction. Although the relation was suggested for various fines content, the soils with 0% fines content could also be susceptible to liquefaction. A major factor determining the liquefaction is believed to be a high ratio of the fines that make up the stress-carrying skeleton in the matrix where the coarse grains float within the matrix. Intergranular void ratio (es) and transition fines content (FCt) are the two factors that can show the intrinsic relationship between the sand (which are coarse) and the clay (which are fine) particles. According to the researchers even though the transition can occur at any ratio of fines, it is possible that the load-carrying matrix is formed by the ratio of the fines when it is over 35%. The transition can take place depending on factors including gradation, mineralogical composition, grain shape and fabric (Thevanayagam Citation1998; Mitchell and Soga Citation2005; Monkul and Ozden Citation2007; Cabalar Citation2010; Cabalar and Hasan Citation2013; Cabalar and Mustafa Citation2015, Citation2017).The corrected SPT-N60 values are estimated by using the following equation (EquationEquation 4(4)
(4) ).
(4)
(4)
Where Nm is the uncorrected SPT blow count; CE, CN, CR, CB and CS are correction factors for the energy ratio of hammer, effective overburden stress, rod length, borehole diameter and samplers, respectively. In the present research, the SPT was employed using a donut hammer, in which the rod-energy ratio was accepted as 45% (Seed and De Alba Citation1986). The CN value was estimated using the EquationEquation 5(5)
(5) proposed by Liao, Veneziano, and Whitman Citation1988.
(5)
(5)
In EquationEquation 5(5)
(5) , Pa is atmospheric pressure, and σ'vo is effective overburden stress value (Youd et al. Citation2001). Liquefaction potential is assessed by a safety factor (FS) and formula for the calculation is given in EquationEquation 6
(6)
(6) .
(6)
(6)
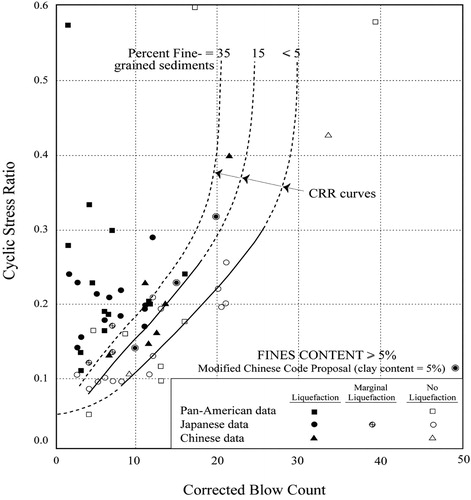
The CRR curves, which are shown in , indicate the liquefaction risk for an earthquake with magnitude of 7.5. Then, a magnitude scaling factor (MSF) may need to be considered in FS estimates for different magnitude earthquakes (Seed and Idriss Citation1982; Youd et al. Citation2001). In the light of the studies by Campbell (Citation1997) and Ozcep et al. (Citation2009), a hypothetical earthquake with a magnitude of 7.5 and a peak ground acceleration level of 0.42 g was studied in order to arrive at liquefaction potential estimates. The liquefaction assessments were completed using SPT blow counts recorded at each 1.5-m interval in all boreholes. Thus, the liquefaction potential of soils in each layer was evaluated and mapped individually in accordance with the approach proposed by Seed et al. (Citation2003), which suggests that the layers with N60 values larger than 30 or above groundwater table were identified as non-liquefiable.
Figure 7. The CRR curves for M = 7.5 (modified from Mansoor et al. Citation2004).
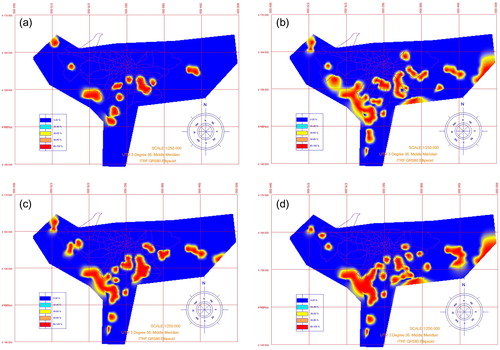
On 17 August and 12 November 1999, the wider area of Izmit, Adapazari, Duzce and Bolu in Turkey was hit by two major earthquakes exceeding magnitude 7 occurred within three months. The widespread damaging effects of liquefaction during the two seismic shocks, which ruptured about 200-km segment of the North Anatolian Fault, accelerated soil liquefaction studies in Turkey (Bakir et al. Citation2002; Cetin et al. Citation2004; Yalcin et al. Citation2008; Tosun et al. Citation2011). In this study, definition of five different levels of liquefaction potential in percentages is proposed for the study area. The results of the liquefaction analyses are presented in maps, which were compiled by using GIS software for different depth of soil layers (). It has been realised in the previous sections of the present study that the main portion of the investigation area is composed of fine-grained alluvium in the upper level and relatively coarse-grained soils below this depth. The liquefaction potential of the samples in the range of 6.0–7.5 m depth below the ground surface was found to be relatively higher than the layers of gravel-sand mixtures and sandy layers at deeper levels(>9.0 m) because of the low relative density values. It is seen that the potential of liquefaction is low for the depths lower than 3.0 m. This might be because of the groundwater table position. Actually, various maps indicating liquefaction potential are produced by repeating the same procedure for each layer. As seen in , high liquefaction potential regions were not observed in 1.5 m–3.0 m depth layer. Nevertheless, certain limited regions have high liquefaction potential likely because of the soil deposits with fines. The map compiled for the liquefaction potential at layer of 6.0-m–7.5-m interval below the surface was found to be different from the previously produced one. The liquefiable regions on the map produced for layer of 6.0-m–7.5-m interval overspread a significant section of the city centre. Further, at the southern part of the area, possible liquefiable areas have realized. Because the soil layers within this depth consist of silt-sand at loose density, the risk for liquefaction is higher at this level. Certain similarities can be observed between the liquefaction potential map produced for the interval depths of 9.0 m–10.5 m and the previous map. A low liquefaction potential was observed for the intervals of 9.0 m–10.5 m, while a relatively larger liquefiable region was detected for the intervals of 6.0 m–7.5 m. Much larger areas were demonstrated with liquefaction potential for the layers 13.5 m–15.0 m depth. It is obviously seen that area of regions with high liquefaction potential gets larger/smaller by change in depth. Certain areas with high liquefaction potential appear in outside the city centre. In the southern part of the investigation area at layers of various depths, soils with liquefaction potential are realized. In the end, the liquefaction maps were found to be very useful for certain areas with liquefaction risk. Actually, the GIS softwares have recently started to become frequently employed tools in order to create various hazard maps owing to the advances in computer technologies.
Figure 8 a. Liquefaction potential of the study area at a depth between 1.5 m and 3.0 m. b. Liquefaction potential of the study area at a depth between 6.0 m and 7.5 m. c. Liquefaction potential of the study area at a depth between 9.0 m and 10.5 m. d. Liquefaction potential of the study area at a depth between 13.5 m and 15.0 m.
Conclusions
Turkey had experienced a fast population growth at urban settlements accompanied by an intensive construction activity in the seismic prone regions. However, seismic hazard sensitive urban planning and seismic-resistant construction have not been the top priority. Therefore, Turkey has been recently in the process of renewing its legal structure to reduce the influences of possible seismic hazards. Hence, regional city plans are going to be updated by reconsidering the geotechnical and seismic characteristics of the urban zones including southern central of the country. In this respect, a series of maps using GIS software were produced in order to illustrate the liquefaction potential in Kahramanmaras located on the seismically active zones of Turkey. Field investigations revealed that the lowest SPT blow counts pointing higher liquefaction risk were found to be in southern part of the Kahramanmaras city, although various types of soils were observed in the study area. In the lower depths, the soils consisted mostly of alluvium, and they were fine or coarse grained or a mixture of them. It is known that the presence of alluvial soil and high groundwater table increases the liquefaction potential of the already seismically active area (Youd et al. Citation2001). Therefore, Kahramanmaras is on a region with a high liquefaction potential, which needs to be addressed for urban planning and risk management. A proper planning and assessment of the risks can be effectively done using the liquefaction potential maps produced for the study area. However, we believe further studies need to be done in order to improve the accuracy of the estimates by incorporating in situ cyclic stress ratio, which can be found by site-specific site response analyses.
Disclosure statement
No potential conflict of interest was reported by the authors.
References
- Alptekin O. 1973. Focal mechanism of earthquakes in Western Turkey and their tectonic implications [PhD dissertation]. USA: New Mexico Institute of Mining and Technology.
- Ambraseys NN. 1970. Some characteristic features of the Anatolian fault zone. Tectonophysics. 9(2–3):143–165.
- Ambraseys NN, Jackson JA. 1998. Faulting associated with historical and recent earthquakes in the eastern Mediterranean region. Geophys J Int. 133:390–406.
- Ambraseys NN. 1989. Temporary seismic quiescence: SE Turkey. Geophys J. 96(2):311–331.
- Andrews DCA, Martin GR. 2000. Criteria for liquefaction of silty soils. Proceedings of the 12th World Conference on Earthquake Engineering Auckland, New Zealand, paper 0312.
- Andrus RD. 1994. In-situ characterization of gravelly soils that liquefied in the 1983 Borah Peak Earthquake [PhD Dissertation]. University of Texas at Austin.
- ASTM D1586-11, Standard Test Method for Standard Penetration Test (SPT) and Split-Barrel Sampling of Soils. ASTM International, 100 Barr Harbor Drive, PO Box C700, West Conshohocken, PA 19428-2959, United States.
- Bakir S, Sucuoglu H, Yilmaz T. 2002. An overview of local site effects and the associated building damage in Adapazarı during the 17 August 1999 Kocaeli earthquake. Bull Seism Soc Am. 92(1):509–526.
- Balakani LM, Moskvina AG. 2004. Seismogenic zones of eastern Anatolia and the Dead Sea rift: probable locations of future large earthquakes. Izv Phys Solid Earth. 40(12):972–990.
- Beroya MAA, Aydin A. 2008. Seismic hazard analysis of Laoag City, Northern Philippines for liquefaction potential assessment. Eng Geol. 96(1–2):28–42.
- Cabalar AF. 2006. An overview of earthquake ground response analysis: A case study of Gaziantep city, Turkey: IAEG The Geological Society of London, paper number 753.
- Cabalar AF. 2008. An assessment of earthquake hazard in Gaziantep, Turkey. EJGE. Volume 13, Bundle F, Paper 6.
- Cabalar AF. 2010. Applications of the oedometer, triaxial and resonant column tests to the study of micaceous sands. Eng Geol. 112(1–4):21–28.
- Cabalar AF, Hasan RA. 2013. Compressional behaviour of various size/shape sand-clay mixtures with different pore fluids. Eng Geol. 164:36–49.
- Cabalar AF, Mustafa WS. 2015. Fall-cone tests on clay-sand mixtures. Eng Geol. 192:154–165.
- Cabalar AF, Mustafa WS. 2017. Behaviour of sand-clay mixtures for road pavement subgrade. Int J Pave Eng. 18(8):714–726. http://dx.doi.org/10.1080/10298436.2015.1121782
- Campbell KW. 1997. Empirical near-source attenuation relationships for horizontal and vertical components of peak ground acceleration, peak ground velocity and pseudo-absolute acceleration response spectra. Seismol Res Lett. 68(1):154–179.
- Cetin H, Guneyli H, Mayer L. 2003. Paleoseismology of the Palu-Lake Hazar segment of the East Anatolian Fault Zone, Turkey. Tectonophysics. 374(3–4):163–197.
- Cetin KO, Youd TL, Bray JD, Seed RB, Sancio RB, Lettis W, Yilmaz MT, Stewarst JP, Durgunoglu HT, Onalp A. 2002. Liquefaction-induced ground deformation at Hotel Sapanca during Izmit-Turkey Earthquake. J. Soil Dyn Earthquake Eng. 22(9–12):1083–1092.
- Cetin KO, Seed RB, Der Kiureghian A, Tokimatsu K, Harder LF, Kayen RE, Moss RES. 2004. SPT-Based probabilistic and deterministic assessment of seismic soil liquefaction potential. J Geotech Geoenviron Eng. 130(12):1314–1340.
- Chorowicz J, Dhont D, Ammar O, Rukieh M, Bilal A. 2005. Tectonics of the Pliocene Homs basalts (Syria) and implications for the Dead Sea Fault Zone activity. J Geol Soc. 162(2):259–271.
- Clayton CRI, Hight DW, Hopper RJ. 1992. Progressive destructuring of Bothkennar clay: implications for sampling and reconsolidation procedures. Géotechnique. 42(2):219–240.
- Dai FC, Lee CF, Zhang XH. 2001. GIS-based geo-environmental evaluation for urban land-use planning: a case study. Eng Geol. 61(4):257–271.
- Dewey JF, Şengör AMC. 1979. Aegean and surrounding regions: complex multi-plate and continuum tectonic in a convergent zone. Geol Soc Am Bull. 90(1):84–92.
- Erdik M, Doyuran V, Akkaş N, Gülkan P. 1985. A probabilistic assessment of the seismic hazard in Turkey. Tectonophysics. 117(3–4):295.
- Ergin K, Guclu U, Uz Z. 1967. A catalogue of earthquakes for Turkey and surrounding area (11AD to 1964AD). Tech Univ Mining Eng Fac Publ. 24:189.
- Garfunkel Z, Zak I, Freund R. 1981. Active faulting in the Dead Sea rift. Tectonophysics. 80(1–4):1–26.
- Gul M, Darbas G, Gurbus K. 2005. Tectono-Stratigraphic position of Alacik Formation (Latest Middle Eocene – Early Miocene) in the Kahraman Maras Basin. In Turkish with English abstract and summary. Istanbul Uni Müh Fak Q18 Yerbilimleri Dergisi. 18:183–197.
- Gursoy H, Tatar O, Piper JDA, Heimann A, Mesci L. 2003. Neotectonic deformation linking the east Anatolian and Karatas- Osmaniye intercontinental transform fault zones in the Gulf of Iskenderun, southern Turkey, deduced from paleomagnetic study of the Ceyhan-Osmaniye volcanics. Tectonics. 22(6):1067.
- Hight DW, Boese R, Butcher AP, Clayton CRI, Smith PR. 1992. Disturbance of Bothkennar clay prior to laboratory testing. Géotechnique. 42(2):199–218.
- Holzer TL. 1998. The Loma Prieta, California, Earthquake of October 17, 1989– Liquefaction, USGS Professional Paper 1551-B, pp. 314, 1998.
- Hüsing SK, Zachariasse WJ, Hinsbergen D, Krijgsman W, Inceoz M, Harzhauser M, Mandic O, Kroh A, 2009. Oligocene-Miocene basin evolution in SE Anatolia, Turkey: constraints on the closure of the eastern Tethys gateway. In: Van Hinsbergen DJJ, Edwards MA, Govers R, editors. Collision and collapse at the Africa–Arabia–Eurasia Subduction Zone. Vol 311.The Geological Society, London: Special Publications; p. 107–132. 0305-8719/09/$15.00 # The Geological Society of London 2009.
- Finn WDL, Ledbetter RH, Wu G. 1994. Liquefaction in silty soils: design and analysis. In: S. Prakash & P. Dakoulas (eds), Ground failures under seismic conditions. New York: Geotechnical Special Publication 44, ASCE; p. 51–76.
- Idriss IM, Boulanger RW. 2006. Semi-empirical procedures for evaluating liquefaction potential during earthquakes. Soil Dyn Earthq Eng. 26(2–4):115–130.
- Idriss IM, Boulanger RW. 2008. Soil liquefaction during earthquakes. EERI Publication, Monograph MNO-12, Earthquake Engineering Research Institute, Oakland. https://www.eeri.org/
- Iwasaki T. 1986. Soil liquefaction studies in Japan: state of the art. Soil Dyn Earthquake Eng. 5(1):1–71.
- Jackson J, McKenzie DP. 1988. The relationship between plate motion and seismic moment tensors, and the rates of active deformation in the Mediterranean and Middle-East. Geophys J R Astron Soc. 93(1):45–73.
- Karig DE, Kozlu H. 1990. Late Paleogene-Neogene evolution of the triple junction region near Maras, south-central Turkey. J Geol Soc London. 147(6):1023–1034.
- La Rosa D. 2014. Accessibility to greenspaces: GIS based indicators for sustainable planning in a dense urban context. Ecol Indic. 42:122–134.
- Lee WF, Ishihara K, Chen CC. 2012. Liquefaction of silty sand, preliminary studies from recent Taiwan, New Zeland, and Japan Earthquakes. One Year after 2011 Great East Japan Earthquake: International Symposium on Engineering Lessons Learned from the Giant Earthquake, Tokyo.
- Liao SSC, Veneziano D, Whitman RV. 1988. Regression models for evaluating liquefaction probability. J Geotech Eng. 114(4):389–409.
- Malczewski J. 2004. GIS-based land-use suitability analysis: a critical overview. Prog Plann. 62(1):3–65.
- Mancini F, Stecchi F, Gabbianelli G. 2009. GIS-based assessment of risk due to salt mining activities at Tuzla (Bosnia and Herzegovina). Eng Geol. 109(34):170–182.
- Mansoor NM, Niemi TM, Misra A. 2004. A GIS based assessment of liquefaction potential of the city of Aqaba, Jordan. Environ Eng Geosci. 10(4):297–320.
- McKenzie DP. 1970. Plate tectonics of the Mediterranean region. Nature. 226(5242):239–243.
- McKenzie DP. 1972. Active tectonics of the Mediterranean region. Geophys JR Astron Soc. 30(2):109–185.
- Ministry of Reconstruction and Settlement. 1996. Seismic Hazard Map of Turkey.
- Mitchell JK, Soga K. 2005. Fundamentals of soil behavior. 3rd ed. Hoboken, NJ: John Wiley and Sons; p. 577.
- Mhaske SY, Choudhury D. 2010. GIS-based soil liquefaction susceptibility map of Mumbai city for earthquake events. J Appl Geophys. 70(3):216–225.
- Monkul MM, Ozden G. 2007. Compressional behavior of clayey sand and transition fines content. Eng Geol. 89(3–4):195–205.
- Muduli PK, Das SK. 2014. Evaluation of liquefaction potential of soil based on standard penetration test using multi-gene genetic programming model. Acta Geophys. 62(3):529–543.
- Muduli PK, Das SK, Bhattacharya S. 2014. CPT-based probabilistic evaluation of seismic soil liquefaction potential using, multi-gene genetic programming. Georisk. 8(1):14–28.
- Muduli PK, Das SK. 2015a. Model uncertainty of SPT-based method for evaluation of seismic soil liquefaction potential using multi-gene genetic programming. Soils Found. 55(2):258–275.
- Muduli PK, Das SK. 2015b. First order reliability method for probabilistic evaluation of liquefaction potential of soil using genetic programming. Int J Geomech. 15(3):04014052.
- Naeini SA, Baziar MH. 2004. Effect of fines content on steady state strength of mixed and layered samples of sand. J Soil Dyn Earthquake Eng. 24(3):181–187.
- Nalbant SS, McCloskey J, Steacy S, Barka AA. 2002. Stress accumulation and increased seismic risk in eastern Turkey. Earth Planet Sci Lett. 195(3–4):291–298.
- NCEER. 1997. Proceedings of the NCEER Workshop on Evaluation of Liquefaction Resistance of Soils, Edited by Youd, T. L., Idriss, I. M., Technical Report No. NCEER-97-0022, December 31, 1997.
- Nikolakaki P. 2004. A GIS site-selection process for habitat creation: estimating connectivity of habitat patches. Landscape Urban Plann. 68(1):77–94.
- Ohsaki Y. 1966. Niigata Earthquakes, 1964, building damage and soil conditions. Soils Found. 6(2):14–37.
- Ozcep F, Tezel O, Asci M. 2009. Correlation between electrical resistivity and soil-water content: Istanbul and Golcuk. International Journal of Physical Sciences . 4(6):362–365.
- Orgulu G, Aktar M, Turkelli N, Sandvol E, Barazangi M. 2003. Contribution to the seismotectonics of the Eastern Anatolian Plateau from moderate and small size events. Geophys Res Lett. 30/ 24:8040.
- Robertson A, Unlügenç ÜC, İnan N, Taşli K. 2004. The Misis-Andirin Complex: a Midtertiary melange related to late-stage subduction of the Southern Neotethys in S Turkey. J Asian Earth Sci. 22(5):413–453.
- Saroglu F, Emre O, Kuscu I. 1992. The East Anatolian fault zone of Turkey. Ann Tectonicae. VI:99–125.
- Seed HB, Idriss IM. 1967. Analysis of soil liquefaction: Niigata earthquake. J Soil Mech Foundation Div Proc ASCE SM3. 93:83–108.
- Seed HB, Idriss IM. 1971. Simplified Procedure for Evaluating Soil Liquefaction Potential. Journal of the Soil Mechanics and Foundations Division, 97 (SM9), Proc. Paper 8371, September 1971, 1249–1273.
- Seed HB, De Alba, PM. 1986. Use of SPT and CPT tests for Evaluating the Liquefaction Resistance of Sands. Proc., INSITU’86, ASCE Special Conference on Use of In Situ testing in Geotechnical Engineering, Spec. Publ. No. 6, ASCE, New York.
- Seed HB, Idriss IM. 1982. Ground motion and soil liquefaction during earthquakes. Oakland, CA, USA: Earthquake Engineering Research Institute Monograph Series, p. 134.
- Seed RB, Cetin KO, Moss RES, Kammerer AM, Wu J, Pestana JM, Riemer MF, Sancio RB, Bray JD, Kayen RE, and Faris A. 2003. Recent Advances in Soil Liquefaction Engineering: A Unified and Consistent Framework. 26th Annual ASCE Los Angeles Geotechnical Spring Seminar, Keynote Presentation, H.M.S. Queen Mary, Long Beach, California, April 30, 2003.
- Seed HB, Tokimatsu K, Harder LF, Chung RM. 1985. Influence of SPT Procedures in soil liquefaction resistance evaluations. J Geotech Eng. 111(12):1425–1445.
- Senel M. 2002. Geological Map of Turkey, Ankara, MTA.
- Sengor AMC, Yilmaz Y. 1981. Tethyan evolution of Turkey. A plate tectonic approach. Tectonophysics. 75:181–241.
- Sieberg A. 1932. Erdbebengeographic. In: Gutenberg B., editors. Handbuch der Geophysic, Bands IV. Berlin: Borntrager; p. 527–1005.
- Tatar O, Piper JDA, Gursoy H, Heimann A, Kocbulut F. 2004. Neotectonic deformation in the transition zone between the Dead Sea Transform and the East Anatolian Fault Zone, Southern Turkey: a paleomagnetic study of the Karasu Rift volcanism. Tectonophysics. 385(1–4):17–43.
- Thevanayagam S. 1998. Effect of fines on confining stress on undrained shear strength of silty sands. J Geotech Geoenviron Eng. 124(6):479–491. ASCE
- Thevanayagam S, Martin GR. 2002. Liquefaction in silty soils- screening and remediation issues. Soil Dyn Earthquake Eng. 22(9–12):1035–1042.
- Toprak S, Holzer TL, Bennett MJ, Tinsley JC. 1999. CPT- and SPT-based Probabilistic Assessment of Liquefaction Potential. Proceedings of Seventh U.S.-Japan Workshop on Earthquake Resistant Design of Lifeline Facilities and Countermeasures Against Liquefaction, MCEER, Seattle, 69–86.
- Tosun H, Seyrek E, Orhan A, Savaş H, Türköz M. 2011. Soil liquefaction in Eskisehir, NW Turkey. Nat Hazards Earth Syst Sci. 11(4):1071–1082.
- Turkelli N, Sandvol E, Zor E, Gok R, Bekler T, Al-Lazki A, Karabulut H, Kuleli S, Eken T, Gurbuz C, et al. 2003. Seismogenic zones in eastern Turkey. Geophys Res Lett. 30(24):8039.
- Westaway R. 1994. Present-day kinematics of the Middle East and Eastern Mediterranean. J Geophys Res. 99(B6):12071–12090.
- Westaway R. 2003. Kinematics of the Middle East and Eastern Mediterranean updated. Turk J Earth Sci. 12:5–46.
- Willis B. 1928. Earthquakes in the Holy Land. Bull Seism Soc Am. 18:73–103.
- Yalcin A, Gokceoglu C, Sonmez H. 2008. Liquefaction severity map for Aksaray city center (Central Anatolia, Turkey). Nat Hazards Earth Syst Sci. 8(4):641–649.
- Yilmaz Y. 1993. New evidence and model on the evolution of the southeast Anatolian orogeny. Geol Soc Am Bull. 105(2):251–271.
- Yilmaz H, Over S, Ozden S. 2006. Kinematics of the East Anatolian Fault Zone between Turkoglu (Kahramanmaras) and Celikhan (Adiyaman), eastern Turkey. Earth Planet Space. 58(11):1463–1473.
- Youd TL, Idriss IM, Andrus RD, Arango I, Castro G, Christian JT, Dobry R, Finn WDL, Harder LF, Hynes ME, et al. 2001. Liquefaction resistance of soils, Summary report from the 1996 NCEER and 1998, NCEER/NSF workshop on evaluation of liquefaction resistance of soils. J Geotech Geoenviron Eng-ASCE. 127(10):817–833.
- Yuan H, Yang SH, Andrus RD, Juang H. 2003. Liquefaction induced ground failure: a study of the Chi-Chi earthquake cases. Eng Geol. 17(1–2):141–155.
- Yurtmen S, Guillou H, Westaway R, Rowbotham G, Tatar O. 2002. Rate of strike-slip motion on the Amanos Fault (Karasu Valley, southern Turkey) constrained by K-Ar dating and geochemical analysis of Quaternary basalts. Tectonophysics. 344(3–4):207–246.