
 ?Mathematical formulae have been encoded as MathML and are displayed in this HTML version using MathJax in order to improve their display. Uncheck the box to turn MathJax off. This feature requires Javascript. Click on a formula to zoom.
Abstract
Integrated with K-means clustering and Apriori algorithm, the multi-level association rule mining is proposed to investigate the causal factor patterns of flash floods, which consists of the following three steps: first, the association between causal factors and flash flood occurrence is being analysed; second, to identify the contribution of soil moisture (SM) to flash flood hazards, the association between risk indicators and SM, and the linkage between SM and risk magnitude are being discussed; finally, with the consideration of total 24-h rainfall and SM pattern, the association rules for risk magnitude are extracted. The method has been tested in a humid area of southern China, results show: (1) flash flood hazards are especially active after the prolonged and periodic intense rainfalls, and because of the saturated SM, flash floods are easily triggered even by slight rainfall; (2) severe flash floods are easily triggered by extreme rainfall, and SM is the critical indicator of 5-year floods and 20-year floods; and (3) owing to the differences in steady infiltration rate and instability in soil type, conservation of water and soil is an indispensable and co-ordinate part of flood control. Results are expected to be applicable for decision-making in flood control and flood prediction.
1. Introduction
With the rapid production of surface runoff, flash floods is considered one of the most dangerous natural hazards whose occurrence is associated with various causes, including hydrological factors, geological factors, topography characteristics and climatic influences (Gan et al. Citation2018). However, intense rainfall is often regarded as the cause of flash flood events over a small-scale watershed (Modrick and Georgakakos Citation2015; Youssef et al. Citation2016; Mahmood et al. Citation2017). Several studies have shown that early warning based on rainfall threshold is essential to predict the flash flood occurrence, and has been demonstrated as helpful guidance to reduce flood damages (Gourley et al. Citation2014; Li et al. Citation2018). Flash floods are also dependent on the degree of soil saturation, while changes in precipitation and evapotranspiration will modify the soil moisture (SM) content (Grillakis et al. Citation2016; Massari et al. Citation2018). Meanwhile, the spatial distribution of SM provides a crucial link with the hydrological and ecological processes (Manfreda Citation2008; Santi et al. Citation2013; Renzullo et al. Citation2014). Manfreda and Fiorentino (Citation2008) developed a model to defined the relative saturation, in which the rainfall force was interpreted as an additive noise in the soil water balance, and concluded that the flood probability is mathematically derived as a function of daily rainfall and antecedent SM, some regional applications was successfully conducted based on the proposed model (Gioia et al. Citation2014). Based on the hydrological model, the initial SM conditions can explain the differences in various risk magnitudes of flash floods (Meng et al. Citation2017; Zhai et al. Citation2018). Thus, identifying the causal factors of flash flood events is of primary importance to explain causal mechanisms of flash floods and enhance its forecasting (Saharia et al. Citation2017).
With the widely application of data-driven methods, it opens another opportunity to revisit hydrological challenges based on a massive amount of data, especially for the complex and nonlinear relationships (Shen et al. 2018). For instance, satellite SM observations have provided global or regional scale information, such as Soil Moisture Active Passive (Entekhabi et al. Citation2010), Global Land Data Assimilation System (Rodell et al. Citation2004), and the North American Land Data Assimilation System (Mitchell et al. Citation2004). They have shown promising performance with moderate correlation between satellite SM observation and ground data (Abhishek et al. Citation2012; Matgen et al. Citation2012; Alvarez-Garreton et al. Citation2015) and are useful in the analysis of relationship between hydrological and environmental causes and flash flood events. Transforming vast data into useful information and knowledge intelligently is critical to the causal analysis of flash floods.
Association rule mining (ARM) is one of the most instrumental technologies in data mining, which aims to extract correlations, frequent patterns, or associations among item sets in database (Pears et al. Citation2013; Son et al. Citation2018). Considering hazard risk as a complex system, the transfer mechanism between causal factors and risk magnitudes can be highlighted by ‘support’ and ‘confidence’, which are two parameters in the procedure of association rules. Through data mining, the cause-and-effect relationships between hydrological parameters and landslide movement are determined (Ma et al. Citation2017). Studies have shown that ARM has successfully determined the level of association in various fields, and can provide evidence for probable cause-and-effect relations (Qodmanan et al. Citation2011; Nahar et al. Citation2013; Guo et al. Citation2014; Peng et al. Citation2018).
In this paper, by using multi-level data mining methods, we attempt to analyse the cause and effect of flash floods. Three important novelties are being discussed in this paper: (1) the major causal patterns of flash flood events that indicate the relationship between risk factors and SM; (2) the association between SM and magnitude of flash floods; and (3) the causal mechanisms of flash flood hazards in study area.
2. Materials
2.1. Study area
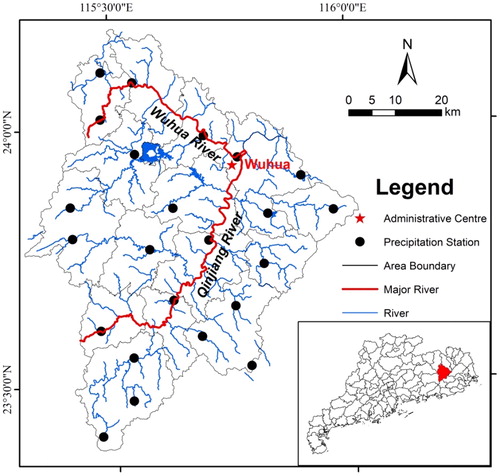
We have performed a case study in a humid area, in Upper Hanjiang River of Southern China, Guangdong Province, covering an area of 3239 km2, with 105 rivers going through this Delta. The two main watersheds are Wuhua River and Qinjiang River (). According to 23 observational stations in the study area, the average rainfall is 1542 mm annually, and the summer months (from May to August) are the wettest, accounting for approximately 79.9% of annual rainfall. Upper Hanjiang River is prone to flash flood hazards. For instance, due to Typhoon Utor (2013), the average rainfall record was 229.6 mm during the period of August 14–18, and the peak stage was recorded as 19.78 mm by Jianshan Rainfall Station at 4 PM on August 17. This rainfall event caused an extreme flash flood hazard, which had affected 3.68 × 10⁵ population and destroyed 28 bridges, directly resulting in an economic loss of US $87.7 million (Meng and Wang 2013). Consequently, a severe challenge is being faced in flash flood risk management of Upper Hanjiang River.
Figure 1. Map of study area.
2.2. Data collection
Causal factors of flash flood hazards are various because of the specific hydrological and environmental characteristics of each location. After carefully reviewing the literatures and field survey in the study area (Zhang et al. Citation2010; Zheng et al. Citation2016), total 24-h rainfall (TR), elevation (DE), slope degree (SD), vegetation cover (VC), soil type (ST), drainage density (DD), and SM are selected as risk factors of flash flood hazards in Upper Hanjiang River. In this research, 31 flash flood events in the study area over the period of 2011, 2012, and 2013 have been considered.
TR (mm) is calculated based on hourly rainfall data in 1 day prior to the flash flood occurring day at 23 observational stations of Upper Hanjiang River, which were obtained from the Hydrology Bureau of Guangdong Province (http://www.gd3f.gov.cn/).
DE (m) reflects the vertical distance between the terrain surface and the sea level; areas in low DE are prone to flooding because the runoff from rainfall has the natural trend of flowing from highlands to lowlands. The data are obtained from SRTDEM 90M, which were acquired from the United States Geological Survey (USGS; http://ned.usgs.gov/)
SD (°) reflects the changes in altitudes along a distance unit. Mountain areas have steep slopes that prevent water being collected when it rains, while flatlands have a gentle SD that can easily become a flooding threat. The data were extracted or calculated from digital elevation model (DEM) by using geographic information system (GIS) techniques.
VC (%) reflects the underlying surface. Rainstorm volume is intercepted by plant canopy, while additional VC leads to more rainstorm interception. Moreover, vegetation provides prevention when runoff occurs. The data of vegetation in this study are obtained from the USGS (http://ned.usgs.gov/) in 2013.
ST influences the infiltration capability (Costache and Zaharia Citation2017; Costache Citation2019), and a large grain size means a strong infiltration capability. The data of soil information in this study are obtained from the Hydrology Bureau of Guangdong Province (http://www.gd3f.gov.cn/).
DD (m/km2) reflects the amount of catchment in the study area, and a high DD relates to a high risk of flash floods (Zaharia et al. Citation2017). Based on DEM, Spatial distribution of DD is generated by using the tool of ‘LineDensity’ of GIS.
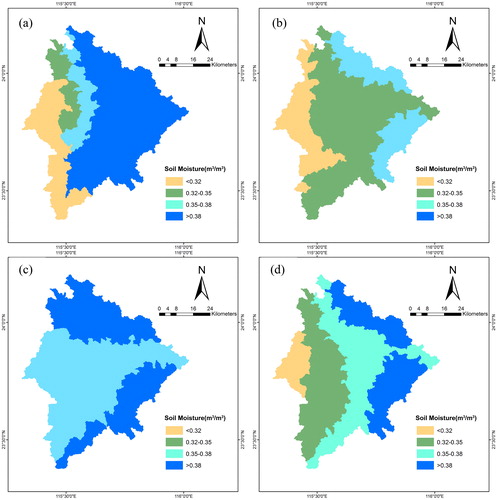
SM (m3/m3) controls the partitioning of rainfall into runoff and infiltration and therefore has an important effect on the runoff behavior of catchment (Scipal et al. Citation2005). Therefore, it is very important to obtain SM status to determine the magnitude of flash flood events, which is particularly useful for mechanism analysis of flash flood hazards (Koster et al. Citation2010). Satellite passive microwave radiometers are sensitive to SM, enabling global estimation with daily fidelity and approximately 9–25 km spatial resolution. Though bias still exists between satellite SM observations and ground data, satellite SM observations present well in the change trend of SM (Owe et al. 2008; Jackson et al. 2010; Mai et al. 2016). The data of SM in this study are obtained from The European Space Agency (ESA). The ESA Climate Change Initiative (CCI) SM data product consists of three surface SM data sets: The ‘ACTIVE Product’ and the ‘PASSIVE Product’ were created by using scatterometer and radiometer SM products, respectively; The ‘COMBINED Product’ is a blended product based on both scatterometer and radiometer products (Liu et al. Citation2011, Citation2012; Wagner et al. Citation2012). The data set spans over 39 years covering the period from November 1978 to June 2018 (http://www.esa-cci.org/). The annual average SM of ESA CCI SM product in China in the period of 2013 is shown in , in which the SM of Southern China is in the interval of 0.2–0.6 m3/m3. The spatial distributions of SM in typical flash flood events in the study area are shown in , respectively.
Figure 2. Spatial distributions of ESA CCI soil moisture product in China in 2013.
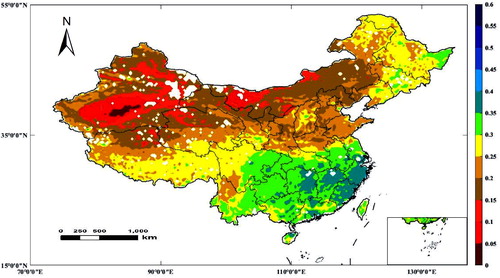
Figure 3. Spatial distributions of soil moisture in flash flood events on (a) 16 August 2007; (b) 20 April 2008; (c) 9 November 2011; and (d) 23 September 2013.
3. Methodology
3.1. Apriori algorithm
ARM is an important data mining method (Agrawal et al. Citation1993). It determines the relationship between items or features that occur in the databases. ARM is represented by ‘A = > B’; let I be the set of all items and D a set of transactions in the database, where A ∈ I, B ∈ I, and A ∩ B = Φ. It means that the transaction set D is a non-empty sub-item of I, which implicates ‘A is contained in D’ and has the trend of ‘B is contained in D’. A is the premise of association rule, and B is its consequence. Whether the rule ‘A = >B’ is held in D depends on the following three measure standards: support, confidence, and lift.
Support is the rate of A contained in B and is taken to be the probability P (A∪B), which is defined as follows:
(1)
(1)
Confidence is the rate of A and B contained in D and is taken to be the conditional probability P (B|A), which is defined as follows:
(2)
(2)
Given a set of transactions D, the ARM is to generate all transaction rules that have a certain user-specified minimum support (minSup) and minimum confidence (minConf).
Lift larger than 1 indicates that A has a positive effect on the occurrence of B. It is defined as follows:
(3)
(3)
Having the advantage of reducing the search space, the Apriori algorithm is most popular for ARM (Agrawal and Srikant Citation1994), which uses an iterative approach known as a level-wise search, where K item sets are used to explore (K + 1) item sets. The Apriori algorithm involves the following two steps:
Step 1. Detect large item sets whose support is larger than minSup.
Step 2. By using large item sets achieved in step 1, generate strong association rules whose confidence is larger than minConf. The rules generated by the Apriori algorithm must satisfy the following criteria:
Strong association rules will be marked in the database for the decision makers, while the redundancy data will be deleted.
3.2. K-means clustering
Clustering analysis is a process by which large datasets can be separated into several groups, and the datasets in the same group are more similar to each other than those in other groups (Wu et al. Citation2016; Marco et al. Citation2017). The continuous indicators must be discretized before the application of the association rule algorithms. Thus, we provide K-means clustering analysis for addressing the requirement. The K-means algorithm aims at grouping observations according to distance measure in the K-dimensional space of x. It proceeds as follows:
Step 1. Support observations must be grouped into k clusters, and we select the initial centroids for each cluster (g = 1, 2, …, k).
Step 2. Calculate the distance d(, xi) between the current data vector xi and the initial centroids
as follows:
(4)
(4)
For quantitative variables, such as TR, DE, and SD, the Euclidean distance is used as Eq. (1); for categorical variables, such as ST, we maintained the original clusters. The K-means clustering is used to determine a set of K centroids so as to minimize the distances d(
, xi).
Step 3. If xi is already a member of the group whose mean is closest, then repeat step 2 for xi+1; otherwise, reassign xi to the group whose mean is closest and return to step 1.
Step 4. The processes are iterated until the centroids are confirmed; that is, a full cycle through all observations produces no reassignments.
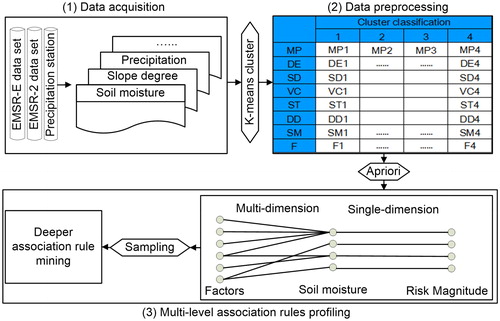
The ARM procedure proposed in this study comprises three stages: K-means clustering classification, multi-level ARM, and deeper association rules discovery. The framework is shown in .
Figure 4. Framework based on K-means clustering and Apriori algorithm.
4. Causal factor identification
4.1. Historical flash flood inventory
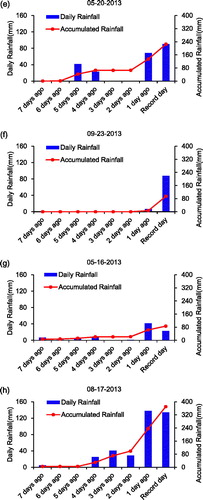
Based on the flash flood inventory covering the period from 2008 to 2013 in the study area, 31 flash flood records are summarized in , which shows the processes of antecedent rainfall in the flash flood events. Recurrence values are used to indicate the magnitude of flash flood: F1 stands for the recurrence interval less than 5 years, F2 for that between 5 and 20 years, F3 for that between 20 and 50 years, and F4 for that between 50 and 100 years. Both daily rainfall and 7-day antecedent rainfall have been analysed to display the role of daily rainfall as well as the accumulated rainfall in flash flood hazards (). It can been seen that rainstorm on the record day of flash flood event might induce the 5-year flash floods ((a)), and the obvious antecedent rainfall might induce 5-year flash floods, as shown in and (c). Antecedent rainfalls of 20-year flash floods are shown in and (e); that of 50-year flash floods is shown in (f); and the flash flood events with return period more than 50 year are shown in and (h). The findings suggest that intensity rainfall event is one of the triggered factors of flash flood hazards in Upper Hanjiang River. Flash floods might occur by moderate rainfall event following several days, or trigger by the accumulated rainfall which is more than 100 mm. It is also evidenced that SM is another crucial factor in flash flood hazards, which influences runoff. After continuous rainfalls, soil water content becomes saturated, and the overflow will increase when there are further rainfalls. In the final period, flash floods would be easily triggered even by slight rainfalls.
Table 1. Summary of antecedent rainfall in historical flash flooding records.
Figure 5. Antecedent rainfall in historical flash flood hazard with different recurring frequency values (a) 11 July 2011; (b) 8 May 2011; (c) 6 April 2013; (d) 13 May 2011; (e) 20 May 2013; (f) 23 September 2013; (g) 16 May 2013; and (h) 17 August 2013.

4.2. Qualitative statement by K-means clustering
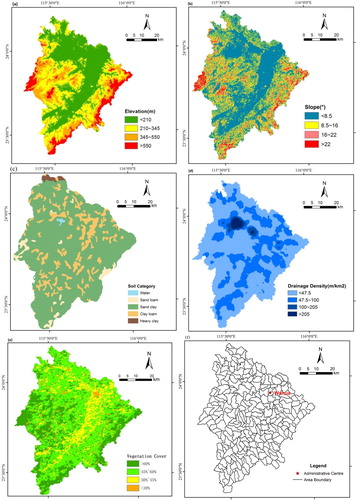
In the discrete indicators, such as ST, we defined four classified groups as sand clay, clay loam, sandy loam, and heavy clay. The continuous indicators, such as TR, DE, SD, VC, DD, and SM, were clustered into four groups by using k-means clustering method. More similarities were displayed in the same group, while more differences were performed individually to each indicator between groups. In this study, risk magnitude was indicated by probability of occurrence as a continuous attribute as well. Because of the low probability of large magnitude flash floods in our study area, k-means clustering analysis would be likely to result in neglecting minor probability events. In order to address this issue, we took flooding return period as the classified standard of risk magnitude. The qualitative value of datasets was classified and results are shown in . Spatial distributions of classified DE, SD, VC, and DD are shown in . By using standard GIS tools, topographic information was processed to delineate and subdivide the watershed into 258 sub-catchments, in which the largest covers an area of 36.05 km2, while the smallest 0.03 km2. The zoning map of watershed in the study area is shown in (f). In order to present the spatial distributions of SM in flash flood hazards, four historical events with different return periods are selected (shown in ): flash flood event on 25 July 2012 with 5-year return period, flash flood event on 22 May 2013 with 20-year return period, flash flood event on 23 September 2013 with 50-year return period, and flash flood event on 17 August 2013 with more than 50-year return period.
Table 2. Causal factors datasets classified by K-means clustering and recurrence values.
Figure 6. Spatial distributions of risk indicators (a) ground elevation; (b) surface slope; (c) soil category; (d) drainage density; (e) vegetation cover in 2013; and (f) zoning map of watershed grid.
4.3. Association rules profiling by Apriori algorithm
ARM was performed on the 258 small-scale watersheds, removing the null value of daily rainfall data at observation stations of Upper Hanjiang River. Based on 31 flash flood records, 4028 datasets have been generated. Using the ARM model proposed in , the rule extractions for SM and risk magnitude of flash floods have been processed by multi-level ARM. To detect the severe flash flood events that were the minor samples in the flash flood database in Upper Hanjiang River, deeper association rules have been generated, and the results are shown below.
As listed in , ‘lhs’ means the left-hand side, and ‘rhs’ the right-hand side, which, respectively, represents the causes and consequences of association rules. Setting minSup = 0.2 and minConf = 0.8, 19 rules have been generated to display the association between risk indicator and risk magnitude of flash flood hazards. In the transaction set, ‘Rule 1: {TR = TR1} = > {F = F1}’ holds with the support of 0.41, which is the largest support in the listed rules, with the confidence of 0.89, a lift of 1.12, which is more than 1, and a count of 1803. The support of 0.41 means that the proportion of the transactions contains ‘TR1’ and ‘F1’ is 0.41, and the confidence of 0.8 means that 80% of the transactions that contain ‘TR1’ also contain ‘F1’. In other words, a strong associability is evident between TR1 and F1. Some multiple rules have been mined as well, such as ‘Rule 4: {TR = TR1, ST = ST1} = > {F = F1}’ with the support of 0.32 and the confidence of 0.89, and ‘Rule 11: {TR = TR1, DE = DE1} = > {F = F1}’ with the support of 0.24 and the confidence of 0.89. If a TR of less than 26 mm exists, the 5-year floods are more likely to occur. With the high rate of 5-year floods in the Upper Hanjiang River flash flood inventory, all association rules have been found to include ‘{F = F1}’ in consequence.
Table 3. Rule extraction for risk magnitude with consideration of causal factors (minSup = 0.20, minConf = 0.8).
Deeper rule extraction samplings with F2, F3, F4 have been conducted to detect the severe flash flood events in the database. Thus, a new database of 903 datasets is constructed. Setting minSup = 0.25 and minConf = 0.9, 9 additional association rules are obtained. Rules from ID 20 to ID 28 show that the severe flash flood events and a high risk of magnitude may be measured, in terms of the increasing of 24-h rainfall, such as ‘Rule 24: {TR = TR2, ST = ST1} = > {F = F2}’, ‘Rule 25: {TR = TR4} = > {F = F4}’ and ‘Rule 28: {TR = TR4, SM = SM2} = > {F = F4}’. It can be concluded that the TR is one of the critical attributes in Upper Hanjiang River flash floods; considerable TR would probably result in large flood magnitude.
Furthermore, multiple environmental factors mining are also shown in , which display the combination effect in flash flood hazards. For multiple dimensions mining, some rules with special combination in ‘lhs’ are generated, such as ‘Rule 5: {DE = DE1, ST = ST1} = > {F = F1}’ with the support of 0.32 and the confidence of 0.79, ‘Rule 6: {ST = ST1, DD = DD3} = > {F = F1}’ with the support of 0.27 and the confidence of 0.83, ‘Rule 22: {DE = DE1, ST = ST1} = > {F = F2}’ with the support of 0.46 and the confidence of 0.91.
Moreover, SM of more than 0.2 cm3/cm3 and SD in the range of 22° to 35° are the crucial attributes of flash floods in Upper Hanjiang River, which indicates that flash flood hazards are more likely to occur in the scenario of steep slope. Then, we focus on the rules in which ‘rhs’ is identified as {F = F4}’, such as ‘Rule 25: {TR = TR4} = > {F = F4}’ with the support of 0.32 and the confidence of 0.83, ‘Rule 27: {VC = VC1} = > {F = F4}’ with the support of 0.30 and the confidence of 0.75, and ‘Rule 28: {ST = ST1, SM = SM3} = > {F = F4}’ with the support of 0.28 and the confidence of 0.95. Evidently, the combined factors with TR and SM in the high levels, sandy clay area, and vegetable cover less than 30%, are associated with 100-year flash floods.
Based on the results described in and , SM is one of the crucial factors in flash flood hazards, especially in case of light rain. Multilevel ARM has been conducted to discuss the effect of SM on flash floods. The association rules between risk indicators and SM have been listed in . Setting minSup = 0.12 and minConf = 0.4, 20 rules have been generated with all ‘rhs’ consequences of {SM = SM2} and {SM = SM3}, which indicates a high rate of SM2 and SM3 in flash flood events database of the humid area. As shown in the soil category in (c), the proportion of sand clay is 80%, accounting for the most ST in the study area. Rules 1, 5, 6, show the strong associations between ST1 and SM2, and the combination effects with ST and other risk indicators. We have constructed a new database by sampling SM1 and SM4 to mine the rare rules apart from SM2 and SM3. Setting minSup = 0.15 and minConf = 0.5, rules with ID from 21 to 36 have been obtained. ‘Rule 21: {VC = VC1} = > {SM = SM1}’ with the support of 0.24 and the confidence of 0.72, indicates that the proportion of the transactions containing ‘ST1’ and ‘SM1’ is 24%, and transaction containing both ‘VC1’ and ‘SM1’ accounts for 72% of the transactions containing ‘VC1’. ‘Rule 28: {DD = DD2} = > {SM = SM4}’ with the support of 0.18 and the confidence of 0.53, and ‘Rule 33: {DD = DD3} = > {SM = SM4}’ with the support of 0.17 and the confidence of 0.59, indicates the proportion of the transactions containing ‘DD’ and ‘SM4’, and transaction containing both ‘DD’ and ‘SM4’ accounts for the high rate of the transactions containing ‘DD’. One of the most important conclusions in is that, different from the results in , a rare association exists between TR and ‘SM4’, because SM is dependent on prolonged rainfall, which agrees well with .
Table 4. Rule extraction for soil moisture with consideration of causal factors (minSup = 0.12, minConf = 0.4).
Aiming to find the relationship between SM and flood magnitude, minSup = 0.2 and minConf = 0.8 have been set in the entire database, and minSup = 0.1 and minConf = 0.3 in the sampled database with F2, F3, and F4. clearly shows the association rules between SM and flood magnitude. It can be concluded that if SM is in the range of SM1 and SM2, then the flash flood return period would be less than 20 years, as shown in Rules 1, 2, and 4. When SM is in the range of SM3, the severe flash floods with 100-year return period would likely occur, as shown in Rule 5.
Table 5. Rule extraction for risk magnitude with consideration of soil moisture (minSup = 0.2, minConf = 0.8).
From , it can be noted that TR, ST, and SM are the critical risk indicators of flash flood hazards in Upper Hanjiang River. Considering the high rate of sandy clay in the study area, we have built a database containing TR, SM, and flood magnitude. Rule extractions are indicated in . Setting minSup = 0.1 and minConf = 0.9, ‘Rule 1: {TR = TR1, SM = SM1} = > {F = F1}’ and ‘Rule 2: {TR = TR1, SM = SM3} = > {F = F1}’ have been generated, which indicate that the trigger condition of 5-year flash floods in Upper Hanjiang River was due to the TR. Setting minSup = 0.09 and minConf = 0.7, rules with ID from 3 to 6 have been extracted, and every rule indicates one risk scenario in flash floods. For example, ‘Rule 4: {TR = TR4, SM = SM3} = > {F = F4}’ with the support of 0.10 and the confidence of 0.97 indicates that 100-year flash floods were likely to occur due to the extreme rainfall. ‘Rule 6: {TR = TR1, SM = SM4} = > {F = F2}’ with the support of 0.09 and the confidence of 1 indicates that even a light rainfall would induce 20-year flash floods in the saturated SM area. Rule 5 and 6 has a confidence of 1; in other words, all of the transactions containing {TR = TR4, SM = SM2} and the transactions containing {TR = TR1, SM = SM4}also contain {F = F2} in ‘rhs’ all accordingly.
Table 6. Rule extraction for risk magnitude with consideration of total 24-h rainfall and soil moisture pattern (minSup = 0.1, minConf = 0.9).
4.4. Discussion of flash flood mechanism
TR is one of the critical attributes in Upper Hanjiang River flash floods; more TRs would probably result in large flood magnitude. 100-year flash floods are more likely attributed to the extreme rainfall. During rainy seasons, with prolonged and periodic intense rainfalls, slopes become more instable and cause a rapid increase of water levels in small watershed. In addition, rainfall, as one of the most common and important causes of flash floods, may also reduce the mechanical strength of slip surface in most areas. Meanwhile, provided by other hydrological and environmental factors, the support plays a combined crucial role in our study area, which has increased the risk of flash floods.
It is possible that strong rainfall events happen in the mountains and flash floods in the downstream; thus, SM is considered as another important factor that affects the occurrence of flash flood hazards. If SM is in high level, the relative soil saturation will be observed, and the flash flood return period would be less than 20 years; severe flash floods with 100-year return period are more likely to occur by sudden rainstorms, even if SM is in the range of SM3. Steady infiltration rate influences SM and the occurrence of overland flow. In the study area, four STs have different steady infiltration rates, the greatest of which was sandy loam, followed by sandy clay, clay loam, and heavy clay. Consequently, improving the steady infiltration rate in the study area is an effective way of avoiding severe flash floods in Upper Hanjiang River. Moreover, ‘Rule 5: {TR = TR1, SM = SM4} = > {F = F2}’ and ‘Rule 6: {TR = TR1, SM = SM4} = > {F = F2}’ in with the confidence of 1 indicates two causal factor patterns of 20-year return period, one is evidenced that the extreme rainfall would induce the flash flood hazards, another show that even a light rainfall would induce flash floods in the saturated SM area.
A rare association exists between TR and SM, because SM data used in this study are one day before flash flood events. Meanwhile strong associations have been observed between ST and SM. SM is dependent on prolonged rainfall and ST. Sand clay is the carbonate weathered soil in tropical and subtropical areas, and soil parent rocks have considerable influence on the formation of sand clay. Sand clay is easily corroded and weathered. Owing to a high rate of sand clay, especially in the mountainous regions on the east, west and south ((c)), the massive surface becomes loose solid matter cover and accumulates on the ground, which might lead to flash floods after raining. In addition, flash flood hazards are more likely to occur in the scenario with steep slopes. The 100-year flash floods is not induced by the single factor, it is associated with the combined factors, such as extreme rainfall, SM in the high levels, sandy clay area, and vegetable cover less than 30%.
ARM method provides a simplified description of the Relationship between Causal Factor Patterns and Flash Flood Magnitudes, especially between rainfall, SM and runoff generation in humid area. The case study in this paper demonstrates that not only the sudden rainfall, but also the relative saturated area are responsible of the flash flood events. The results are consistent with the probability distribution of runoff detecting by Manfreda andFiorentino (2008), in which runoff is described as a function of rainfall depth and the state of the basin. ARM is capable of coping with the multiple datasets, and mining the association rules with single factor and combined causal factors, which provides a feasible and effective method for flash floods mechanisms analysis.
5. Conclusions
This research has presented multi-level ARM to explore the cause-and-effect relationship between SM, hydrological and environmental indicators, and flood magnitude. Using a case study in Upper Hanjiang River based on a flash flood database covering the period from 2008 to 2013, four types of rule extractions have been detected in humid area, including association rules for risk indicators and flood magnitude, association rules for risk indicators and SM, association rules for SM and flood magnitude, and association rules for TR, SM and risk magnitude. Deeper ARM has been carried out in the sampled database to extract rules from small samples. Several distinct characteristics and notable patterns of flash floods in Upper Hanjiang River are described in this study. ARM exhibits a good performance in detecting knowledge of flash flood hazards by setting minSup and minConf, especially in the large database.
It has been found that the flash flood hazards in Upper Hanjiang River are especially active after the prolonged and periodic intense rainfalls, and flash floods are easily triggered by even a slight rainfall due to the relatively saturated soil. This finding also highlights that severe floods in Upper Hanjiang River are easily triggered by extreme rainfalls, while SM is the critical indicator of 5-year and 20-year floods. Owing to the difference of steady infiltration rate, ST is one of the important parameters in flash flood scenarios in Upper Hanjiang River. Therefore, soil conservation is an indispensable and co-ordinate part of flood control.
This research has demonstrated the method of integrating K-means clustering and Apriori algorithm in mechanism discussion of flash floods, and especially the potential mechanism of SM impact on small-scale flash flood events has been explored. The results exemplify the influence of TR and SM, and display the linkage between causal factor patterns and flash flood magnitudes. An advantage of this approach is that the association rules extracted by ARM present the pattern combinations not only to flood occurrence but also to flood magnitudes; additionally, the runoff mechanism in different climatic conditions has been discussed. However, this study is based on 31 flash flood events in Upper Hanjiang River, the database should be updated when more flood events recorded in high spatio-temporal resolution are available, and more potential influencing factors, such as TR, could be taken into account in further studies. The data mining technology approach on flash flood mechanisms have been conducted in humid area, and expect to expand to the study area with different climatic conditions or with various underlying surface in future work. This study is expected to provide scientific support for the rapid and reasonable diagnosis of flash flood mechanism, and further provide a basis for decision-making for the risk management of flash flood hazards.
Acknowledgements
The authors also would like to thank Ian Cox for helping to improve English.
Disclosure statement
No potential conflict of interest was reported by the authors.
Additional information
Funding
Related Research Data
References
- Abhishek C, Seshasai MVR, Murthy CS, Rao S. 2012. Assessing early season drought condition using AMSR-E soil moisture product. Geomat Nat Hazards Risk. 4(2):164–184.
- Agrawal R, Imielinski T, Swami AN. 1993. Mining association rules between sets of items in large database. Proceedings of the 1993 ACM SIGMOD International Conference on Management of Data. p. 207–216.
- Agrawal R, Srikant R. 1994. Fast algorithms for mining association rules. Proceeding of 20th VLDB Conference; Santiago, Chile. p. 1–13.
- Alvarez-Garreton C, Ryu D, Western AW, Su CH, Crow WT, Robertson DE, Leahy C. 2015. Improving operational flood ensemble prediction by the assimilation of satellite soil moisture: comparison between lumped and semi-distributed schemes. Hydrol Earth Syst Sci. 19(4):1659–1676.
- Costache R. 2019. Flash-Flood Potential assessment in the upper and middle sector of Prahova river catchment (Romania). A comparative approach between four hybrid models. Sci Total Environ. 659:1115–1134.
- Costache R, Zaharia L. 2017. Flash-flood potential assessment and mapping by integrating the weights-of-evidence and frequency ratio statistical methods in GIS environment–case study: Bâsca Chiojdului River catchment (Romania). J Earth Syst Sci. 126(4):59.
- Entekhabi D, Njoku EG, O'Neill PE, Kellogg KH, Crow WT, Edelstein WN, Entin JK, Goodman SD, Jackson TJ, Johnson J, et al. 2010. The soil moisture active passive (SMAP) mission. Proc IEEE. 98(5):704–716.,
- Gan BR, Liu XN, Yang XG, Wang XK, Zhou JW. 2018. The impact of human activities on the occurrence of mountain flood hazards: lessons from the 17 August 2015 flash flood/debris flow event in Xuyong County, south-western China. Geomat Nat Haz Risk. 9(1):816–840.
- Gourley JJ, Flamig ZL, Hong Y, Howard KW. 2014. Evaluation of past, present and future tools for radar based flash-flood prediction in the USA. Hrdrol Sci J. 59(7):1377–1389.
- Gioia A, Manfreda S, Iacobellis V, Fiorentino M. 2014. Performance of a theoretical model for the description of water balance and runoff dynamics in southern Italy. J Hydrol Eng. 19(6):1113–1123.
- Guo Z, Chi D, Wu J, Zhang WY. 2014. A new wind speed forecasting strategy based on the chaotic time series modeling technique and the Apriori algorithm. Energy Conv Manag. 84:140–151.
- Grillakis MG, Koutroulis AG, Komma J, Tsanis IK, Wagner W, Bloschl G. 2016. Initial soil moisture effects on flash flood generation – a comparison between basins of contrasting hydro-climatic conditions. J Hydrol. 541:206–217.
- Koster RD, Mahanama SPP, Livneh B, Lettenmaier DP, Reichle RH. 2010. Skill in streamflow forecasts derived from large-scale estimates of soil moisture and snow. Nat Geosci. 3(9):613–616.
- Li HC, Lei XH, Shang YZ, Qin T. 2018. Flash flood early warning research in China. Int J Water Resour Dev. 34(3):369–385.
- Liu YY, Dorigo WA, Parinussa RM, de Jeu RAM, Wagner W, McCabe MF, Evans JP, van Dijk AIJM. 2012. Trend-preserving blending of passive and active microwave soil moisture retrievals. Remote Sens Environ. 123:280–297.
- Liu YY, Parinussa RM, Dorigo WA, De Jeu RAM, Wagner W, van Dijk AIJM, McCabe MF, Evans JP. 2011. Developing an improved soil moisture dataset by blending passive and active microwave satellite-based retrievals. Hydrol Earth Syst Sci. 15(2):425–436.
- Mahmood MI, Elagib NA, Horn F, Saad S. 2017. Lessons learned from Khartoum flash flood impacts: an integrated assessment. Sci Total Environ. 601-602:1031–1045.
- Manfreda S, Fiorentino M. 2008. A stochastic approach for the description of the water balance dynamics in a river basin. Hydrol Earth Syst Sci Discuss. 5(2):723–748.
- Manfreda S. 2008. Runoff generation dynamics within a humid river basin. Nat Hazards Earth Syst Sci. 8(6):1349–1357.
- Massari C, Camici S, Ciabatta L, Brocca L. 2018. Exploiting satellite-based surface soil moisture for flood forecasting in the Mediterranean Area: state update versus rainfall correction. Remote Sens. 10(2):292.
- Meng SS, Xie XH, Liang SL. 2017. Assimilation of soil moisture and streamflow observations to improve flood forecasting with considering runoff routing lags. J. Hydrol. 550:568–579.
- Modrick TM, Georgakakos KP. 2015. The character and causes of flash flood occurrence changes in mountainous small basins of southern California under projected climatic change. J. Hydrol. 3:312–336.
- Mitchell KE, Lohmann D, Houser PR, Wood EF, Schaake JC, Robock A, Cosgrove BA, Sheffield J, Duan Q, Luo L, et al. 2004. The multi-institution North American Land Data Assimilation System (NLDAS): utilizing multiple GCIP products and partners in a continental distributed hydrological modeling system. J Geophys Res. 109:D07S90.
- Matgen P, Fenicia F, Heitz S, Plaza D, de Keyser R, Pauwels VR, Wagner W, Savenije H. 2012. Can ASCAT-derived soil wetness indices reduce predictive uncertainty in well-gauged areas? A comparison with in situ observed soil moisture in an assimilation application. Adv. Water Resour. 44:49–65.
- Ma J, Tang H, Hu X, Bobet A, Zhang M, Zhu T, Song Y, Eldin M. 2017. Identification of causal factors for the Majiagou landslide using modern data mining methods. Landslides. 14(1):311–322.
- Meng WG, Wang YQ. 2016. A diagnostic study on heavy rainfall induced by Typhoon Utor (2013) in South China: rainfall asymmetry at landfall. J Geophys Res Atmos. 121:12781–12802.
- Marco C, Aritz P, Jose AL. 2017. An efficient approximation to the K-means clustering for massive data. Knowledge-Based Syst. 117:56–69.
- Nahar J, Imam T, Tickle KS, Chen YP. 2013. Association rule mining to detect factors which contribute to heart disease in male and females. Expert Syst Appl. 40(4):1086–1093.
- Njoku EG. 2004. AMSR-E/Aqua Daily L3 surface soil moisture, interpretive parameters, & QC EASE-grids, version 2. Boulder. Colorado: NASA National Snow and Ice Data Center Distributed Active Archive Center.
- Pears R, Koh YS, Dobbie G, Yeap W. 2013. Weighted association rule mining via a graph based connectivity model. Inf Sci. 218:61–84.
- Peng M, Sundararajan V, Williamson T, Minty EP, Smith TC, Doktorchik CTA, Quan H. 2018. Exploration of association rule mining for coding consistency and completeness assessment in inpatient administrative health data. J Biomed Inform. 79:41–47.
- Qodmanan HR, Nasiri M, Minaei-Bidgoli B. 2011. Multi objective association rule mining with genetic algorithm without specifying minimum support and minimum confidence. Expert Syst Appl. 38(1):288–298.
- Renzullo LJ, Van Dijk AI, Perraud JM, Collins D, Henderson B, Jin H, Smith AB, Mcjannet DL. 2014. Continental satellite soil moisture data assimilation improves root-zone moisture analysis for water resources assessment. J Hydrol. 519:2747–2762.
- Rodell M, Houser PR, Jambor U, Gottschalck J, Mitchell K, Meng CJ, Arsenault K, Cosgrove B, Radakovich J, Bosilovich M, et al. 2004. The global land data assimilation system. Bull Am Meteor Soc. 85(3):381–394.
- Saharia M, Kirstetter P, Vergara H, Gourley JJ, Hong Y, Giroud M. 2017. Mapping flash flood severity in the United States. J Hydrometeor. 18(2):397–411.
- Santi E, Paloscia S, Pettinato S, Notarnicola C, Pasolli L, Pistocchi A. 2013. Comparison between SAR soil moisture estimates and hydrological model simulations over the Scrivia Test Site. Remote Sens. 5(10):4961–4976.
- Scipal K, Scheffler C, Wagner W. 2005. Soil moisture-runoff relation at the catchment scale as observed with coarse resolution microwave remote sensing. Hydrol Earth Syst Sci. 9(3):173–183.
- Shen CP. 2018. A transdisciplinary review of deep learning research and its relevance for water resources scientists. Water Resour Res. 54(11):8558–8593.
- Son LH, Chiclana F, Kumar R, Mittal M, Khar M, Chatterjee JM, Baik SW. 2018. ARM-AMO: An efficient association rule mining algorithm based on animal migration optimization. Knowledge-Based Syst. 154:68–80.
- Sina K, Naiier A, Samaneh S. 2017. An improved overlapping k-means clustering method for medical applications. Expert Syst Appl. 67:12–18.
- Wagner W, Dorigo W, de Jeu R, Fernandez D, Benveniste J, Haas E, Ertl M. 2012. Fusion of active and passive microwave observations to create an essential climate variable data record on soil moisture. ISPRS Annals of the Photogrammetry, Remote Sensing and Spatial Information Sciences (ISPRS Annals), Volume I–7, XXII ISPRS Congress; August 25–September 1; Melbourne, Australia. p. 315–321.
- Wu GL, Yang Z, Cui Z, Liu Y, Fang NF, Shi ZH. 2016. Mixed artificial grasslands with more roots improved mine soil infiltration capacity. J Hydrol. 535:54–60.
- Youssef AM, Sefry SA, Pradhan B, Alfadail EA. 2016. Analysis on causes of flash flood in Jeddah city (Kingdom of Saudi Arabia) of 2009 and 2011 using multi-sensor remote sensing data and GIS. Geomat Nat Haz Risk. 7(3):1018–1042.
- Zaharia L, Costache R, Prăvălie R, Ioana-Toroimac G. 2017. Mapping flood and flooding potential indices: a methodological approach to identifying areas susceptible to flood and flooding risk. Case study: the Prahova catchment (Romania). Front Earth Sci. 11(2):229–247.
- Zhai X, Guo L, Liu R, Zhang Y. 2018. Rainfall threshold determination for flash flood warning in mountainous catchments with consideration of antecedent soil moisture and rainfall pattern. Nat Hazards. 94(2):605–625.
- Zhang Q, Jiang T, Chen YQD, Chen XH. 2010. Changing properties of hydrological extremes in south China: natural variations or human influences? Hydrol Process. 24(11):1421–1432.
- Zheng YG, Xue M, Li B, Chen J, Tao ZY. 2016. Spatial characteristics of extreme rainfall over China with hourly through 24-hour accumulation periods based on national-level hourly rain gauge data. Adv Atmos Sci. 33(11):1218–1232.