
 ?Mathematical formulae have been encoded as MathML and are displayed in this HTML version using MathJax in order to improve their display. Uncheck the box to turn MathJax off. This feature requires Javascript. Click on a formula to zoom.
Abstract
It is of great significance to conduct an assessment of the susceptibility of certain area to geo-environmental hazards that are intended land-use planning, for hazard prevention. This study first evaluated the four geo-environmental hazards susceptibility in Luoning County using the Analytic Hierarchy Process (AHP). Then, Barrel Principle was used to render a comprehensive hazard susceptibility map, reflecting the stability level of the regional geo-environment. Results showed that the geo-environmental hazards susceptibility area can be graded into four levels, including high-susceptibility, moderate-susceptibility, low-susceptibility, and stable, accounting for 25.3%, 44.8%, 26.5%, and 3.4% of the study area, respectively. Success rate curve was applied to validate the accuracy of the single-hazard susceptibility map produced using the AHP. The results showed that the landslide, rockfall, and goaf collapse susceptibility maps had a success rate of 83.28%, 77.07%, and 85.19%, respectively. Therefore, the single susceptibility map can be helpful for hazard assessment and land-use planning. Finally, a comprehensive susceptibility map was used to select areas of priority for urban development and prevent and mitigate natural hazards that occur.
1. Introduction
Natural disasters cause major economic, social, and environmental problems for countries around the world (Ma Citation2011). According to the World Bank Report (World Bank 2005) on natural disasters, more than half of the world population (3.4 billion) lives in areas affected by natural hazards. Because of the rapid socio-economic development, the scale and intensity of the geological environment utilization in Luoning County are increasing. The incidence of geo-environmental hazards shows an upward trend, seriously endangering the lives and safety of property of the local people (Pan et al. Citation2010; Hu Citation2012). The stability of the geo-environment plays a supporting role in social and economic development (Ma et al. Citation2016).
The geological environment (or the geological environment system) is part of the natural environment (Wang Citation1997). It mainly refers to the geological background, geological processes, and integrating its occurrence related to human survival and development (Xu et al. Citation2009). The geo-environment system interacts with the natural environment system and the socio-economic systems through various exchanges of matter and energy and continues to evolve, gradually achieving stabilizing and balancing (Huang Citation2010). Once the intensity of human activities exceeds the automatic adjustment capability of the geo-environment system, it can inevitably lead to various geo-environmental hazards; for instance, landslides caused by various engineering construction, land subsidence caused by excessive groundwater exploitation, soil and water pollution caused by agricultural activities, and environmental pollution caused by unreasonable sewage discharges.
To minimize the impact of land mass movements, avoidance is the most useful mitigation measure (Ma Citation2011). Use of prevention strategies, such as monitoring, hazard mapping, and risk assessment are be used to indicate the hazard potential. Based on the results of these procedures, mitigation measures, such as structural (e.g. checking dams, debris basins) or non-structural measures (e.g. land-use zoning and early warning systems), could be taken to reduce risk (La Husen Citation2005). The use of this terminology around the world, or even within single countries is seldom uniform; thus, the results of the landslide zoning are often not precisely defined. Fell et al. (Citation2008) defined landslide susceptibility as ‘a quantitative or qualitative assessment of the classification, volume (or area), and spatial distribution of landslides which exist or potentially may occur in an area’. The susceptibility assessment based on the Geographic Information System (GIS) is the basis of geological hazard and risk assessment. It is an effective tool for risk assessment of existing and potential geological disasters (Wang et al. Citation2014b). Its assessment results can be used for hazard prevention and mitigation, land-use, infrastructure planning, and other similar initiatives (Chen Citation2010; Ma Citation2011; Arnous et al. Citation2011). At present, the assessment models include: information quantity method (Zhu et al. Citation2004), Logistic regression method (Li Citation2005; Fang Citation2018), geological hazard assessment considering time effect (Li and Wu Citation2006), weighted spatial probability modelling (Elmahdy and Mostafa 2013), BP neural network model (Zhang et al. Citation2015), Analytic Hierarchy Process (AHP) (Wang and Yi Citation2009; Bathrellos et al. Citation2017), CF and Logistic model (Tian et al. Citation2016). The AHP is a popular deterministic method. It is a weight evaluation process that combines qualitative and quantitative factors for ranking and evaluating alternative scenarios, among which the best solution is ultimately chosen (Saaty Citation1990, Citation2004).
Geo-environmental hazards in a region may be diverse; for example, it can have up to four types of hazards in Pamir exist (Gruber and Mergili Citation2013). Multi-hazard assessments are difficult to accomplish because of the different approaches when assessing individual hazards (Arnous et al. Citation2011). Bathrellos et al. (Citation2017) used the AHP to superpose the landslide, flood and seismic hazard assessment map to evaluate the land-use suitability. However, this method may underestimate the high-risk area of the landslide, so that the high-risk area of the landslide is evaluated as a low-risk area for land use, and make the assessment of land use suitability inaccurate. The barrel principle, also known as the ‘Liebig’s law of minimum’, means that the amount of water in a wooden barrel does not depend on the longest plank of wood, but on the shortest (the limiting factor). This theory has been applied in land resource assessment (Xie et al. Citation2012), safety assessment (Zhou et al. Citation2006), and heavy metal pollutant assessment (Zang Citation2012). For the assessment of geo-environmental hazards susceptibility, we have determined that if there is a high susceptibility of single hazards in a certain area, the susceptibility of geo-environmental hazards in this area is high. This avoids underestimation of high-risk areas, that otherwise may cause the results to deviate from the actual situation (Zhang et al. Citation2016).
Various researchers around the globe have primarily focused on the susceptibility considering a single geological hazard. Geological hazard susceptibility assessments are an important part of geological hazard risk management, and has important practical significance. It is a non-engineering important approach to mitigate hazard losses. The results can be used as an important reference for regional development planning, suitability evaluation of the construction land, and measures for geological hazard control. However, there are few studies that combine multiple hazards assessments for land-use planning and hazards prevention. This study first used the AHP to zone the single-hazard susceptibility map, and then used the barrel principle to combine multi-hazards into a comprehensive map. Using this method, the high susceptibility areas of comprehensive map do not miss any highly susceptibility single-hazard areas, and at the same time, it can select a stable area for urban development.
2. Study area
Luoning County (), covering an area of 2302 km2, is located west of Luoyang City, Henan Province, China. The region is located between 34°05u and 34°38d north latitude, and 111°08r and 111°49r east longitude. In the study area, mountains stand on the south, north, and west, with the Luohe valley crossing from west to east, giving a ‘dustpan’ topography. The elevation ranges from 276 m to 2103.2 m. Landforms in the study area comprise middle mountain (altitude > 1000 m), low mountainous (500–1000 m, above sea level), hilly (500–700 m, above sea level), loess tableland (400–500 m, above sea level), and river valley terrace (276–400 m). shows the basic features of the landform of the study area. The average annual rainfall is 606 mm with uneven distribution over the year. June to September is the annual flood season with its rainfall accounting for approximately 61.1% of the total rainfall during the year.
Figure 1. Location map of the study area. Source: Institute of Henan Geological Survey (http://www.hnddy.com/)
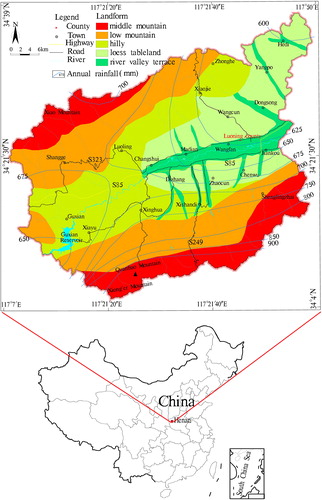
Table 1. Basic features of landform of the study area.
Geotectonically, the study area belongs to the Huaxiongtai region on the southern margin of the North China Platform super region. The active faults can be divided into the following five groups (): (1) Near EW fault; the Luoning Piedmont large fault and the Qinwangzhai-Hanougou fault. (2) NE fault structures; Kangshan-Qilihe fault, Qinggangping-Dayuchang fault, and Longwangmiao-Yuepinggou fault.
Figure 2. Classification of geotechnical engineering rocks group and fault distribution. Source: Institute of Henan Geological Survey (http://www.hnddy.com/)
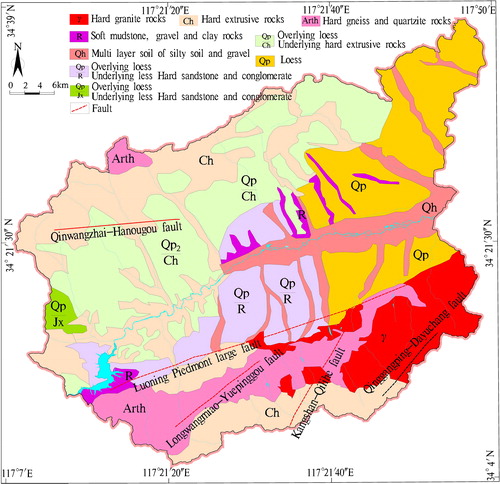
The development depth of mass movements in the study area is <30 m; therefore, the rock and loess within a depth of 30 m are classified. According to the genesis, geological construction type, structure type, rock strength and the combination of rock and soil in the study area, it is divided into six types of engineering geological rock groups (): hard granite rocks (γ); hard extrusive rocks (Ch); hard gneiss and quartzite rocks (Arth); soft mudstone, gravel, and clay rocks (R); Multi-layer soil of silty soil and gravel (Qh); Less Hard sandstone and conglomerate (Jx). In addition, there is a double-layer structure of the above loess and other engineering geological rock groups, within the depth of 30 m in the study area.
Land-use is a process in which human beings engage in land management or economic activities for direct purposes, or where they use certain land characteristics to meet their own needs (Huang Citation2010). The types of land-use in the study area () include mining, water reservoirs, urban and rural construction, road construction, agricultural land, and ecological land. The status quo of land use is closely related to economic activities of human engineering; incorrect activities in the study area have continuously enhanced the degree of intervention damaging to the geo-environment. Different land-use types have different geological environmental effects, a table of which has been compiled by Wang (Citation1997), for the current study area ().
Figure 3. Types of land use in the study area. Source: Institute of Henan Geological Survey (http://www.hnddy.com/)
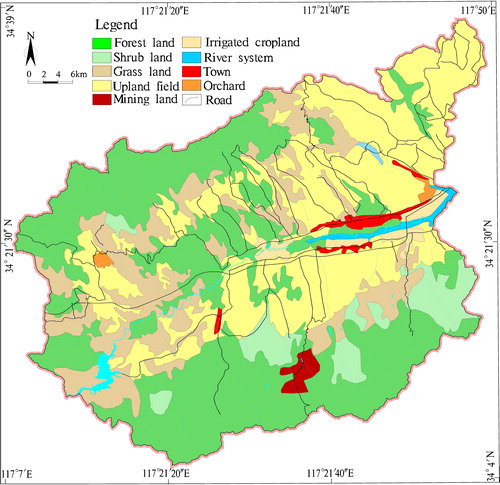
Figure 4. Distribution map of geological environmental hazards in the study area. Source: Institute of Henan Geological Survey (http://www.hnddy.com/), Ministry of Land and Resources of PRC (http://www.mnr.gov.cn/)
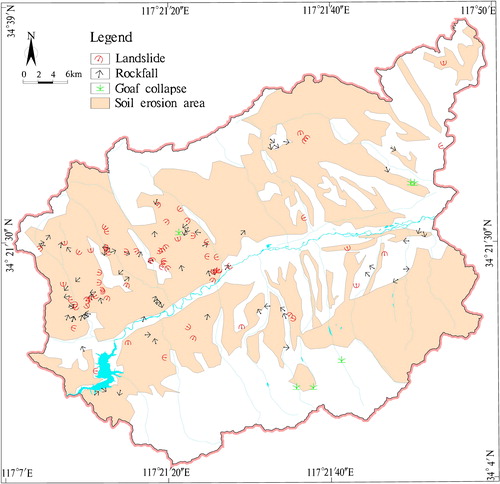
Table 2. Land use types and their geological environmental effects in study area.
The types of geological environmental hazards in the study area are rockfall, landslide, goaf collapse, and soil erosion (Figure 4); with 68 landslides, 71 rockfalls, and 6 goaf collapses; soil erosion area is 1275 km2.
3. Data and methods
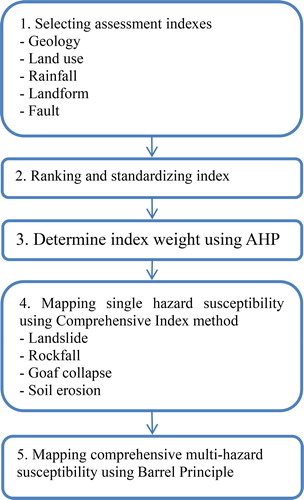
3.1. Workflow
The steps of the work are displayed in .
Figure 5. Flow chart of this study. Source: Authors
3.2. Primary data
The data used in this study comprises: the landform map, fault map (scale 1:50,000), engineering geological map (scale 1:50,000), geological hazards information provided by Institute of Henan Geological Survey, and land-use map (scale 1:200,000) provided by Ministry of Land and Resources of PRC.
3.3. Analytic hierarchy process (AHP)
AHP is a multi-objective decision analysis method based on subjective criteria introduced by the researcher/operator or a group of people. It was developed by Thomas Saaty from the University of Pittsburgh (Saaty Citation1980). The method is to decompose complex problems into several levels with several indexes, make a comparative judgment on the importance degree between the two indicators, establish a judgment matrix, and derive the weight of the importance degree of different indexes. This can provide a basis for the choice of the best solution that most suitable to the decision makers.
The AHP methodology, the decision reaching problem is first clearly defined. Then, the target, main criteria, sub-criteria and alternatives are considered. The interactions between the criteria and the alternatives are determined and a hierarchical structure is formulated. A comparison is made between the criteria and the applicable alternatives, using the assessment scale shown in , and comparison matrices are formed (Saaty Citation1980).
Table 3. The 1–9 scales for pairwise comparisons in the AHP.
The consistency ratio (CR) of each formed matrix must be calculated. Saaty’s consistency ratio is defined as CI/RI, where CI is the consistency index and RI is the random consistency index. An average RI for different matrix orders was developed by Saaty () and is formulated based on the number of criteria (n). The CI is formulated based on Eq. (1), where λmax is the largest eigenvalue of the considered matrix. The CR should be less than or equal to ten percent. If it is greater than ten percent, then the comparison matrix must be revised and the CR recalculated (Saaty Citation1980).
(1)
(1)
Table 4. Random Consistency Index (RI) (Saaty, Citation1980, Citation2000).
The comprehensive index method (Eq. (2)) was used to calculate the comprehensive score of the aptitude for single geo-environmental hazards.
(2)
(2)
where P is the comprehensive score of the susceptibility, Xi is the attribute value of each assessment index, Ni is the weight of each assessment index, a is the number of assessment factor.
After the application of Eq. (2), a single hazard susceptibility assessment map was produced. The Jenks natural breaks classification method was used to classify the hazards into four classes: high, moderate, low and stable.
3.4. Barrel principle
The barrel principle indicates that if there is a high susceptibility of single hazards in a certain area, the comprehensive hazard susceptibility in this area is high. It was used to render the comprehensive susceptibility zoning map and divide study area into four grades: high susceptibility, moderate susceptibility, low susceptibility, and stable.
4. Analyses
4.1. Selection of assessment indexes
No universal guideline exists for selecting the parameters that influence susceptibility mapping (Ma Citation2011). With criteria varying in literature most parameters are chosen based on the characteristics of the research areas (Van Westen et al. Citation2003; Frattini et al. Citation2008) and the availability of data (Yalcin Citation2008; Malet et al. Citation2009). Previous studies (Chang et al. Citation2003; Yue Citation2009; Feng and Xu Citation2010; Pan et al. Citation2010) summarized the factors affecting the susceptibility of geological environment hazards, based on the actual geological environment conditions in the study area.
4.1.1. Selection of landslide and rockfall susceptibility indexes
A landform unit is an important factor for susceptibility (Zhang et al. Citation2018). Landform refers to the surface morphology conducive to landslides and rockfalls. The relative height difference of the slope and the slope angle are necessary conditions for the occurrence of landslides and rockfalls (Chen Citation2010). Loess hilly areas and stony mountainous areas have many slopes that are easily deformed. A river valley terrace is relatively flat with little development of landslide and rockfall areas. Fifty-one landslides in the study area occurred between 25° and 50°, accounting for 75% of the total landslides, with 17 landslides at other degrees. Rockfalls mainly occurred between 65° and 85°, followed by 85° and 90°.
The characteristic of rock and soil is the basic factor that determines whether a slope can produce a landslide or a rockfall (Catani et al. Citation2005). Rock formation with loose structure, low shear strength, low weathering resistance, and prone to deformation under the action of water are the material basis for landslide and collapse occurrence. Soft and hard interbed rocks are also prone to landslide and rockfall formation (Xu et al. Citation2009).
Rainfall has an evoking effect on the formation of landslides or rockfalls and is an important external controlling factor (Xi Citation2014).
The development of landslides and rockfalls is closely related to the active faults (Tian et al. Citation2016). Because rocks are relatively fractured, tectonic conditions often forms that are conducive to the formation and development of landslides and rockfalls. In this study, the influence of faults on landslides and rockfalls susceptibility is described based on the distance from active faults.
Land-use, which collectively reflects engineering and economic activities, is another criterion for deciding the susceptibility for mass movement initiation (Horton et al. Citation2008; Huang Citation2010). In the study area, the rapid development of highway construction, cave dwelling, and mining activities in the southern region often disrupt the original equilibrium of the slopes, and over time induce and advance landslides.
4.1.2. Selection of goaf collapse susceptibility indexes
Zhang et al. (Citation2005) divided the impact factors that cause goaf collapses into three categories: geological conditions, mining conditions, and ground features. Yan et al. (Citation2014) divided the assessment indicators of the goaf collapse susceptibility of the gypsum mining area into soil layers, ore layers and groundwater factors. This study considers this existing data, and determines the soil type, rainfall, distance from fault, and mining activity intensity as indicators of the potential for surface collapse.
4.1.3. Selection of soil erosion susceptibility indexes
The universal soil loss equation (USLE) is one of the most common techniques to assess the loss of soil due to water erosion. The average annual soil loss (A) is given by the product of six factors (Wischmeier and Smith Citation1978); see Eq. (3) for this expression.
(3)
(3)
where A is the average annual soil loss per unit of area (t ha−1 yr−1), R is the rainfall-runoff erosivity factor (MJ mm ha−1 h−1 yr−1), K is the soil erodibility factor (t ha h MJ−1 ha−1 mm−1), L⋅S is the topographic factor (dimensionless), C is the cover-management factor (dimensionless), and P is the support practice factor (dimensionless).
Considering the validity of the data based on the existing research (Wang et al. Citation2001, Citation2014a), the susceptibility of soil erosion is based on the influence of climate, soil properties, topography, and surface coverage. For the soil loss type due to water erosion in the study area, rainfall, landform, soil type and land use, were determined as indicators for soil erosion susceptibility assessment. Precipitation is the driving factor, the source of power for the development of slope erosion; which determines the erosive force of the external action on the surface rock system. Land-use containing vegetation factors is the impedance factor. The landform controls the amount of soil erosion. The soil type represents the magnitude of the erodibility of different soils, and thus affects the occurrence of soil erosion.
4.2. Assessment indexes ranking division
Four sequential standardized values (1–4) were used for the hazard susceptibility index in this analysis (), where, 4 = very prone to hazard and 1 = not prone to hazard.
Table 5. Assessment index system of four hazards susceptibility.
4.3. Division of assessment units
At present, there are three methods of dividing the assessment unit for susceptibility assessment. First is to take the regional administrative region as the assessment unit (Chen and Cai Citation2005), second is to take the regional natural geography or geological structure as the assessment unit (Zhang et al. Citation2008), while the third is based on longitude and latitude or a geographical grid; the grid unit is established according to the regional geo-environmental characteristics (Hu et al. 2006). In view of the small size of the study area and the large discrepancy of the assessment indexes, this study used the irregular polygon mesh method to divide the evaluation unit. Each evaluation unit uses the attribute boundary of each evaluation index as a unit boundary. The attributes of all evaluation indicators in each evaluation unit are uniform, avoiding errors caused by inhomogeneous attributes. The division of the assessment unit was completed in MAPGIS software, following these subsequent steps: first, generate the susceptibility assessment units map of four hazards by superimposing the single factor zoning maps of geo-environment hazard susceptibility index. Then, superpose the four single-hazard susceptibility maps to generate geo-hazards susceptibility assessment units.
5. Results and discussion
5.1. Determination of the weight of the assessment index
show the table-matrix for four hazards assessment models, the pair-wise comparisons of the factors, weighting coefficient of every factor, and CR. All CR values are <0.1, indicating a sufficient level of consistency in the pair-wise comparisons.
Table 6. Pairwise comparison matrix for landslide susceptibility assessment. L1 = Landform, L2 = Engineering geology, L3 = Distance from fault, L4 = Land use, L5 = Rainfall.
Table 7. Pairwise comparison matrix for rockfall susceptibility assessment. R1 = Landform, R2 = Engineering geology, R3 = Distance from fault, R4 = Land use, R5 = Rainfall.
Table 8. Pairwise comparison matrix for goaf collapse susceptibility assessment. G1= Soil type, G2 = Distance from fault, G3 = Rainfall, G4 = Land use.
Table 9. Pairwise comparison matrix for soil erosion susceptibility assessment. S1 = Soil type, S2 = Landform, S3 = Rainfall, S4 = Land use type.
5.2. Assessment of single geo-environmental hazard susceptibility
The four single-hazard susceptibility zoning maps were obtained (). According to the results of the susceptibility zoning maps, the number and proportion of hazards under various susceptibility levels were counted ().
Figure 6. Single-hazard susceptibility zoning map. (a) Landslide, (b) Rockfall, (c) Goaf collapse, (d) soil erosion. Source: Authors
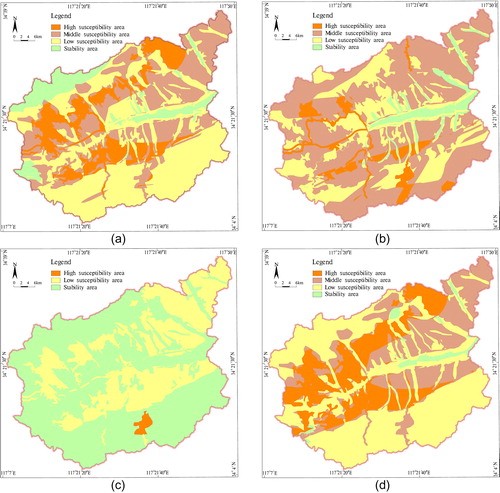
Table 10. Statistical table of single hazard susceptibility assessment mapping.
5.3. Comprehensive multi-hazards susceptibility assessment
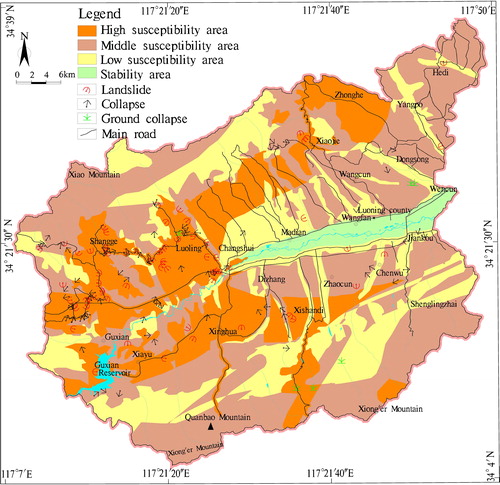
The four single-hazard susceptibility zoning maps were complied, generating a comprehensive map ().
Figure 7. Comprehensive multi-hazards susceptibility map. Source: Authors
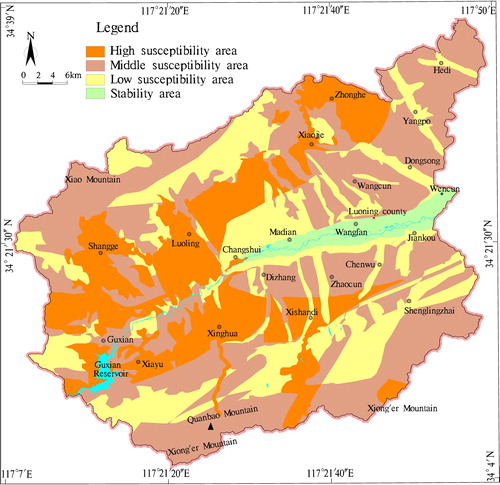
There are 98 geological hazards, including 56 landslides, 39 rockfalls and 3 goaf collapses in the high susceptibility areas of geo-environmental hazards of the study area. The topography includes low mountains and hilly landforms, with large-ground drop. There are many surface loess layers with surface runoff and gravity erosion being strong, and human engineering activities such as road construction and mining are numerous.
There are 32 geological hazards in the moderate susceptibility area of geo-environmental hazards, including 7 landslides, 23 rockfalls, and 2 goaf collapses. This zone is mainly located in middle mountain and loess tableland landforms. In the middle mountainous area, the terrain is steep; the lithology is dominated by granite, gneiss, and have many sets of joints. The loess tableland area is severely weathered, and is prone to rockfalls, landslides, and soil erosion.
There are 15 geological hazards in the low susceptibility area, including 5 landslides, 9 rockfalls, and 1 goaf collapse. The topography is dominated by low mountain and loess tableland landforms. With less occurrence of geological hazards, the vegetation coverage of the area is high.
Stable susceptibility area experiences no geological hazard. The area is located on both sides of the Luohe River valley, east of Changshui Town; the area has a river valley terrace landform with a flat terrain. Although the population is dense and human engineering activities are strong, the damage to the geo-environment is small.
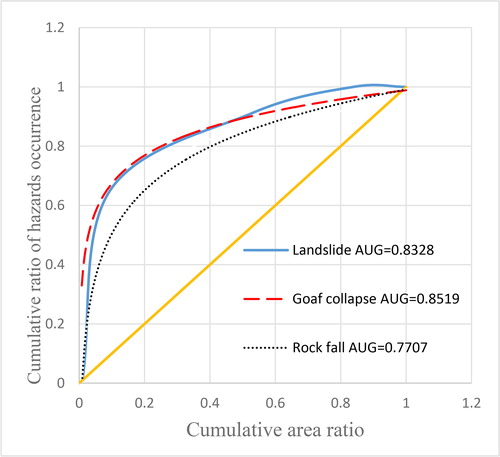
5.4. Validation of the single susceptibility maps
Validation of the landslide susceptibility model is a significant requirement to check the predictive capabilities of the landslide susceptibility map prepared (Chung and Fabbri Citation2003). The success rate curve was used to validate the rationality of the model (Pradhan Citation2013; Wu et al. Citation2016), obtained by comparing the existing landslide data with the landslide susceptibility map (). Concurrently, the rockfall and goaf collapse susceptibility maps were verified, while, the soil erosion susceptibility map cannot be evaluated based on observational data. The area under the curve (AUC) method was used to qualitatively assess the prediction accuracy (); an AUC = 1 indicates perfect prediction accuracy. The AUG value of landslide, rockfall, and goaf collapse were 0.8328, 0.7707 and 0.8519, respectively. It also indicated that the success rate was 83.28%, 77.07% and 85.19%, respectively. The AHP used to assess landslide, rockfall, and goaf collapse susceptibility in this study showed high prediction accuracy. Therefore, it can be applied to produce the susceptibility map for the study area.
Figure 8. The success-rate results of the single hazard susceptibility maps obtained from the AHP. Source: Authors
5.5. Use of comprehensive susceptibility map
The predictions of AHP are not absolute but represent relative degrees of susceptibility. However, it is a way to predict hazard location. The comprehensive map of multi-hazards susceptibility produced using the barrel principle method can usually avoid the underestimation of high-risk areas; however, it may overestimate some low-risk areas. Although this is the shortcoming of this approach, it is undoubtedly a better method of avoiding enormous losses in such a densely populated area as Luoning County.
The regional scale susceptibility map obtained in this study has several benefits for urban development planning. First, it can be used to select priority areas for urban development such as parks and residential areas. The four single-hazard susceptibility maps integrated through the barrel principle, generate a stable area. There are few geological hazards in the low-prone and non-favorable areas. Therefore, these areas can be used as a priority area for urban development. Second, it provides a risk assessment for current human projects such as buildings and highways. Comparing the existing roads with the comprehensive susceptibility map, shows that 39.7% of the road networks are located in the high susceptibility areas, while moderate susceptibility, low susceptibility, and stable area account for 26.0%, 28.5%, and 5.88%, respectively. Thus, the main roads are constructed in susceptible areas concerning natural hazards. In these areas, the appropriate land-use planning, along with the selection of the proper constructions, is essential to prevent and mitigate the consequences of any natural hazard occurrence.
Figure 9. Compared the main roads with the comprehensive susceptibility map. Source: Authors
6. Conclusion
In this study, susceptibility indicators were selected based on the formation mechanism of various geo-environmental hazards including landslide, rockfall, goaf collapse, and soil erosion. The assessment system of geo-environmental susceptibility was established using the AHP. The barrel principle was used to render the comprehensive susceptibility hazard map to reflect the stability level of the regional geo-environment.
The assessment results show that the multi-hazards zoning carried out in this study is consistent with the hazards distribution that were observed in the field investigation according to 1: 50,000 geological hazard survey by the Institute of Henan Geological Survey. There are 98, 32 and 15 hazards in the high, moderate and low susceptibility areas, respectively. There is no hazard in the stable area. The coincidence rate between the soil erosion area and the high and moderate susceptibility areas of comprehensive map is high. Assessment results were used to select priority areas for urban development in the stable level of comprehensive susceptibility map in the study area. Moreover, these also helped with comprehending the disaster avoidance for the main roads.
We verified the validation results of three single susceptibility maps and the success rate curve was applied. The results show that the success rate of landslide, rockfall, and goaf collapse susceptibility maps were 83.28%, 77.07%, and 85.19%, respectively. This proves that the method proposed in this study is effective for implementation while assessing natural hazards and consequent land-use planning.
Acknowledgments
Thanks to the Institute of Henan Geological Survey and Ministry of Land and Resources of PRC for their help and data. Also, the authors would like to express their gratitude to two anonymous reviewers for their constructive comments and suggestions, which highly increased the quality of the paper.
Disclosure statement
No potential conflict of interest was reported by the authors.
References
- Arnous MO, Aboulela HA, Green DR. 2011. Geo-environmental hazards assessment of the north western Gulf of Suez. J Coast Conserv. 15(1):37.
- Bathrellos GD, Skilodimou HD, Chousianitis K, Youssef AM, Pradhan B. 2017. Suitability estimation for urban development using multi-hazard assessment map. Sci Total Environ. 575:119–134.
- Catani F, Casagli N, Ermini L, Righini G, Menduni G. 2005. Landslide hazard and risk mapping at catchment scale 2005 Arno River basin. Landslides. 2(4):329–342.
- Chang J, Miao CH, Li B, Liu JY, Xiao Y, Li YL. 2003. Studies on spatial temporal change of cultivated land in the middle Yiluo Basin on RS and GIS technology – a case study of Luoning County. J Henan Agric Sci. 7:37–39.
- Chen MQ, Cai HS. 2005. Comprehensive evaluation of natural factors fragile of eco-environment in Poyang Lake region. Chin J Eco Agric. 13(4):181–183.
- Chen YP. 2010. GIS based landslide susceptibility assessment of Guizhou province using multi-model comprehensive evaluation [master’s thesis]. Changsha: Central South University.
- Chung CJF, Fabbri AG. 2003. Validation of spatial prediction models for landslide hazard mapping. Nat Hazards. 30(3):451–472.
- Elmahdy SI, Mostafa MM. 2013. Natural hazards susceptibility mapping in Kuala Lumpur, Malaysia: an assessment using remote sensing and geographic information system (GIS). Geomat Nat Hazards Risk. 4(1):71–91.
- Fang JY. 2018. Landslide susceptibility assessment based on GIS and logistic regression model. Pearl River. 39(4):66–70.
- Fell R, Corominas J, Bonnard C, Cascini L, Leroi E, Savage WZ. 2008. Guidelines for landslide susceptibility, hazard and risk zoning for land-use planning. Eng Geol. 102(3–4):99–111.
- Feng L, Xu JH. 2010. Study on development patterns of geological hazards in Western Henan Province. Bull Henan Earth Sci. 5:350–354.
- Frattini P, Crosta G, Carrara A, Agliardi F. 2008. Assessment of rockfall susceptibility by integrating statistical and physically-based approaches. Geomorphology. 94(3–4):419–437.
- Gruber FE, Mergili M. 2013. Regional-scale analysis of high-mountain multi-hazard and risk indicators in the Pamir (Tajikistan) with GRASS GIS. Nat Hazards Earth Syst Sci. 13(11):2779–2796.
- Hu A-Y, Guo S-L, Liu Y, Lin K-R. 2006. Ecologic environment quality fuzzy comprehensive evaluation in the land river basin. J Geol Hazards Environ Preserv. 17(2):69–73.
- Horton P, Jaboyedoff M, Bardou E. 2008. Debris flow susceptibility mapping at a regional scale. In: Proceeding of the 4th Canadian conference on geohazards: from causes to management. edited by: Locat J, Perret D, Turmel D, Demers D, and Leroueil S. Quebec, Canada, 20–24 May 2008, 339–406.
- Hu ZJ. 2012. The problem of geological disasters in Luoyang City and its prevention and control measures. West-China Explor Eng. 24(3):136–137.
- Huang YZ. 2010. Research on the vulnerability of the geological environment and its Countermeasures in Lijiang [dissertation]. Kunming: Kunming University of Science and Technology.
- La Husen R. 2005. Debris-flow instrumentation. In: Jakob M, Hungr O, editors. Debris-flow hazards and related phenomena. Berlin: Springer; p. 291–304.
- Li DQ, Wu SH. 2006. Landslide risk assessment and management considering time effect. Rock Soil Mech. 27(12):2239–2245.
- Li XP. 2005. Study on logistic regression model applied to regional slope stability evaluation based on GIS [dissertation]. Wuhan: China University of Geosciences (Wuhan).
- Ma CM, Kuang H, Zhang JJ, He ZK. 2016. Discussion on the comprehensive evaluation of geo-environment in urban areas. Hydrogeol Eng Geol. 43(5):100–104.
- Ma YW. 2011. Regional scale multi-hazard susceptibility assessment: a case study in Mtskheta Mtianeti, Georgia [master’s thesis]. Enschede: The University of Twente.
- Malet JP, Thiery Y, Hervas J, Gunther A, Puissant A, Grandjean G. 2009. Landslide susceptibility mapping at 1:1M scale over France: exploratory results with a heuristic model. Proc. Int. conference on landslide processes: from geomorphologic mapping to dynamic modelling, A tribute to Prof. Dr. Theo van Asch, 6-7 February 2009, Strasbourg, France, pp.315–320.
- Pan SQ, Li YT, Zhao S, Zhu LQ. 2010. Study on the soil erosion of Luoning County based on RS and GIS. J Henan Univ Nat Sci. 40(2):156–161.
- Pradhan B. 2013. A comparative study on the predictive ability of the decision tree, support vector machine and neuro-fuzzy models in landslide susceptibility mapping using GIS. Comput Geosci. 51:350–365.
- Saaty TL. 1980. The analytic hierarchy process. New York: McGraw Hill. International, Translated to Russian, Portuguese, and Chinese, Revised editions, Paperback (1996, 2000). Pittsburgh: RWS Publications.
- Saaty TL. 1990. How to make a decision: the analytic hierarchy process. Eur J Oper Res. 48(1):9–26.
- Saaty TL. 2000. Fundamentals of decision making and priority theory with the analytic hierarchy process. Vol. 6. Pittsburgh: RWS Publications.
- Saaty TL. 2004. Decision making – the analytic hierarchy and network processes (AHP/ANP). J Syst Sci Syst Eng. 13(1):1–35.
- Tian CS, Liu XL, Wang J. 2016. Geohazard susceptibility assessment based on CF mode land logistic regression models in Guangdong. Hydrogeol Eng Geol. 43(6):154–161.
- Van Westen CJ, Rengers N, Soeters R. 2003. Use of geomorphological information in indirect landslide susceptibility assessment. Nat Hazards. 30(3):399–419.
- Wang J, Cheng WM, Shenglin Q, Chenghu Z, Wenjie, Chiming ZT. 2014a. Sensitive evaluation and spatial analysis of soil and water loss based on USLE and GIS: taking Taihang Mountain area of Hebei Province as an example. Geogr Res Aust. 33(4):614–624.
- Wang JJ, Yin KL, Xiao LL. 2014b. Landslide susceptibility assessment based on GIS and weighted information value: a case study of Wanzhou district, three gorges reservoir. Chin J Rock Mech Eng. 33(4):797–808.
- Wang SJ. 1997. Interaction between human engineering activity and geo-environment and its environmental effects. J Geol Hazards Environ Preserv. 8(1):20–27.
- Wang XK, Ou Yang ZY, Xiao H, et al. 2001. Distribution and division of sensitivity to water-caused soil loss in China. Acta Ecol Sin. 21(1):14–19.
- Wang Z, Yi FC. 2009. AHP-based evaluation of occurrence easiness of geological disasters in Mianyang City. J Nat Disasters. 18(1):14–23.
- The World Bank Annual Report. 2005. World Bank Publications: The World Bank, number 7537, October.
- Wischmeier WH, Smith DD. 1978. Predicting rainfall erosion losses. A guide to conservation planning. Vol. 537. Washington: USDA Agriculture Handbook. p. 58.
- Wu Y, Li W, Liu P, Bai H, Wang Q, He J, Liu Y, Sun S. 2016. Application of analytic hierarchy process model for landslide susceptibility mapping in the Gangu County, Gansu Province, China. Environ Earth Sci. 75(5):422.
- Xi PP. 2014. Study on geological hazard susceptibility evaluation based on GIS of Lang County [master’s thesis]. Jilin: Jilin University.
- Xie W, Guo X, Zhao XM, Huang C. 2012. A study on comprehensive evaluation of cultivated land fertility based on barrel principle in county locality. Acta Agriculturae Universitatis Jiangxiensis. 34(4):846–850.
- Xu HL. 2009. Environmental geology. Beijing: Geological Publishing House.
- Yalcin A. 2008. GIS-based landslide susceptibility mapping using analytical hierarchy process and bivariate statistics in Ardesen (Turkey): comparisons of results and confirmations. Catena. 72(1):1–12.
- Yan SM, Li LG, Liu BY. 2014. Fuzzy comprehensive evaluation on susceptibility of mining surface collapse in Pizhou gypsum mine in Jiangsu. J Geol. 38(2):334–338.
- Yue CJ. 2009. Research on geo-hazard risk zoning of Zhongyuan City Group [dissertation]. Beijing: China University of Geosciences (Beijing).
- Zang CL. 2012. Comprehensive evaluation method based on the barrel theory research and application [master’s thesis]. Chengdu: Chengdu University of Technology.
- Zhang B, Shi CB, Xiao ZY, Zhang JZ, Wu L, Xi B, Lu SZ. 2018. Geologic hazards susceptibility assessment in E’zhou City of Hubei Province based on GIS and weighted information value. Chin J Geol Hazard Control. 29(3):101–107.
- Zhang CM, Dong XZ, Qi LH, Zhao B. 2005. Two-stage FUZZY comprehensive evaluation on the risk degree of ground collapse in Mencheng town. Earth Environ. 33(S1):99–103.
- Zhang GL, Yang BL, Zhang Z, Wang SJ. 2015. Susceptibility prediction of underground mining collapse based on GIS and BP neural network. Trop Geogr. 35(5):770–776.
- Zhang JJ, Ma CM, Kuang H, Zhou AG, Xia Y. 2016. Geo-environmental suitability assessment with variable weight for underground space exploitation in Zhengzhou. Hydrogeol Eng Geol. 43(2):118–125.
- Zhang YW, Liu HN, et al. 2008. Application of expert cluster method in vulnerability evaluation of geological environment in Qingdao City. Land Resour Shangdong Prov. 24(10):27–30.
- Zhou Y, Zhang J, Zhou N, Chen XH. 2006. Synthetic assessment with cask theory. Computer Engineering. 32(17):197–199.
- Zhu LF, Wu XC, Yin KL, et al. 2004. Risk zonation of landslide in China based on information content model. J Earth Sci Environ. 26(3):52–56.