
 ?Mathematical formulae have been encoded as MathML and are displayed in this HTML version using MathJax in order to improve their display. Uncheck the box to turn MathJax off. This feature requires Javascript. Click on a formula to zoom.
Abstract
Rainstorms are one of the frequent natural disasters which have significant impact on agricultural production and people’s lives. Considering the comprehensive influence of various factors on the rainstorm events, this study extracts four elements of rainstorms in the Liaoning Province based on meteorological data collected between 1957 and 2015. Combined four elements of rainstorms by copula function, the cumulative probability of the rainstorm events and the probability of their return period can be analysed. The results show that the joint return period of multiple factors combination is less than the return period of a single factor. The degree of accuracy of the joint return period is higher, which is consistent with the actual situation. During periods of 5, 10, 20, and 50 years, the occurrence probability varies according to the idea ‘the central region is higher, while the eastern and western regions are lower’. Special attention must be paid to the low values of the region in future rainstorm disaster prevention and mitigation work. Based on return periods, the agricultural risk grade can be divided into 5 levels. In ascending order, they are level I (Fuxin, Shenyang, Tieling), II (Dalian, Jinzhou, Panjin, Liaoyang), III (Huludao, Fushun), IV (Chaoyang, Yingkou, Anshan, Benxi), and V (Dandong).
1. Introduction
In the past 20 years, global and regional extreme rainstorm events, which were affected by climate change, occurred frequently. As an extreme rainfall event, rainstorm often caused great losses to countries and regions. China is one of the countries that are mostly affected by rainstorm; more than 70% of cities and 50% of population are in areas where serious disaster situations occur (Huang Citation2015). Among the disasters, rainstorm and flood disasters are two of the most common types of natural disasters. According to statistics, in 2016, 192 cities in China were flooded or damaged by waterlogging, which resulted in a direct economic loss of 54.16 billion dollars, accounting for 0.49% of GDP in that year (Shao and Liu Citation2018). On 16 August 2013, rainstorm led to a direct economic loss of more than 1.2 billion in the Liaoning Province (Yang et al. Citation2017). In the late July 2016, the Liaoning Province experienced a rainstorm that caused a serious disaster in Lingyuan, where 11,300 people were impacted, resulting in direct economic losses of 1.1 million. The affected area of crops was 793.9 hm2, of which 653.4 hm2 of crops did not produce a yield (Wang et al. Citation2015). In 2017, the Liaoning Province suffered a level-I rainstorm, a total of 7 cities and 22 counties were affected by the ‘August 3rd’ torrential rains that influenced 728,800 people to be affected, Xiuyan was affected the most, and 3 people were killed (Feng Citation2018). Thus, it is obvious that heavy rain has become one of the most serious natural disasters in the Liaoning Province. Therefore, it is necessary to study the rainstorm in the Liaoning Province, China.
The Intergovernmental Panel on Climate Change (IPCC) Fifth Assessment Report noted that the frequency of regional rainstorm events has increased (IPCC 2014), but the change of rainfall is influenced by circulation and has certain regional characteristics. At present, meteorologists in various countries mainly focus their study of rainstorm on the spatio-temporal distribution characteristics of rainstorm elements and rainstorm risk analysis (Smith Citation1996; Brooks and Stensrud Citation2000; Chrysoulakis et al. Citation2008). The analysis of spatio-temporal features of rainstorm elements has always been one of the key components of meteorological research (Kokilavani et al. Citation2017). Scholars generally choose to analyse spatio-temporal changes and differences of different rainstorm elements including rainstorm volume, rainstorm days, rainstorm intensity, and so on (Zamani et al. Citation2018). Time-series analysis methods include trend analysis (Wu and Qian Citation2017), the Mann–Kendall mutation test and the moving T-test (Zhao et al. Citation2017), wavelet period analysis (Palizdan et al. Citation2017) and so on. Spatial analysis methods are mostly about spatial visual analysis (Mandal et al. Citation2016; Modarres and Sadeghi Citation2018). In addition, some scholars in the field of atmospheric science have studied rainstorm mainly for a rainstorm event (Ran et al. Citation2019). From the perspective of atmospheric science, the formation mechanism and typical characteristics of the rainstorm are analysed. In addition to the research on the temporal and spatial distribution of rainstorm, the research with regard to the assessment of rainstorm risk has increasingly become a focus of scholars studying catastrophes and climatology (Shao et al. Citation2014; Hu Citation2016). The study of risk regionalisation and management counter measures on the basis of regional rainstorm risk assessment has become one of the key foci in the study of rainstorm regionalisation (Wu et al. Citation2015; Xiao et al. Citation2017). In order to face the multi-essential of rainstorm and to further analyse the inherent relationships between the elements of rainstorm, scholars began to present the characteristics of torrential rains from the perspective of combining multiple elements, and conducted risk zoning studies on regional rainstorm (Wang et al. Citation2017). The Copula function uses the correlation between different elements and connects the joint distribution function of each marginal distribution (Sklar Citation1959). The Copula function was first used in the insurance and financial fields (Nelsen et al. Citation2001). In the late 1990s, Copula theory began to be widely applied in other fields, such as in biology, hydrology, and disaster studies. Li et al. (Citation2015) used the Copula function to perform risk analysis of meteorological drought for maize crops in North China Plain, and determined that the contribution of the uncertainty in early warnings of drought stress in higher drought levels could lead to a foundation for future multi-element joint analysis of crop-related meteorological disasters. Feng et al. (Citation2017) evaluate the spring dust storm return period by building the bivariate Copula model in Inner Mongolia, Northern China. They found that the joint return period showed better fitting results than without considering the integrated factor when the actual dust storm return period is longer than 2 years. Amirataee et al. (Citation2018) used the Copula function to analyze the percentages of drought intensity and drought area in the Lake Ulmia basin in Iran, the results indicated that extreme drought and non-drought behaviors had affected the majority of study areas. The study included a probability analysis of different combinations of the variables, different design values of combined probability conditions, as well as the specific joint return period and over recurrence possible combinations of a variable period.
In summary, the current use of the Copula function in scientific research, including financial risk areas, biology, geography, hydrology, meteorology, and other fields, has matured more and more and has improved from two-dimensional joint to three-dimensional joint (or even more) dimensions. In the study of regional rainstorm, most scholars build joint functions that include two-dimensional variables, but some scholars have already used a multi-dimensional Copula function in certain areas to promote discussion about many elements of the Copula rainstorm joint distribution characteristics in the Liaoning Province. This is the current application of the Copula function for academic research. We can comprehensively and accurately analyse the occurrence characteristics of an event under the influence of multiple factors. In this paper, we will combine the multiple elements of rainstorm with the Copula function in order to understand the characteristics of rainstorm in the Liaoning Province more comprehensively and better. Furthermore, spatial analysis of the probability of the return period of rainstorm is performed, and the return period is introduced for the study of agricultural risk zoning of rainstorm, which provides a scientific basis of government disaster prevention and mitigation. Previous researches on regional rainstorm mainly focus on spatio-temporal characteristic distribution and occurrence characteristics of rainstorm, but lack of researches on rainstorm from multi-dimensional joint perspective. To some extent, this study makes up for the deficiency in the study of rainstorm in Liaoning Province. From the perspective of the combination of multiple elements of rainstorm, the actual foothold of this paper is put on the impact of rainstorm on regional agricultural production, and the impact of rainstorm on regional agriculture is studied from the perspective of production practice. Results will be more accurate for understanding the occurrence and regularity of rainstorm to ensure the safety of agricultural production in the Liaoning Province. Results will also help prevent and mitigate the adverse effects of rainstorm events on the development of agriculture in the Liaoning Province.
2. Research area overview and research methods
2.1. Research area overview
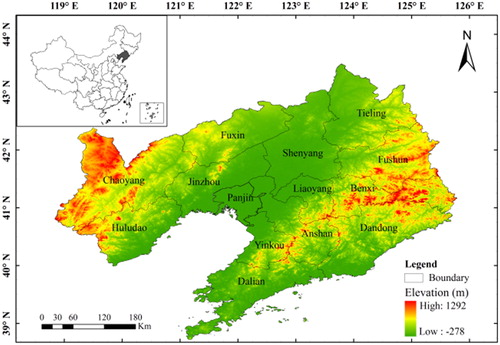
The Liaoning Province is located in the southern part of northeast China (118°E–125°E, 38°N–43°N). It is in a temperate continental monsoon climate region (). In the province, the eastern part is moist and hilly, the middle is a semi-humid plain, and western part is semi-humid and mountainous. Rainstorm, affected by topography, decreases from the southeast coast inland toward the northwest, and the probability of rainstorm occurrence is higher. The Yingkou – Dashiqiao – Liaoyang – Benxi – Fushun – Qingyuan cities are combined with a line from the east of the province to the rainstorm center (Yao et al. Citation2010; Wang et al. Citation2015). Affected by humid air flow and terrain, the precipitation in this area reaches 700–900 mm/a. Rainstorm in the region is frequent and can easily lead to secondary disasters such as debris flows and flash floods.
Figure 1. Study area.
2.2. Data sources and research methods
2.2.1. Data sources
The precipitation data used in this study were obtained from the China Meteorological Data Network (http://data.cma.cn). The basic data are daily precipitation data from 22 national automatic weather stations in the Liaoning Province, collected from 1957 to 2015. According to Precipitation International Standards, within 24 h, precipitation excess 50 mm indicates ‘rainstorm’. Extracted elements of rainstorms (i.e. rainstorm volume, rainstorm days, and rainstorm intensity and contribution rate of rainstorm) are the main data that were used in this study. Socio-economic data mainly come from the disaster data with the influence of rainstorm on behalf of various sites in recent years, mainly from the China Meteorological Data Network.
2.2.2. Determination of the edge distribution function
The premise of constructing a Copula function is to determine the marginal distribution function of each single factor. The maximum likelihood method is used to fit the marginal function of the rainstorm elements (Park et al. Citation2015). This study uses seven kinds of marginal functions that are commonly adopted in hydrology and meteorology to perform marginal fitting on rainstorm elements. They are the Generalised Extreme Value Distribution (GEV), Extreme Value Distribution (EV), Exponential Distribution (Exp), Poisson Distribution (Poisson), Normal Distribution (Norm), Gamma Distribution (Gam), and Rayleigh Distribution (Rayl), and they are served to determine the best fitting marginal function of each rainstorm element.
(1)
(1)
(2)
(2)
(3)
(3)
In the formula, L(θ) refers to the likelihood function, F(xi; θ) refers to the marginal distribution density function, and θ refers to the estimated parameter.
2.2.3. Copula function and return period
On the basis of determining the marginal distribution function of each variable, the Copula function is used to combine the multi-element of rainstorm. Copula functions commonly have three categories: Oval, Archimedean and Quadratic. One of the most widely used categories in the field of hydrology is the Archimedean Copula function. The most common 3D Copula functions are the Frank Copula, Clayton Copula, Gumbel-Hougaard (GH) Copula and Ali-Mikhail-Haq (AMH) Copula functions (). For estimating parameters of the three-dimensional Copula function, we used the maximum likelihood method and the Spearman coefficient to measure the correlation between the rainstorm variables (the greater the correlation coefficient, the higher the correlation between the variables and the Copula function will be more accurate).
Table 1. Common three-dimensional Copula function and its formula, parameter range.
It is assumed that each rainstorm element has a certain correlation that can represent the characteristic elements in the rainstorm events. The marginal functions are u = F (p), v = F (d), w = F (i). N refers to the sample observation length, and n refers to the number of times that the value is exceeded during the study period. The single-factor return period is expressed as:
(4)
(4)
(5)
(5)
(6)
(6)
In general, the joint probability distribution of a joint event C (u, v, w) is denoted F, and its expression is:
(7)
(7)
The joint return period refers to an event that is greater than or equal to a certain value, and the average interval required for each occurrence. In the field of meteorology, the period of return indicates the period during which meteorological disasters occur and is often used as a return period in disaster prevention and mitigation work. The joint return period can be expressed as:
(8)
(8)
3. Joint analysis of 3D copula rainstorm elements
3.1. Copula function established
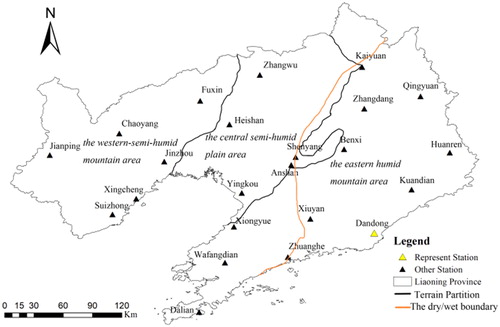
Due to the significant terrain division in Liaoning Province, we must consider the influence of terrain and moisture change when we combine the Copula function analysis of multiple elements of rainstorm. Based on the ArcGIS software, and according to the DEM elevation data and the Liaoning water zoning grid data, the Liaoning Province is divided into the eastern humid mountain area, the central semi humid plain area and the western-semi-humid mountain area (). In this study, 22 national meteorological stations are combined with the topographic water map of Liaoning Province to obtain the topography and moisture partitioning features of each site. The sites on both sides of the topographic division boundary and the water partition boundary are affected by the topography and the water, and the error is greater than the other stable sites in the region when it represents the elements of each area’s rainstorm. Therefore, the representative stations of the Western-semi-humid mountain area include the Jianping station, the Chaoyang station, the Fuxin station, the Suizhong station and the Xingcheng station; The representative stations of the middle-semi-humid plain area include the Zhangwu station, the Heishan station and the Yingkou station; The representative stations in the eastern-moist mountain area include the Zhangdang station, the Qingyuan station, the Huanren station, the Kuandian station, the Dandong station and the Benxi station. In addition, the Xiongyue station, the Wafangdian station and the Dalian station are abundant in the Liaodong Peninsula, which is affected by the ocean air flow. Considering this factor, the most representative of the three stations is selected as the representative and classified in the eastern-humid mountain area for joint analysis. The Dandong station as a high incidence area of rainstorm in Liaoning Province, its rainstorm characteristics can better reflect the characteristics of rainstorm events in Liaoning Province. Therefore, in this article, we will analyse the Dandong station as a representative site ().
Figure 2. Topographic and moisture zoning map of Liaoning Province.
Based on the spearman correlation coefficient, the Dandong station was selected to combine three factors: rainstorm volume, rainstorm days and rainstorm intensity. The spearman correlation coefficients were close to 1, and passed the significance test of 0.05. This shows that the correlation between the various elements of rainstorms is conspicuous (). Using the MATLAB program to determine the marginal distribution of rainstorm in the Dandong, according to the fitting principle, the Generalised Extreme Value Distribution was selected to represent the marginal distribution function of rainstorm volume and rainstorm intensity. The marginal distribution of rainstorm days is in accordance with the Gamma Distribution, and passed the test of confidence in 0.05 (). By comparing the empirical distribution of the rainstorm single factor of the selected marginal distribution, it is apparent that the marginal distribution function of each rainstorm element reflects the characteristics for each element of the rainstorm well with a high degree of credibility (). After determining the marginal distribution of each element of the rainstorm, the maximum likelihood method was used to calculate the parameter values in the marginal distribution function of each element of the rainstorm for the 22 meteorological stations in the Liaoning Province.
Table 2. Spearman correlation coefficient was used to analyze the correlation between rainstorm elements in Dandong Station.
Table 3. Edge distribution K-S test and P-value of single element of rainstorm at Dandong station.
Figure 3. Edge distribution and empirical distribution fitting curve of rainstorm elements in Dandong station (a) rainstorm volume, (b) rainstorm days, and (c) rainstorm intensity.
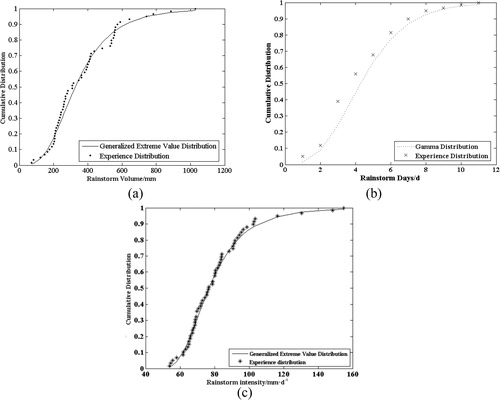
As shown in , the degree of fit between the empirical distribution of a single rainstorm element and the marginal distribution function is high. The initial rainstorm value is 50 mm, at which time the corresponding cumulative probability is close to 0. It shows that the cumulative probability of occurrence of rainstorm during the study period is the lowest when the amount of the rainstorm is 50 mm. From 1957 to 2015, the maximum rainstorm volume recorded at the Dandong station reached 1,100 mm, which is much higher than the average rainstorm volume for the whole province. During the study, the minimum number of rainstorm days was one day and the maximum number of rainstorm days was 11 days. In terms of the rainstorm days, the cumulative probability of rainstorm events is close to 1. The intensity of rainstorm in Dandong is approximately 50 to 160 mm d−1, the maximum rainstorm intensity is 1,588 mm d−1, and the cumulative probability is close to 1.
3.2. Joint cumulative probability analysis
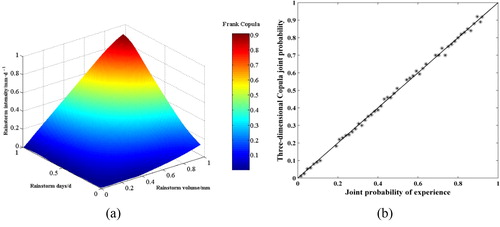
On the basis of determining the marginal distribution function of three elements of rainstorms in Dandong, three common Copula joint functions were constructed, and a goodness of fit test was performed with Root Mean Square Error (RMSE), Akaike Information Criterion (AIC), and Squared Euclidean Distance (SED). The results show that the Frank Copula function fits the joint probability of the three elements of rainstorms at the Dandong station the best ( and ).
Table 4. Multi-factor edge distribution and its parameters of rainstorm in Dandong station.
Table 5. Through the RMSE, AIC, and SED, the Copula joint function is determined for the multi-elements of rainstorm in Dandong station.
shows that the three-dimensional Copula combined cumulative probability density distribution is near the 45° line, which achieves a better degree of fit. This shows that the Frank Copula function is very suitable for the 3D Copula joint analysis of the Dandong station. When Copula values are between 0 and 0.4, the main factor of joint cumulative probability is the rainstorm volume. This shows that the effect of rainstorm volume on the Copula probability of Dandong is greater than the other factors in this scenario. In general, the Copula values increase with the cumulative probability of marginal distribution of each rainstorm element, which agrees with the objective situation of cumulative probability distribution. When (X, Y, Z) are closer to (1, 1, 1), the Copula value increases closer to the range of 0.9–1. The (X, Y, Z) elements are large, but the Copula value is relatively small, indicating that the corresponding joint probability is low when the three elements of the rainstorm are high. When the Copula value is between 0 and 0.4, the number of rainstorm days and the amount of rainstorm volume at this time are both greater than 0.5 and are even close to 1, but the intensity of rainstorm does not exceed 0.4. This demonstrates that the intensity of the rainstorm is more significant for the comprehensive characteristics of rainstorm events in the Dandong area during years when the number of rainstorm days is small and the amount of rainstorm volume is low. This shows that the intensity of rainstorm is more important for the comprehensive characteristics of rainstorm events in years when the number of rainstorm days is smaller and the amount of rainstorm volume is less in Dandong. In this case, a smaller value of storm intensity is required to maintain the Copula probability balance. The nonsynchronism, which is shown by the Dandong area, represents the amount of rainstorm volume in one year, the large number of rainstorm days, and the lower intensity of rainstorm.
Figure 4. The cumulative probability of the three-dimensional Copula in the Dandong. (a) The multi-element Copula joint cumulative probability distribution map of rainstorm in Dandong station; (b) The multi-factor empirical joint probability of rainstorm in Dandong station and Copula joint probability distribution map.
There are 22 sites in the study area, and we analysed all the sites during the study. Considering the limitation of manuscript space, this paper only lists the selection of the rainstorm elements in other sites () and Copula function ().
Table 6. Spearman dependency tests for district rainstorm elements.
Table 7. Copula three-dimensional joint function establishment and inspection in Liaoning Province.
3.3. Probability of joint return period occurrence
Using the Dandong station as an example, we compared the joint return period and the single element return period for different return periods. As shown in , the combined return period of the three elements of rainstorms is less than the single element return period. Considering a single-factor return period of 10 years as an example, the return period with the number of rainstorm days over 3.17 d is over 10 years, and the return period is 10 years when the rainstorm volume and rainstorm intensity reach 248.30 mm and 76.77 mm d−1, respectively. The joint return period means that the return period of one or more of the above three elements is exceeded; that is, the maximum probability of recurrence. When a single-factor 10 years return period is given, the joint return period of rainstorm elements is 7.67 years. The joint return period is much smaller than the single element return period. With the increase in the single factor return period, the joint return period also showed an increasing trend. The maximum single-factor appears as a small probability event, often corresponding to a longer return period. For a Copula joint multi-element rainstorm, the return period was significantly reduced. For instance, when the single-factor return period is 100 years, the joint return period is reduced to 46.87 years. The multi-factor syndication information is more abundant than the single element recurrence information. The Copula multi-dimension joint function is of great significance for the joint probability and joint return of multi-factor analysis of rainstorms over human time scales. It helps human to understand the regularity of rainstorm more scientifically.
Table 8. Return period of rainstorm elements in Dandong station under different scales.
Due to the scientific and practical significance of joint recurrence for the study of rainstorm and the joint return period for different scales of the Liaoning Province, we considered the theoretical spatial distribution of rainstorm events in the Liaoning Province for different return periods. This provides a better reference for the occurrence of rainstorm events. In the study, the 5-year return period for the return period analysis is taken as an example. It is mainly considered that the 5-year analysis period is comparatively short, and the results of this research can be verified in the short term, as opposed to 10-year and 20-year, the 50-year return period forecast is more convincing and accurate. Therefore, the 5-year return feature is selected as an example. Using the spatial distribution map of 5-year joint return as an example (), the areas with high frequency rainstorm events were a small part of the southern Dalian, Dandong, Yingkou, most of Chaoyang and southwestern Huludao. In the central and northern Liaoning, rainstorm occurred in most parts of the city that have a longer return period, with a lower probability of rainstorm. Among them, the lowest recurrence rates of rainstorm were in south of Chaoyang, which indicates that in the next five years, the highest probability of rainstorm will be in southern Chaoyang.
Figure 5. Spatial distribution of occurrence probability of rainstorm events under different joint return periods. (a) Under the 5-year return period, the probability of rainstorm in various regions of Liaoning Province; (b) Under the 10-year return period, the probability of rainstorm in various regions of Liaoning Province; (c) Under the 20-year return period, the probability of rainstorm in various regions of Liaoning Province; (d) Under the 50-year return period, the probability of rainstorm in various regions of Liaoning Province.
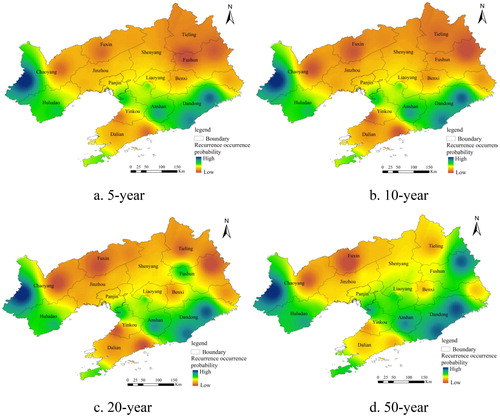
As shown in , the probability rainstorm in the Liaoning Province will occur in the next 5, 10, 20, and 50 years. The value of the return period basically shows a pattern in which ‘the central region is higher while the eastern and western regions are lower’. This means that the probability of rainstorm in the central region of the Liaoning Province is relatively low and heavy rainstorm occur frequently in the eastern and western regions. Thus, in the future, special attention should be paid to low-value areas such as southern Chaoyang, southern Huludao, Anshan and Dandong for rainstorm disaster prevention and mitigation work. Rainstorm in these areas have a short return period and high frequency, but rainstorm in other areas have a longer return period, so the frequency of rainstorm is relatively low.The occurrence frequency of rainstorm in the given 10-year return period is higher than in the given 5-year return period, and the low-value areas are almost the same. However, the areas with frequent rainstorm in southern Dalian have expanded. The spatial characteristics of the occurrence probability of rainstorm events during the 20-year return period show that the western part of Fushun has become a rainstorm prone area, and the rainstorm features in the Dandong area are more obvious. For a joint return period of 50 years, the rainstorm areas in northwestern Fushun, Dandong, Anshan, Yingkou, southern Dalian, Huludao and western Chaoyang are heavily affected by rainstorm events; rainstorm events in southern Liaoyang and Benxi also occur frequently.
3.4. Rainstorm agricultural disasters and recurrence probability
The main purpose of this study is to predict the time and probability of rainstorm events in the combination of a certain heavy elements in the future, which will scientifically guide the local agricultural production and reduce the losses caused by rainstorm events to agricultural development. When analysing and handling rainstorm events and coping with the adverse effects of rainstorm, the spatial characteristics of the return period using the multi-factorial combination of rainstorm factors in the Liaoning Province that were obtained from meteorological data should be considered; besides, we need to comprehensively understand the spatial characteristics of rainstorm return period in the Liaoning Province from the perspective of nature and humanities to obtain a more accurate understanding of rainstorm in various cities of the Liaoning Province in a scientific and rational manner. Excessive rainstorm, frequent rainstorm and excessive water flow lead to impactful hazards, water logging hazards and floods, affecting crop growth and impacting large-scale crop production (even through crop failure), posing a threat to agricultural production and human safety.
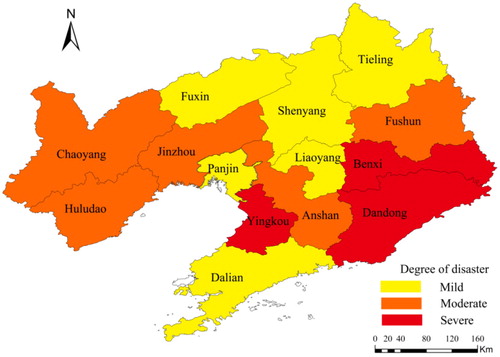
The data of agricultural losses caused by rainstorm between 1991 and 2011 were compiled, from the Meteorological Disaster Data (http://data.cma.cn) in the Liaoning Province (). Due to the different sizes of the cities, the extent of agricultural land is not the same. The area of crops affected by rainstorm refers to the sown crop acreage in which more than 10% of crop losses were caused by rainstorm (where percentage affected is equal to the affected area divided by the area of crops sown), both of which are affected by the area of municipal administrative units. It is unfair to judge the severity of the rainstorm that was affected only by them. However, to standardise the affected degree, standardisation was completed on the basis of the various influencing factors. This allowed us to assess the different degrees of damage in different cities. As such, according to the degree of damage in the Liaoning Province, the city damage analysis is shown in .
Table 9. Agricultural meteorological disasters caused by rainstorm in Liaoning Province during 1991–2011.
Figure 6. Distribution of agricultural production affected by rainstorm in Liaoning Province.
According to the spatial distribution of the probability of rainstorm at each site under different return periods shown in , because of the limitations of the current data and related research techniques, the long-term prediction accuracy remains unclear. Therefore, when combining the recurrence probability of agricultural damage from rainstorm over a 20-year return period from the perspective of an urban area, the frequency of rainstorm in cities and towns in the Liaoning Province is shown in .
Figure 7. Under the 20-year return period, probability distribution maps of rainstorm events in various cities of Liaoning Province.
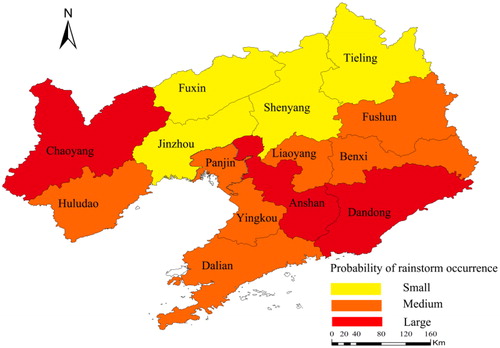
The occurrence of rainstorm events is mainly affected by natural conditions, so the study discriminates the probability of rainstorm in Liaoning Province under over medium-long term (20-year) scales combined with the rainstorm damage degree in every city of the Liaoning Province, starting from two perspectives of natural and humanistic factors. The agricultural risk of rainstorm in the entire province over the next 20-year is analysed. The probability of rainstorm in each city is superposed with the degree of disaster under the influence of rainstorm to obtain more realistic and instructive risk characteristics for rainstorm events in the Liaoning Province. The risk level of rainstorm on agriculture in the province is divided into 5 levels (), and the partition basis is shows in .
Figure 8. Agriculture risk characteristics of rainstorm in various cities in Liaoning Province.
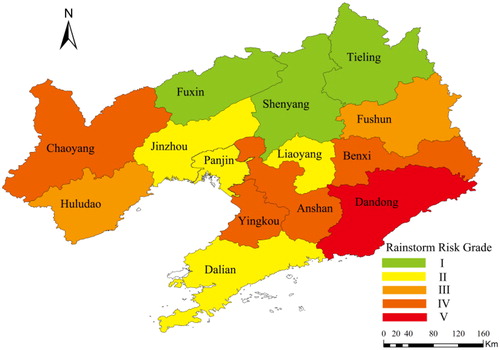
Table 10. Rainstorm agricultural risk level.
Different cities are assigned to different levels: level I (Fuxin, Shenyang, Tieling), level II (Dalian, Jinzhou, Panjin, Liaoyang), level III (Huludao, Fushun), level IV (Chaoyang, Yingkou, Anshan, Benxi, and level V (Dandong). Dandong, Chaoyang, Yingkou and Benxi have a high rainstorm risk level, key areas for agricultural planting in each city can be protected, built and the areas of planting can increase rainstorm prevention and control based on forecasting rainstorm, which could be a better solution for the rainstorm. Fuxin, Shenyang and Tieling cities have the lowest rain level because of their northern-inland geographic position. The rainstorm risk level is relatively low, so people can develop and utilise precipitation to supplement industrial and agricultural water during the dry season and improve the water resource utilisation efficiency. The Huludao, Jinzhou, Panjin, Liaoyang, and Dalian municipalities with levels II and III are mainly distributed along the coasts of the Bohai Sea. The regulatory role of the oceans for regional microclimates and the urban development level may result in the decrease in the degree of crop disasters. For example, although the sown area is not large in Dalian, urban development is mainly industrialised with less agricultural land. Although rainstorm occurs frequently, the agricultural damage due to rainstorm is also less. Therefore, the risk level of rainstorm is lower. Taking into account both the natural and the social factors that are affected by the rainstorm, we have scientifically assessed the agricultural risk level of rainstorm in the entire province and have provided a scientific basis for rainstorm risk characteristics for disaster prevention and mitigation by relevant departments in each city, which is conducive to the harmonious development of people and society.
4. Discussion
From August 2, 2017 at 20:00 pm to August 5 at 8:00 am, the Liaoning Province experienced rainstorm. Until August 7th, the rainstorm caused significant damage to Dalian, Anshan, and Dandong, and 7 other cities and 22 counties. The 713,800 people and 94,500 hectares of crops were affected by the disaster, 335 roads were destroyed, and the direct economic loss reached 0.8 billion yuan. Using statistics of the related rainstorm factor data for Chaoyang between August 2nd and August 5th, the amount of rainstorm volume that fell in Chaoyang reached 503 mm. The rainstorm lasted 4 days, and the intensity of the rainstorm reached 125 mm d−1. According to this information, with the aid of the joint return period that the storm event occurred in Chaoyang, the theoretical joint return period should be approximately 3 years, and the return period is very short. In the next 3 years, disaster prevention departments should be enhanced to respond and prevent the effects of severe weather storms in advance, reducing losses and risks.
When we use Copula functions to join, the first step is to measure correlation. Commonly used correlation measurement coefficient of Copula functions includes four types, which are Kendall rank correlation coefficient, Spearman rank correlation coefficient, upper tail correlation coefficient and lower tail correlation coefficient. The reviewer proposes that in the extreme analysis, more consideration is given to the upper rank–rank correlation coefficient, so in the study, we take into account the Copula functions with a tail symmetric structure and the Copula functions without a tail symmetry structure. In this article, the correlation coefficient of five common Copula functions is tested. The Spearman rank correlation coefficient of various Copula functions is measured, and then Frank Copula function is selected for joint analysis. We use different Copula functions to combine the rainstorm factors of all sites in Liaoning Province. Taking rainstorm volume amount 250 mm, rainstorm days 3 d and rainstorm intensity 83 mm d−1 as example, the theoretical return recurrence period and actual return period under the given rainstorm combination are verified by comparison and verification (). Therefore, after considering the tail rank correlation, the suitable Copula functions is selected to combine the multiple elements of the rainstorm in each site. There is a huge difference between the theoretical return period and the actual return period. In comparison, Frank-Copula is the most suitable one for the multiple elements of Dandong station rainstorm combined with the Copula, because the error rate is the smallest.
Table 11. Comparison of theoretical return periods and actual return periods of different Copula functions for rainstorm elements.
This paper is only used for a comparative analysis in the Liaoning Province. If the Copula joint functions is introduced into a larger area, whether the copula function is suitable and the probability of rainstorm will need to be studied further. This study is somewhat monotonic in the analysis of the cumulative probability distribution and joint return of multi-element Copula, and should look for scientific method validation results from the comparison between the return period of the joint return and the actual rainstorm events. This will lay the foundation for the promotion and the use of the joint return period. On the other hand, in this study, the risk characteristics of rainstorm in the Liaoning Province were analysed by combining the occurrence probability of multi-factor rainstorm events with the agricultural losses caused by torrential rainstorm. The combination of theory and practice provides some guiding practical significance.
If we consider the social and economic losses caused by rainstorm in urban areas in future research, the results will become more realistic. In addition, this paper does not make any reasonable suggestions for cities at different risk levels to address the rainstorm events. In the future, we can also provide appropriate advice for the prevention and control of rainstorm disasters on the basis of natural and social factors in each city, providing reasonable advice.
For the analysis of Copula joint probability and recurrence period of rainstorm elements at various stations in the Liaoning Province, we divided districts based on the consideration of topography and moisture characteristics, and then analysed the stations with good correlation through the correlation between various elements. In the future research, more appropriate research methods can be sought for the joint analysis of multiple elements of rainstorm on other sites not selected, so as to more accurately and comprehensively grasp the characteristics of rainstorm in the Liaoning Province.
The risk characteristics of rainstorm agriculture in the Liaoning Province are analysed by combining the probability of multiple elements of rainstorm in the recurrence period with the agricultural losses caused by rainstorm. If future studies can take into account the social and economic losses caused by the rainstorm in the city, the research will be more instructive. In addition, after obtaining the risk characteristics of rainstorm agriculture in the Liaoning Province, this study did not put forward reasonable Suggestions on how to deal with rainstorm in cities with different risk levels. In the future, in case of severe rainstorm, the natural and social factors of each city can also be taken into account to put forward specific and reasonable suggestions on prevention and control of rainstorm disasters.
5. Conclusions
The mainly conclusions of this study are:
Using the Dandong station as an example and adopting the Copula functions to joint analyse the three elements of rainstorms, which demonstrated that the Generalised Extreme Value Distribution can accurately describe the marginal distribution of the number of rainstorms and rainstorm intensity. The marginal distribution of rainstorm days coincides with the Gamma function. Through the use of RMSE, AIC, and the SED goodness of fit test illustrated that the Frank Copula functions is the most suitable joint function for simulating the combined distribution of rainstorm in Dandong.
The combination of multiple factors of rainstorm are less than the return period based on a single factor, and the degree of accuracy of the joint return period is higher than that of the actual situation. The Copula multi-dimensional joint function enables strong practicability for the joint probability and recurrence of multi-elements in detecting torrential rainstorm. It was shown that during periods of 5, 10, 20, and 50 years, the occurrence probability of rainstorm in the province according to the pattern ‘the central region is higher, while the eastern and western regions are lower.’ This means that the probability of rainstorm in the middle part of the province is low, and rainstorm events occur frequently in the east and west. When the combined return period is 5 years, a high frequency of rainstorm occurs in the south Dalian, Dandong, Yingkou, and the southwest areas of Chaoyang and Huludao. At the same time, the occurrence probability of rainstorm in the middle and north parts of the province are low. Among them, the lowest number of combined return periods in the southern Chaoyang area indicates that the occurrence probability of rainstorm events the highest in the next five years.
In this study, the agricultural risk grades were divided into 5 levels from level I to level V. The lowest level, level I, includs Fuxin, Shenyang, and Tieling; level II includs Dalian, Jinzhou, Panjin, and Liaoyang; level III includs Huludao and Fushun; level IV includs Chaoyang, Yingkou, Anshan, and Benxi; and level V includs Dandong.
Acknowledgements
We acknowledge the use of data from the National Meteorological Information Centre of the Chinese Meteorological Administration (http://cdc.nmic.cn).
Disclosure statement
No potential conflict of interest was reported by the authors.
Additional information
Funding
Related Research Data
References
- Amirataee B, Montaseri M, Rezaie H. 2018. Regional analysis and derivation of copula-based drought severity-area-frequency curve in Lake Urmia basin, Iran. J Environ Manage. 206:134–144.
- Brooks H, Stensrud D. 2000. Climatology of heavy rain events in the United States from hourly precipitation observations. Mon Wea Rev. 128(4):1194–1201.
- Chrysoulakis N, Kamarianakis Y, Xu L, Mitraka Z, Ding J. 2008. Combined use of MODIS, AVHRR and radiosonde data for the estimation of spatiotemporal distribution of precipitable water. J Geophys Res Atmos. 113:D05101.
- Feng J, Li N, Zhang Z, Chen X. 2017. The dual effect of vegetation green-up date and strong wind on the return period of spring dust storms. Sci Total Environ. 592:729–737.
- Feng Y. 2018. Temporal and spatial distribution of rainstorm and probability analysis of recurrence period in Liaoning Province. Liaoning: Liaoning Normal University. (in Chinese).
- Hu H. 2016. Rainstorm flash flood risk assessment using genetic programming: a case study of risk zoning in Beijing. Nat Hazards. 83(1):485–500.
- Huang C. 2015. Exploration on the basic principles of dynamic risk analysis in natural disasters. J Catastrophol. 30(2):1–7. (in Chinese).
- Intergovernmental Panel on Climate Change. 2014. Climate change 2014: impacts, adaptation, and vulnerability. Cambridge: Cambridge University Press.
- Kokilavani S, Selvi R, Panneerselvam S, Dheebakaran G. 2017. Trend analysis of rainfall variability in western agroclimatic zone of Tamil Nadu. Curr World Environ. 12(1):181–187.
- Li Y, Gu W, Cui W, Chang Z, Xu Y. 2015. Exploration of copula function use in crop meteorological drought risk analysis: a case study of winter wheat in Beijing, China. Nat Hazards. 77(2):1289–1303.
- Mandal S, Srivastav R, Simonovic S. 2016. Use of beta regression for statistical downscaling of precipitation in the Campbell River basin, British Columbia, Canada. J Hydrol. 538:49–62.
- Modarres R, Sadeghi S. 2018. Spatial and temporal trends of dust storms across desert regions of Iran. Nat Hazards. 90(1):101–114.
- Nelsen R, Quesada-Molina J, Rodrı́guez-Lallena J, Úbeda-Flores M. 2001. Distribution functions of copulas: a class of bivariate probability integral transforms. Stat Probab Lett. 54(3):277–282.
- Palizdan N, Falamarzi Y, Huang Y, Lee T. 2017. Precipitation trend analysis using discrete wavelet transform at the Langat River Basin, Selangor, Malaysia. Stoch Environ Res Risk Assess. 31(4):853–877.
- Park BU, Simar L, Zelenyuk V. 2015. Categorical data in local maximum likelihood: theory and applications to productivity analysis. J Prod Anal. 43(2):199–214.
- Ran L, Li N, Jiao Y, Jiao B, Zhang L. 2019. Deformation characteristics of the “7.20” heavy rainfall event in North China. Atmos Oceanic Sci Lett. 12(1):21–29.
- Shao D, Liu G. 2018. Up-to-date urban rainstorm intensity formulas considering spatial diversity in China. Environ Earth Sci. 77(14):541.
- Shao M, Gong Z, Xu X. 2014. Risk assessment of rainstorm and flood disasters in China between 2004 and 2009 based on gray fixed weight cluster analysis. Nat Hazards. 71(2):1025–1052.
- Sklar A. 1959. Fonctions de repartition an dimensions etleurs marges. Publications de L’Institut de Statistique de L’Université de Paris. 8:229–231.
- Smith K. 1996. Environmental hazards: assessing risk and reducing disaster. 2nd ed. New York: Routledge.
- Wang C, Ren X, Li Y. 2017. Analysis of extreme precipitation characteristics in low mountain areas based on three-dimensional copulas-taking Kuandian County as an example. Theor Appl Climatol. 128(1–2):169–179.
- Wang C, Ren X, Li Y, Guo E. 2015. Analysis of the rainstorm disaster risk in Liaoning Province based on PPD model. J Catastrophol. 30(1):217–220. (in Chinese)
- Wu H, Qian H. 2017. Innovative trend analysis of annual and seasonal rainfall and extreme values in Shaanxi, China, since the 1950s. Int J Climatol. 37(5):2582–2592.
- Wu Y, Zhong P, Zhang Y, Xu B, Ma B, Yan K. 2015. Integrated flood risk assessment and zonation method: a case study in Huaihe River basin, China. Nat Hazards. 78(1):635–651.
- Xiao T, Wang Y, Zhao Y, Jing F, Zhan Z, Wang L, Fan J, Gan W, Yang X, Fang Y. 2017. The hazard risk assessment of regional heavy rainfall over Sichuan basin of China. Nat Hazards. 88(2):1114–1155.
- Yang L, Jiang D, Wang Y, Cai K, Sun L. 2017. Analysis on multi-scale characteristics of a torrential rainstorm in Liaoning Province on 16 August 2013. J Arid Meteorol. 35(2):267–274. (in Chinese).
- Yao L, Zhao S, Zhao C, Zhou B, Zhang J, Xue F. 2010. Temporal and spatial distribution of hourly rain intensity and recurrence periods in Eastern and Central China. Acta Geographica Sinica. 65(3):293–300. (in Chinese)
- Zamani R, Mirabbasi R, Nazeri M, Meshram S, Ahmadi F. 2018. Spatio-temporal analysis of daily, seasonal and annual precipitation concentration in Jharkhand state, India. Stoch Environ Res Risk Assess. 32(4):1085–1097
- Zhao J, Xu J, Li X, Zhong Y, Han D, Qiu H. 2017. Characteristics analysis of spatial and temporal variation on extreme weather events in Anhui Province for recent 50 years. Nat Hazards. 89(2):817–842.