
 ?Mathematical formulae have been encoded as MathML and are displayed in this HTML version using MathJax in order to improve their display. Uncheck the box to turn MathJax off. This feature requires Javascript. Click on a formula to zoom.
Abstract
In the majority of small urban catchments, there is a problem with obtaining precipitation data necessary for hydrological applications and analyses in the scope of assessing flood risk. One of the means of measuring rainfall depth is to make use of weather radar technology, which provides information on the spatial and temporal distribution of rainfall in a catchment. In the work, the dependency between radar reflectivity (Z) and rainfall rate (R) was determined on the basis of a few events measured at two precipitation stations located in the Służewiecki Stream catchment in Warsaw, Poland. Making use of the Z-R relationship as well as values of radar reflectivity, the amount of rainfall for the analysed event was calculated and compared with the amounts of rainfall measured using rain gauges. Relatively good compatibility between the rainfall totals was obtained for the majority of events. Rainfall depths obtained for two selected events on the basis of data from the weather radar were applied to simulate flows in the analysed catchment using the SWMM (Storm Water Management Model) hydrodynamic model. Values of the relative error calculated on the basis of measured flows and flows calculated in reaction to rainfalls estimated using the Z-R relationship were, in the majority of cases, lower than 25%. Simulations carried out on the SWMM model for a few rainfall scenarios in response to rainfall depth measured at precipitation stations and estimated on the basis of radar data revealed the possibility of the occurrence of flooding in the catchment as a result of the overflow of rainfall collectors.
1. Introduction
One of the main stages in hydrological analyses is establishing various characteristics of model-based rainfall, including the temporal and spatial distribution of rainfall in a catchment. Variability of rainfall depth in the area of the catchment can have a strong influence on the values of simulated flows in the given catchment, especially if hydrological analyses are carried out in an urban catchment where individual subcatchments differ in their degree of urbanization (share of impermeable surfaces and equipped with a storm sewer).
In the majority of small catchments, rainfalls are not measured, and if they are measured using rain gauges (usually electronic tipping-bucket rain gauges), problems with their application for hydrological analyses often occur, due to the insufficient amount of rainfall stations or breaks in measurements caused by failures. Applying data registered at precipitation stations as input data for hydrological models requires, in the majority of cases, the spatial interpolation of rainfall data (Jatho et al. Citation2010). Licznar et al. (Citation2005) draw attention to problems connected with obtaining rainfall data for the realization of tasks connected with the design and use of urban drainage systems, especially in reference to the RTC (Real Time Control) System of directing runoff, commonly implemented abroad. They indicate that making use of rainfall data from weather radars is an alternative to applying a network of rain gauges in RTC systems. It is inevitable for urban hydrology to have access to information on rainfall with spatial resolution ranging up to 100 m (Jakubiak et al. Citation2014).
The demand for a better understanding of hydrological processes at different spatial scales requires the application of more integrated and advanced techniques of rainfall detection and estimation rather than applying data from conventional networks of ground-based rain gauges only. Responding to this growing demand, the quantitative precipitation estimates derived from weather radar technology can be used both in operational hydrology as well as in particular case studies (Somorowska Citation2012). Increasing use of radar data for hydrological applications, due to the sparse distribution of rain gauges in the majority of catchments, requires expanding on knowledge regarding the uncertainty of these data (Peleg et al. Citation2013).
One of the most important benefits of measuring rainfall with the use of radar is the spatial continuity of observations. Information obtained on the basis of weather data provides the most detailed information in regards to the spatial and temporal distribution of rainfalls (Mittermaier Citation2008). These features potentially improve the simulation and forecasting of stream flows (Yang et al. Citation2004; Atencia et al. Citation2011; Berne and Krajewski Citation2013; Abon et al. Citation2016). The main flaw of radar-based observations is the imprecision of obtained rainfall data, which results from the fact that it is an indirect measurement. A classic radar measures reflectivity, which, on the basis of a determined relationship, is recalculated into rainfall rate or total (Moszkowicz and Tuszyńska Citation2006). Continuous progress is noted in forecasting rainfall rate using weather radars and rainfall data processing systems, although much work remains to be done as far as the quality of the estimation of the field of rainfall and its forecasts are concerned (Szturc et al. Citation2016).
In the present work, the relationship between radar reflectivity Z measured using a weather radar and rainfall rate R was determined on the basis of a few events measured at two precipitation stations located in the Służewiecki Stream catchment in Warsaw. On the basis of the established Z-R relationship, the rainfall depth was calculated for the analysed events in relation to the value of radar reflectivity. The aim of this analysis was to determine a new Z-R relationship which offers better rainfall rate estimation in the investigated catchment as compared to that of Marshall–Palmer. The Institute of Meteorology and Water Management – National Research Institute (which carries out measurements in Poland using radars) uses a Z-R relationship determined by Marshall–Palmer to formulate the SRI (Surface Rainfall Intensity) product, which presents a picture of rainfall intensity R in a layer characterized by a constant height above the surface of the ground. Rainfall totals for 10 events which were estimated on the basis of the Z-R relationship established in this work as well as obtained directly from the SRI product were compared with corresponding data measured using rain gauges at the Okęcie and Ursynów precipitation stations. Compatibility assessment of the rainfall totals for the analysed events was carried out with the use of values of relative error. The aim of this analysis was to determine whether rainfall data obtained from the generally available SRI product allows for obtaining an accepted level of agreement with ‘true rainfall’ and, at the same time, whether developing a new Z-R relationship was validated.
Rainfall depths calculated in these analyses as well as established on the basis of the SRI radar product for two selected events were applied for simulating flows in the analysed catchment using the SWMM hydrodynamic model. In calculations carried out according to four various scenarios, rainfalls obtained, among others, on the basis of radar data for two pixels in the area of the catchment (corresponding to the location of the precipitation stations) as well as 66 pixels covering the area of the catchment (each of them was assigned a rain gauge in the SWMM model) were applied. The values of calculated flows were compared with flows measured in two cross-sections of Służewiecki Stream. Next aim of this analysis was to obtain information on whether the methods applied to estimate rainfall depths for the analysed events make it possible to obtain simulation errors for parameters of the hydrograph of flows lower than the assumed limit value of the relative error equal to 25%. Another aim of the studies was to determine the influence that applying rainfall depths estimated on the basis of radar data for merely two existing rain gauges as well as 66 virtual rain gauges in the catchment has on the values of simulation errors of hydrograph parameters; in other words, determining whether accounting for spatial variability of rainfall in a catchment more precisely by applying radar data for 66 virtual rain gauges has a significant effect on increasing the accuracy of simulating flows. A further aim of the study was obtaining information on which of the methods applied to estimate rainfall depths (on the basis of the SRI product or on the basis of Z-R relationship established in this work) allows for a higher accuracy to be obtained between measured and calculated maximum flows of hydrograms. The SWMM model was also used to analyse water levels in one of the main rainfall collectors in the area of the analysed catchment for four scenarios in response to the rainfall depth measured using rain gauges and determined on the basis of radar data, which aimed to assess the possibility of the occurrence of flooding in the catchment.
2. Materials and methods
2.1. Study area description
The Służewiecki Stream catchment is located in the southern part of Warsaw, Poland (). The area of the catchment, to the outfall in Wilanow Lake, is 55.2 km2. Służewiecki Stream, in the stretch from its source to its outlet from the area of the F. Chopin airport (above calculation cross-section No. 2), is closed along nearly the entire length, but is an open channel in the remaining segment. The total length of the watercourse is 15 km, with a slope of 1.6%. The slopes of terrain in the catchment are usually less than 1%. Areas of residential, commercial and transportation development comprise approximately 67% of the total surface of the catchment.
Figure 1. Drainage system in Służewiecki Stream Catchment in Warsaw (source: Barszcz Citation2018 and re-drawn by author). Calculation cross-sections and precipitation stations: 1 – Rosoła, 2 – Kłobucka, 3 – Okęcie, 4 – Ursynów.
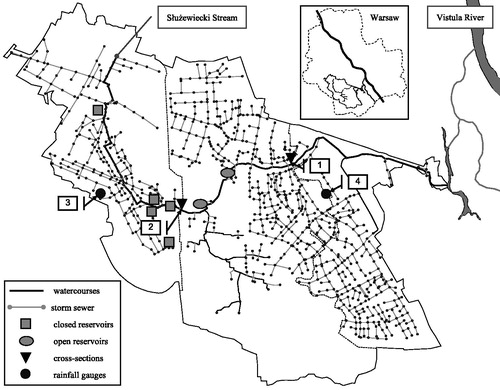
Storm water is usually redirected from the surface of the Służewiecki Stream Catchment by an extensive sewer system. The catchment contains surface retention reservoirs, underground closed retention reservoirs (located in the area of the airport with a total retention volume of 42,490 m3) and road culverts, which have a large influence on the transformation of flows in the watercourse.
The analysis uses rainfall events registered at two stations, i.e. Okęcie and Ursynów (). The first of them is controlled by the Institute of Meteorology and Water Management – National Research Institute in Warsaw, while the second – by the Department of Water Engineering at the Warsaw University of Life Sciences in Warsaw. The measurements of rainfalls were carried out using electronic tipping-bucket rain gauges.
Marked in are the locations of the two calculation cross-sections of flows in Służewiecki Stream, i.e. Rosoła (4 + 910 km) and Kłobucka (8 + 650 km), which function, at the same time, as water gauge cross-sections (installed under research project COST/210/2006). The areas of subcatchments for these cross-sections amount to 43.0 and 16.5 km2, respectively. The measurements of water levels were carried out using electronic sensors of the ‘Diver’ type.
2.2. Adaptation of hydrodynamic model to the analysed catchment
The SWMM (Storm Water Management Model) in version 5.0.022 developed by the U.S. Environmental Protection Agency (EPA) was used to simulate flows in Służewiecki Stream in response to rainfalls measured at precipitation stations as well as established on the basis of radar data, while considering the various classification criteria of the models. SWMM is considered among the dynamic, genetic, nonlinear components of the catchment, also for models with complex parameters. The model is characterized by a large number of parameters, which are mainly physically measurable characteristics of the catchment and hydrometeorological conditions. An extensive description of the model can be found in the manual (Rossman Citation2010), but also in the scientific publications of various authors (Peterson and Wicks Citation2006; Park et al. Citation2008; Barszcz Citation2015).
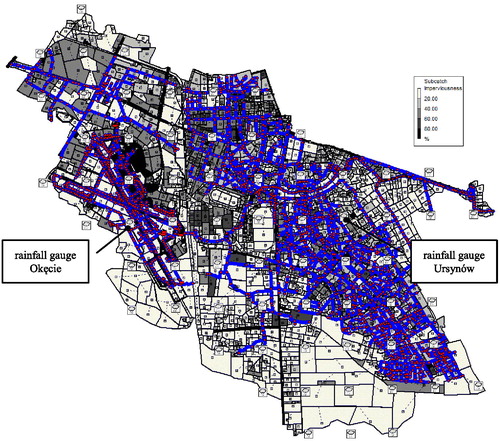
Application of the SWMM model for the present analysis required its adaptation for the given Służewiecki Stream Catchment. Adaptation involved creating objects in the model which represent the physical elements of the actual catchment sewer system and system of rain gauges – actual and virtual (), and next, determining the relationship between them and the values of their parameters. In order to assess and identify the parameters of the objects in the model, the authors used characteristics of real objects measured in field and identified based on the available studies, as well as values of parameters recommended in the tables of the manual (Rossman Citation2010).
Figure 2. Objects of the catchment sewer system (subcatchments, channels) and rain gauges (existing: Okęcie and Ursynów, virtual – 66 objects) in the SWMM model (source: Barszcz (Citation2018) and re-drawn by author).
The hydrological procedure of the model is based on a set of subcatchments, in which the rainfall being the input data to the model is transformed into surface runoff. Surface runoff is calculated in the SWMM model from Manning`s equation. The values of the roughness coefficient for impervious and pervious surfaces occurring in this equation were found to be, in most cases, equal to 0.012 and 0.15 s·m−1/3, respectively. Manning’s roughness coefficient for conduits was assumed to be 0.011 s·m−1/3, whereas for open channels – in a range between 0.025 and 0.05 s·m−1/3. The dynamic wave model (uses the Saint–Venant equation) was selected from three possible options in the SWMM model (‘steady flow’, ‘kinematic wave’ and ‘dynamic wave’) in order to calculate the transformation of flows in the hydraulic system of the catchment. The average surface slopes (ranging from 0.75% to 2.5%) for individual subcatchments were determined based on data obtained from a numerical terrain model in the ASCII XYZ GRID data format with resolution of 1 m.
The SWMM model for the analysed catchment accounted for the following objects:
Rain gauges in existing precipitation stations – Okęcie and Ursynów (two rain gauges); the time resolution of rainfall from precipitation stations was 10 min.
Virtual rain gauges, which were assigned to 64 pixels (cells on the map of radar data with a surface area of 1 km2) covering the area of the catchment (64 rain gauges).
Subcatchments (areas), which were distinguished in the catchment in order to account for the spatial differentiation of the modelled hydrological processes (3392 subcatchments); the main criterion for dividing the catchment into subcatchments was the consistent nature of terrain use and the percentage of impervious surfaces connected with it.
Open channels (watercourses/ditches) and storm sewer pipelines (2272 channel segments); ordinates for cross-sections in open channels were determined based on field measurements with the use of GPS receivers in the work making use of corrections (DGPS measurements) and devices for ground levelling, whereas the characteristics of the closed channels (ordinates, distances, etc.) were determined based on data from a detailed technical map.
Road culverts and bridges; the characteristics of such objects were established on the basis of field measurements.
Retention tanks (open and closed) and lakes; their characteristics were established on the basis of the available technical documentation.
Return flaps on the outlets of rain channels, outlet and spillway devices of tanks, and pumps and valves working with the tanks.
2.3. Radar data processing
The result of measurements carried out using weather radars in the assumed units of time is radar reflectivity. As a result of processing the reflectivity value registered by the radar, different meteorological and hydrological products are obtained. One of these products is the SRI (Surface Rainfall Intensity), which presents a picture of the rainfall rate R, expressed in units mm·h−1, in the layer characterized by a constant altitude over the land surface (Moszkowicz and Tuszyńska Citation2006).
Currently, the Institute of Meteorology and Water Management – National Research Institute in Warsaw, which carries out measurements in the area of Poland with the use of radars, when calculating precipitation (rainfall) rate R on the basis of registered radar reflectivity Z, makes use of relationship (1) – presented in inverse order, i.e. expressing Z by R, based on a and b coefficients determined by Marshall and Palmer (Citation1948), which equal 200 and 1.60, respectively (Moszkowicz and Tuszyńska Citation2006).
(1)
(1)
…where Z is radar reflectivity (mm6·m−3), R is the rainfall rate (mm·h−1) and a and b are constants.
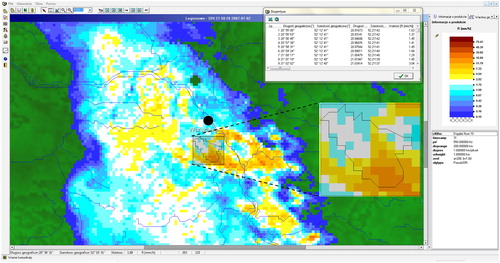
The present work uses SRI product maps for analysis, presenting a picture of the rainfall rate in the area within the range of the radar in Legionowo, in a layer located at an altitude of 1 km above the surface of the land. The values of rainfall rate were obtained for individual pixels (covering the area of the analysed catchment), the spatial resolution of which is 1 km2. The time step of data obtained on the basis of the SRI product (Surface Rainfall Intensity) was 10 min.
A specialized programme – RAPOK (developed at the Institute of Meteorology and Water Management – National Research Institute in Warsaw) was used to analyse the maps, making it possible to generate data in the form of a file compatible with the Microsoft Excel format. A layer picturing the area of the analyzed Służewiecki Stream Catchment was created and next imported into the program, making it possible to indicate the field limiting the range of radar data analysis (comprising 156 pixels). shows a sample map of the SRI product for one of the analysed rainfall events on 02 July 2007 at 9.50pm. The values of rainfall rate are described in the legend containing a scale of the colours along with the ranges of values of data assigned to them, as well as being presented in a table generated in the RAPOK programme.
Figure 3. SRI product and field indicating the range of data analysis covering the analysed catchment. Source: The Institute of Meteorology and Water Management - National Research Institute
Based on the values of rainfall rate R obtained from the SRI product for the analysed events in individual time steps of the duration of the rainfall, their corresponding values of radar reflectivity Z were calculated. The calculations were carried out on the basis of a relationship expressing Z by R (1), based on a and b coefficients determined by Marshall and Palmer, which equal 200 and 1.60, respectively.
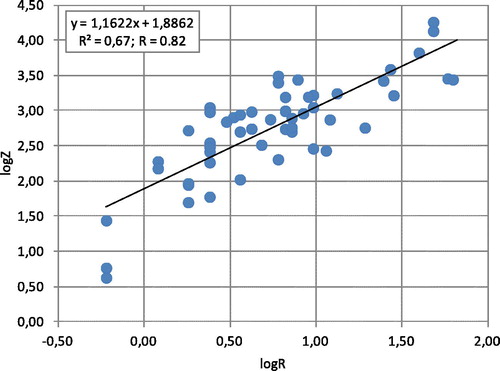
Values of radar reflectivity are calculated for two pixels in the area of the catchment (corresponding to the location of precipitation stations), and corresponding values of rainfall rate measured for the analysed events at the two precipitation stations were used to establish the statistical relationship Z-R and determine the values of parameters a and b. The studied relationship was obtained as a simple regression in a logZ and logR algorithmized variable system, assuming experimental data from precipitation stations in Okęcie and Ursynów for two independent analyses.
Based on the Z-R relationships (established based on data from the rainfall station in Ursynów) and radar reflectivity for 66 pixels (covering the area of the analysed catchment), the values of rainfall rate for two selected events in individual time steps of rainfall duration were calculated. These rainfall data were assigned to 66 rain gauges (at Okęcie and Ursynów precipitation measurement stations, as well as 64 virtual rain gauges located in each pixel) created in the SWMM model for the analysed catchment and applied for the simulation of flows.
3. Results and discussion
3.1. Radar reflectivity versus rainfall rate relationship
Values of radar reflectivity Z for pixels (on radar maps) corresponding to locations of precipitation stations and relevant values of rainfall rate R for 10 events measured at the Okęcie and Ursynów precipitation stations were used to determine two statistical Z-R relationships. Five events at each of the mentioned precipitation stations, for which both data measured using rain gauges and the weather radar were available, were chosen for the analysis. Rainfall depths for the analysed events varied (). They fell in the range of 8.6 to 52.6 mm, as well as 6.2 to 43.6 mm for rainfall events registered at the Okęcie and Ursynów precipitation stations, respectively. In respect to the events at the Okęcie and Ursynów precipitation station, the rainfall durations were between 50 and 480 min (value of median was 90 min), as well as 30 and 220 min (median was 100 min), respectively.
Table 1. Rainfall totals using data from rainfall gauges and weather radar.
Z-R relationships (2) and (3), determined, respectively, for the Okęcie and Ursynów precipitation stations, are characterized by respective correlation coefficients of 0.72 and 0.82 (the values of the determination coefficient amounted to 0.52 and 0.67, respectively). presents the relationship obtained as a simple regression in the logZ and logR algorithmized variable system on the basis of data for the Ursynów precipitation station. Further calculations were carried out on the basis of Z-R (3), in which the value of coefficients a and b are 77 and 1.16, respectively. The significance test of the correlation coefficient confirmed that this relationship is statistically significant. The value of the F ratio of explained variance to unexplained variance amounted to 101.60, with the critical value of F amounting to 4.04 at a 0.05 level of significance of and degrees of freedom equal to 1 and 51.
(2)
(2)
(3)
(3)
with symbols as indicated for Relationship (1).
Figure 4. Relationship determined on the basis of data for Ursynów precipitation station. Source: Author
High variability of coefficients for the Z-R relationship is noted in literature. According to information given in the work by Moszkowicz and Tuszyńska (Citation2006), the values of coefficients a and b, established by many researchers on the basis of a few dozen sets of data, fall within the ranges of 16.6–730 and 1.16–2.87, respectively. According to other analyses (Chumchean Citation2004; Dhiram and Wang Citation2016), the values of a and b fall within the ranges of 31–500 and 1.1–1.9, respectively. The values of parameter a can change from a few dozen to a few hundred, while those of parameter b are usually limited to the range of 1 ≤ b ≥ 3 (Smith and Krajewski Citation1993; Morin et al. Citation2003). The values of these coefficients depend on the type of precipitation measured and, as a result of this, may vary significantly (Harrison et al Citation2000). Licznar and Krajewski (Citation2016), in studies within the area of Warsaw, after applying a laser distrometer, obtained a Z-R relationship for rain which revealed strong similarity to the commonly known Marshall–Palmer relationship (applied by the Institute of Meteorology and Water Management – National Research Institute to calculate rainfall rate). The values of a and b coefficients, obtained in an analysis presented in this work, fall into ranges of values provided by other researchers.
3.2. Rainfall depth estimates from radar data
The rainfall depths (totals) for 10 events which were calculated based on the Z-R relationship (3), as well as data from the SRI (Surface Rainfall Intensity) product in the form of radar maps, were compared with the rainfall depths measured using electronic tipping-bucket rain gauges at the Okęcie and Ursynów precipitation stations (). Values of rainfall rate in the SRI product (obtained from the Institute of Meteorology and Water Management – National Research Institute in Warsaw) were obtained as a result of processing the reflectivity value registered by the radar based on a and b coefficients determined by Marshall and Palmer, equal to 200 and 1.60, respectively.
The rainfall depths determined for individual events based on data from the SRI product (rainfall rate map) were much smaller than corresponding rainfall totals measured using rainfall gauges at the Okęcie and Ursynów precipitation stations. A stronger similarity was observed for data calculated on the basis of rainfall rate values measured at the Ursynów precipitation station and radar reflectivity.
An assessment of the agreement between rainfall totals for the analysed events obtained on the basis of radar data as well as in direct measurements was carried out using the values of relative error, which was calculated using Formula (4).
(4)
(4)
…where δ is the relative error (percentage), x is the calculated value, x0 is the measured value.
The values of the relative error for the analysed events, calculated for rainfall depths established on the basis of the Z-R relationship (3) and direct measurements at Okęcie and Ursynów precipitation stations, ranged from –39.2% to 18.6% (). The values of this error were lower than 25% for eight events. In relation to the rainfall totals determined on the basis of the SRI product, the values of the relative error were significantly higher and ranged from –77.8% to 66.5%.
Compatibility assessment was also carried out on the basis of the ratio of rainfall totals obtained from radar data to corresponding values measured at precipitation stations. The values of this relationship, calculated in reference to the rainfall totals determined for individual events on the basis of the Z-R relationship as well as data from the SRI product were found to be between 0.6 and 1.2, as well as 0.2 and 0.3. In accordance with information given in a work by Moszkowicz and Tuszyńska (Citation2006), comparing the radar rainfall rate with the rate measured using pluviographs showed that radar rainfall rate falls within 0.5 and 2 times the rainfall rate from the pluviograph, with 75% probability. Multiyear comparisons carried out at the British meteorological service showed that a similar relationship is observed for a period of a few hours, and it is not until dealing with monthly or seasonal totals that the differences decrease significantly.
3.3. Simulation of flows using rainfall data
The SWMM model for the analysed catchment () was applied to simulate flows in response to rainfall depths for two selected events assessed at individual time steps of the duration of the rainfall on the basis of data from the weather radar as well as measured at the Okęcie and Kłobucka precipitation stations.
Simulation of maximum flows of hydrograms was carried out for individual scenarios in response to the rainfall depth:
Measured using rain gauges at Okęcie and Ursynów precipitation stations, which were assigned to two appropriate parts of the catchment (Scenario 1).
Calculated based on the Z-R relationship (3) and radar reflectivity for two pixels corresponding to the location of precipitation stations, which were assigned to two appropriate parts of the catchment (Scenario 2).
Determined on the basis of data from the SRI product (Surface Rainfall Intensity) for 66 pixels covering the area of the analysed catchment, which were assigned to 66 rain gauges (located at the Okęcie and Ursynów precipitation stations and 64 virtual rain gauges) created in the SWMM model (Scenario 3).
Established based on Z-R (3) relationship and radar reflectivity for 66 pixels which were assigned to 66 rain gauges in the model (Scenario 4).
The analysis was limited to calculated and measured (direct) flows at two cross-sections of the Służewiecki Stream, i.e. Rosoła and Kłobucka, the location of which had been presented in . The values of these flows have been compiled in and . Flows measured for the two analysed events were 5.935 and 21.166 m3·s−1in the Rosoła cross-section, and 0.733 and 1.310 m3·s−1 in the Kłobucka cross-section. The given values of flows in the Rosoła cross-section differed significantly from each other. Low values of flows in the Kłobucka cross-section are largely the result of their transformation by retention reservoirs in the area of the airport.
Table 2. Flows in calculation cross-sections using data for two rainfall gauges (Scenarios 1 and 2).
Table 3. Flows in calculation cross-sections using data for 66 rainfall gauges (Scenarios 3–4).
The assessment of agreement between the simulated and measured flows was carried out using relative error by application of Formula (4). A relative error of 25% was deemed to be the cut off limit for model acceptance (Ozga-Zielińska and Brzeziński Citation1997).
Values of the relative error for flows calculated in the Rosoła and Kłobucka cross-sections on the basis of rainfall depth from rain gauges (Scenario 1) ranged from –14.0% to 14% (). Values of the relative error which were calculated using data calculated based on the Z-R relationship (3) and assigned to the Okęcie and Ursynów precipitation stations (Scenario 2) ranged from 12.0% to 11.5%. Compared to these scenarios for each of the calculated flows, the values of relative error were lower than the value assumed as the cut off line for model acceptance (25%).
In an analysis similar to the scenarios above and carried out on the basis of data from the SRI product for 66 rain gauges covering the area of the analysed catchment (Scenario 3), significantly higher values of relative error were obtained. These were found to be between –83.1% and –40.5%, and significantly exceeded the assumed cut off value for model acceptance. Values of flows calculated for this scenario were much lower than flows calculated in the Rosoła and Kłobucka cross-sections. The result of these calculations is comparable to that obtained in the analysis of rainfall totals, for which relative error was found to be between –77.8% and –66.5% () as compared to rainfall data from the SRI product.
Simulations carried out in response to rainfall depths determined based on the Z-R relationship (3), which were assigned to 66 rain gauges covering the area of the analysed catchment (Scenario 4), resulted in flows characterized by higher values than measured flows. Values of relative error fell within the range of 0.3% to 25.9%. With regard to one of the flows, relative error was found to slightly exceed the value assumed as the cut off line for model acceptance.
Simulations carried out on the SWMM model for four assumed rainfall scenarios were used to prepare water level profiles along one of the main rainfall collectors in the area of the analyzed catchment and assess the possibility of the occurrence of flooding in the catchment. Rainfall events occurring on 15 August 2008, characterized by the highest total rainfall from two assumed events, were used to simulate flows in the analysis. Included in are water level profiles for the analyzed collector (located in the area of a subcatchment distinguished by the highest level of urbanization in the analyzed catchment, the outlet of which to Służewiecki Stream is found on the right side, directly above calculation cross-section No. 1), which show the maximum water levels in pipelines and nodal points of the collector (junctions) for all scenarios.
Figure 5. Profiles of maximum water level in one of the main collectors obtained for various scenarios in response to the rainfall event occurring on 15 August 2008: (a) Scenario 1; (b) Scenario 2; (c) Scenario 3; (d) Scenario 4. Source: Author
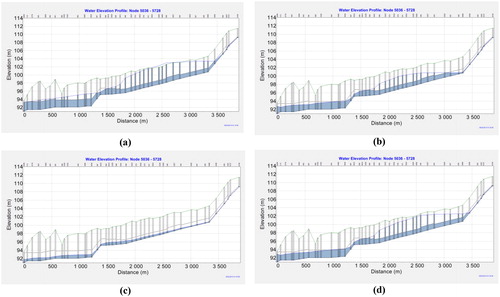
Water level profiles obtained for the simulation of flows according to Scenario 1 (), carried out in response to rainfall depth measured using rain gauges at Okęcie and Ursynów precipitation stations, indicate the occurrence of a flooding area in the central part of the rainfall collector – in the section where the water level in the nodal points of the collector is found above the level of the ground. The water level profiles prepared in relation to the simulations carried out for Scenarios 2–4, did not show the occurrence of areas of flooding. In the case of Scenarios 2 and 4, in which rainfall depths established based on the new Z-R relationship were assumed to calculate flows, the potential risk of the occurrence of flooding is high due to the simulated high water level in the nodal points of the collector. The water levels in the collector, which were obtained in simulations according to Scenario No. 3 (in response to rainfall depth determined on the basis of data from the SRI product), indicate significant underestimation water flow values.
4. Conclusions
Rainfall totals calculated for 10 events based on data from the SRI product (obtained as a result of processing radar reflectivity using the Marshall–Palmer relationship), were much lower than corresponding data measured using rain gauges. This indicated the need to determine a new Z-R relationship which offers better rainfall rate estimation in the investigated urban catchment (the Służewiecki Stream in Warsaw, Poland) as compared to that of Marshall–Palmer. Relatively good compatibility was found for the analysed events between measured rainfall totals and those calculated from radar data determined on the basis of the Z-R relationship established in this work.
The values of flows, which were calculated in two cross-sections of the main stream using the SWMM hydrodynamic model in response to the rainfall data calculated on the basis of the new Z-R relationship and radar reflectivity for two pixels corresponding to the location of precipitation stations, were similar to flows measured in these cross-sections. In analogous simulations, carried out in response to rainfall depths calculated on the basis of the new Z-R relationship and radar reflectivity for 66 pixels covering the area of the catchment, slightly lower compatibility between the measured and calculated flows was noted. Values of flows which were calculated in response to the rainfall depth established on the basis of data from the SRI product were much lower than flows measured in the analysed cross-sections.
Based on the analysis of water level profiles prepared for one of the main rainfall collectors in the area of the catchment under study for scenarios in which the rainfall depth estimated using the new Z-R relationship was assumed, flooding on the surface of the terrain was not confirmed, although, the possibility of their occurrence in the area of the catchment is high. The occurrence of an area of flooding was determined for the scenario in which the rainfall depth was measured using rain gauges.
Acknowledgements
Information regarding radar data: The source of data is the Institute of Meteorology and Water Management – National Research Institute. Data from the Institute of Meteorology and Water Management – National Research Institute were processed.
Disclosure statement
No potential conflict of interest was reported by the author.
Additional information
Funding
Related Research Data
References
- Abon CC, Kneis D, Crisologo I, Bronstert A, David CPC, Heistermann M. 2016. Evaluation the potential of radar-based rainfall estimates for streamflow and flood simulations in the Philippines. Geomat Nat Haz Risk. 7(4):1390–1405.
- Atencia A, Mediero L, Llasat MC, Garrote L. 2011. Effect of radar rainfall time resolution on the predictive capability of distributed hydrologic model. Hydrol Earth Syst Sci. 15(12):3809–3827.
- Barszcz M. 2015. Influence of applying infiltration and retention objects on the runoff of rainwater on a plot and catchment scale – case study of the Służewiecki Stream subcatchment in Warsaw. Pol J Environ Stud. 24:57–65.
- Barszcz M. 2018. Application of radar data for the analysis of the rainfall-runoff process in an urban catchment. Acta Sci Pol Form Cir. 17(2):33–46.
- Berne A, Krajewski WF. 2013. Radar for hydrology: unfulfilled promise or unrecognized potential? Adv Water Res. 51:357–366.
- Chumchean S. 2004. Improved estimation of radar rainfall for use in hydrological modelling [PhD thesis]. Sydney: University of New South Wales.
- Dhiram K, Wang ZH. 2016. Evaluation on radar reflectivity-rainfall rate (Z-R) relationships for Guyana. Atmos Clim Sci. 06(04):489–499.
- Harrison DL, Driscoll SJ, Kitchen M. 2000. Improving precipitation estimates from weather radar using quality control and correction techniques. Meteorol Appl. 6:135–144.
- Jakubiak B, Licznar P, Malinowski SP. 2014. Rainfall estimates from radar vs. raingauge measurements. Warsaw case study. Environ Prot Eng. 40:159–170.
- Jatho N, Pluntke T, Kurbjuhn C, Bernhofer C. 2010. An approach to combine radar and gauge based rainfall data under consideration of their qualities in low mountain ranges of Saxony. Nat Hazards Earth Syst Sci. 10(3):429–446.
- Licznar P, Krajewski WF. 2016. Precipitation type specific radar reflectivity-rain rate relationship for Warsaw, Poland. Acta Geophys. 64(5):1840–1857.
- Licznar P, Łomotowski J, Rojek M. 2005. Methods of rainfall intensity measurement for the Leeds of Urban drainage systems`design and exploitation. Woda-Środowisko-Obszary Wiejskie 5:209–2019. Polish.
- Marshall JS, Palmer WM. 1948. The distribution of raindrops with size. J Meteorol. 5(4):165–166.
- Mittermaier MP. 2008. Introducing uncertainty of radar-rainfall estimates to the verification of mesoscale model precipitation forecasts. Nat Hazards Earth Syst Sci. 8(3):445–460.
- Morin E, Krajewski WF, Goodrich DC, Gao X, Sorooshian S. 2003. Estimating rainfall intensities from weather radar data: the scale-dependency problem. J Hydrometeor. 4(5):782–797.
- Moszkowicz S, Tuszyńska I. 2006. Meteorologia radarowa Podręcznik użytkownika informacji radarowej IMGW [Radar meteorology. IMGW radar information user’s manual]. Warsaw: Instytut Meteorologii i Gospodarki Wodnej; 100 p. Polish.
- Ozga-Zielińska M, Brzeziński J. 1997. Applied hydrology. Warsaw: Wydawnictwo Naukowe PWN. Polish.
- Park SY, Lee KW, Park IH, Ha SR. 2008. Effect of the aggregation level of surface runoff fields and sewer network for a SWMM simulation. Desalination. 226(1–3):328–337.
- Peleg N, Ben-Asher M, Morin E. 2013. Radar subpixel-scale rainfall variability and uncertainty: lessons learned from observations of a dense rain-gauge network. Hydrol Earth Syst Sci. 17(6):2195–2208.
- Peterson EW, Wicks CM. 2006. Assessing the importance of conduit geometry and physical parameters in karts systems using the storm water management model (SWMM). J Hydrol. 329(1–2):294–305.
- Rossman LA. 2010. Storm water management model user`s manual version 5.0. Cincinnati (OH): National Risk Management Research Laboratory, U.S. Environmental Protection Agency.
- Smith JA, Krajewski WF. 1993. A modeling study of rainfall rate-reflectivity relationships. Water Resour Res. 29(8):2505–2514.
- Somorowska U. 2012. Annual and seasonal precipitation patterns across lowland catchment derived from rain gauge and weather radar data. J Water Land Dev. 17(1):3–10.
- Szturc J, Jurczyk A, Ośródka K. 2016. System of estimation and nowcasting of precipitation (SEiNO) generating data of high spatial and temporal resolution. In: Hejduk L, Kaznowska E, editors. Hydrologia zlewni zurbanizowanych. Warsaw: Monografie Komitetu Gospodarki Wodnej PAN, No. 39; p. 19–32. Polish.
- Yang D, Koike T, Tanizawa H. 2004. Application of distributed hydrological model and feather radar observations for flood management in the upper Tone River of Japan. Hydrol Process. 18(16):3119–3132.