
 ?Mathematical formulae have been encoded as MathML and are displayed in this HTML version using MathJax in order to improve their display. Uncheck the box to turn MathJax off. This feature requires Javascript. Click on a formula to zoom.
Abstract
This study evaluated the performance and utility of the Climate Hazard Group InfraRed Precipitation with Stations (CHIRPS) dataset for monitoring drought over Yunnan Province, China. First, several statistical metrics were used to evaluate the CHIRPS data against 122 gauge observations acquired during 1981–2015. Then, the variation of drought was investigated further based on the Standardized Precipitation Index (SPI) over multiple timescales. The results showed the following: (1) the CHIRPS data performed well in terms of monthly precipitation estimation (CC = 0.89, RMSE = 44.26, and MAE = 27.89), albeit with slight overestimation of total precipitation (Bias = 2.9%). Moreover, the CHIRPS data were found adequate in capturing the spatial distribution of precipitation. (2) The CHIRPS-based SPI was shown to be able to capture the occurrence and characteristics of drought events, suggesting that the CHIRPS dataset could be used as an alternative precipitation source for monitoring drought. (3) On the annual scale, it was found that the regions affected most frequently by drought are areas in central, western, and southern parts of Yunnan Province. High frequency of drought occurrence was observed in both spring and winter. Moreover, the results revealed a widespread drying trend over Yunnan Province during 1981–2015, especially in autumn and winter.
1. Introduction
Drought is a complex phenomenon that can have considerable impact on agriculture, society, and ecosystems (Ionita et al. Citation2016; Aziz et al. Citation2018). Drought can be divided broadly into one of four types: (a) meteorological, (b) hydrological, (c) agricultural, and (d) socioeconomic (Kao and Govindaraju Citation2010). Meteorological drought occurs first because of precipitation deficit. It is followed by hydrological and agricultural droughts because all three other types of drought are attributable to a continued period of insufficient precipitation (Adamson and Bird Citation2010). At the beginning of the twenty first century, large-scale extreme droughts occurred throughout the world, causing huge economic losses (Du et al. Citation2018). According to statistics from the Bulletin of Flood and Drought Disasters in China, national annual losses induced by drought reached approximately 88 billion RMB during 2006–2017. Therefore, monitoring drought is important for providing essential information regarding drought variability in relation to climate change adaption (Masih et al. Citation2014), and thus numerous earlier studies have assessed drought variability and water scarcity throughout the world (Chen and Li Citation2016; Gampe et al. Citation2016; Zhou et al. Citation2016).
Drought can be classified using drought indices (Chen et al. Citation2016), allowing researchers to evaluate such climate anomalies quantitatively in terms of duration, intensity, and spatial extent (Mishra and Singh Citation2010). The Palmer Drought Severity Index (PDSI) and the Standardized Precipitation Index (SPI) are the two indices used most widely (Mishra and Nagarajan Citation2011; Zhong et al. Citation2018). Calculation of the PDSI requires many parameters such as precipitation, air pressure, air temperature, and soil moisture. Moreover, because the timescale of the PDSI is fixed, the index cannot reveal the variability of regional drought events on multiple timescales. The SPI, which was developed by McKee et al. (Citation1993), considers only rainfall when defining drought periods and therefore this index is often used to overcome these problems. It can be used to track drought over multiple timescales, and it is flexible with respect to the selected period space. The salient advantages of the SPI are that it can be computed for different timescales and it can provide early warning of drought and help assess drought severity (WMO Citation2012). The SPI has been applied to the study of different aspects of drought, e.g. frequency analysis (Guo et al. Citation2017), forecasting (Mishra et al. Citation2007), spatiotemporal analysis, and climate impact studies (Ashraf and Routray Citation2015). In addition, the SPI has been used widely to investigate the occurrence of meteorological drought in many countries and regions, e.g. Ethiopia (Edossa et al. Citation2010), Romania (Ionita et al. Citation2016), India (Mahajan and Dodamani Citation2016), Singapore (Tan et al. Citation2017), and China (Chen et al. Citation2017).
Precipitation is the most basic input for calculation of drought indices (Siuki et al. Citation2017); therefore, long-term precipitation records are always required for drought assessment. Traditionally, drought indices are calculated using in situ meteorological observations. However, meteorological stations are usually distributed sparsely and unevenly, or they might even be entirely unavailable in some remote areas. This lack of data could be compensated by various satellite-derived precipitation products, if suitable consideration were given to their inherent errors and uncertainties (Shen et al. Citation2014). In recent years, various satellite-derived precipitation datasets have been released, e.g. the Global Precipitation Climatology Project (Huffman et al. Citation1997), Precipitation Estimation from Remotely-Sensed Information using Artificial Neural Networks (PERSIANN) (Hsu et al. Citation1997), Climate Prediction Center orphing algorithm (CMORPH) (Joyce et al. Citation2004), Tropical Rainfall Measuring Mission (TRMM) Multi-satellite Precipitation Analysis (Huffman et al. Citation2007), Climate Hazards Group InfraRed Precipitation with Stations (CHIRPS) (Funk et al. Citation2015), Multi-Source Weighted-Ensemble Precipitation (Beck et al. Citation2017), Global Satellite Mapping of Precipitation (Gao et al. Citation2017), and Global Precipitation Measurement (Hou et al. Citation2013). With the advantages of high spatiotemporal resolution, large-scale coverage, and public accessibility, satellite precipitation estimates are playing an increasingly important role in providing supplemental data resources for monitoring drought (Stisen and Sandholt Citation2010; Toté et al. Citation2015; Yan et al. Citation2018).
Many studies have assessed drought using short-term satellite precipitation products; however, the error from such limited data records should be studied further (Jesús et al. Citation2016; Tao et al. Citation2016; Tan et al. Citation2017). This is because the time series of most satellite-derived products are too short for confident monitoring of drought, i.e. such studies should be based on historical data extending over a period of at least 30 years (WMO Citation2012). The CHIRPS dataset is a long-term precipitation record (1981–present) developed for trend analysis and monitoring of seasonal drought. The latest version of the CHIRPS dataset is available at 0.05° spatial resolution for daily, monthly, and yearly timescales (Funk et al. Citation2015). In a comprehensive global-scale evaluation of 22 precipitation datasets, the CHIRPS dataset was found to provide satisfactory performance (Beck et al. Citation2017) that could meet the demands associated with monitoring drought over a climatological timescale of more than 30 years. In recent years, the CHIRPS dataset has been applied to drought monitoring and it has demonstrated promising performance in relation to certain countries and regions such as northeastern Brazil (Paredes-Trejo et al. Citation2017), East Africa (Agutu et al. Citation2017), and southern China (Zhong et al. Citation2019).
Located in Southwest China, Yunnan Province was once considered a moist area; however, in recent years, the region has experienced frequent occurrence of drought (Ma et al. Citation2017; Li et al. Citation2019b). Most previous studies have assessed the variation of drought in Yunnan Province based on traditional in situ gauge precipitation observations (Yu et al. Citation2013; Zhang et al. Citation2015; Yan et al. Citation2017; Li et al. Citation2019b). However, the precipitation observation network is sparse and heterogenous, and some data are not available to the public, exacerbating the limitations and drawbacks associated with drought monitoring research (Stampoulis and Anagnostou Citation2012). To better understand the characteristics of regional drought and to provide a reference for drought disaster reduction and improved water resource management, this study evaluated the performance of the CHIRPS precipitation dataset and its potential application to monitoring drought in Yunnan Province during 1981–2015. The main objectives of this study were (1) to evaluate the performance of the CHIRPS precipitation dataset against 122 rain gauge stations and (2) to identify the spatiotemporal variation of drought condition using a CHIRPS-based SPI.
2. Data and methodology
2.1. Study area
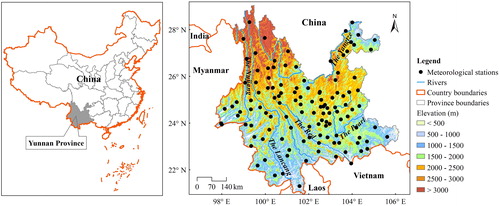
Yunnan Province is located in the plateau region of southwestern China (21°08′–29°15′N, 97°31′–106°11′E; ). The northwest of Yunnan Province extends to the Qinghai–Tibet Plateau and it borders Myanmar, Laos, and Vietnam to the west and south. The terrain of Yunnan Province can be divided into eastern and western regions, with a karst plateau landscape in the east and high mountains and deep valleys in the west (Li et al. Citation2015). The plateau region is dissected by the major Nujiang, Lancang, Red, Yangtze, and Pearl Rivers. Affected by both the Indian and East Asian monsoons, the climate is characterized by distinct wet and dry seasons (Li et al. Citation2015). Annual rainfall is around 1100 mm, approximately 85% of which falls during the wet season (May–October); less than 15% of the annual rainfall is observed during the dry season (November–April). Yunnan Province has frequently been affected by drought disasters throughout history because of its highly variable precipitation. For instance, the large-scale drought disaster that persisted from November 2009 to March 2010 is a recent example (Zhang et al. Citation2015).
Figure 1. Geographical locations and distribution of meteorological stations in Yunnan Province.
2.2. Datasets
2.2.1. Gauge precipitation data
Monthly precipitation and temperature data from 126 rain gauge stations, acquired during 1981–2015, were obtained from the Meteorological Agency of Yunnan Province. The accuracy of the precipitation data was guaranteed by quality control. However, because of an incomplete data record following site changes or a lack of measurements attributable to other reasons, complete data records from only 122 of the stations were selected for use in this study. As depicted in , the distribution of stations within the study area is dense in eastern and central areas but comparatively sparse in northwestern and southwestern parts. The elevation of the stations is in the range 139–3319 m and 85% of stations are located at an elevation above 1500 m.
2.2.2. CHIRPS precipitation data
The CHIRPS product is a new land-only IR-based climatic precipitation dataset with high spatial resolution (0.05° × 0.05°), long-term records (1981–present), and quasi-global coverage (50°S–50°N) (Funk et al. Citation2015). This dataset consists of three products, including global climatology, satellite estimates, and gauge observations with different temporal resolutions, i.e. daily, monthly, and yearly (Funk et al. Citation2015; Katsanos et al. Citation2016). Developed by the United States Geological Survey and the University of California, Santa Barbara, the CHIRPS dataset serves a number of drought early warning objectives (Funk et al. Citation2014; Tuo et al. Citation2016). In this study, the CHIRPS precipitation dataset for 1981–2015 was obtained from http://chg.geog.ucsb.edu/data/chirps/.
2.3. Methodology
2.3.1. Statistical metrics
Several statistical metrics, including the Pearson linear correlation coefficient (CC), relative bias (Bias), root mean square error (RMSE), and mean absolute error (MAE) were used for evaluating the performance of the CHIRPS precipitation data (Dinku et al. Citation2009). The equations and optimal values of CC, Bias, RMSE, and MAE are given in .
Table 1. List of statistical metrics used to evaluate the CHIRPS data.
Kling–Gupta efficiency (KGE) scores were used as an objective performance metric that combines correlation, bias, and variability. This metric was introduced by Gupta et al. (Citation2009) and later modified by Kling et al. (Citation2012). It can be defined as follows:
(1)
(1)
where r is the Pearson’s correlation coefficient, β is the ratio of the mean values of the CHIRPS and observed values, and γ is the ratio of the standard deviations of the estimated and observed coefficients of variation:
(2)
(2)
where u and σ are the distribution mean and standard deviation, respectively, and subscripts s and o indicate the CHIRPS and observed values, respectively. The value of KGE varies from 0 to 1, with KGE = 1 being a perfect fit between the observed and CHIRPS data.
2.3.2. Standardized precipitation index
The SPI is the most popular and widely used precipitation deficit index adopted to reflect drought condition. The SPI is a simply computed drought index that is based only on long-term precipitation records. In this study, 1-, 3-, 6-, and 12-month periods (SPI1, SPI3, SPI6, and SPI12, respectively) were chosen to analyse drought conditions over different timescales. The specific drought classifications based on the SPI values are presented in . The SPI program is freely available from the National Drought Mitigation Center at http://drought.unl.edu/MonitoringTools/.
Table 2. Drought classification according to SPI values.
2.3.3. Drought characteristics
Drought frequency is calculated according to the ratio of the number of drought years to the total number of years for a given timescale. The definition of drought frequency is as follows:
(3)
(3)
where n is the number of drought years, N is the length of the data series, and i is a grid within the region.
In this study, the annual and seasonal drought frequencies were calculated based on SPI12 and SPI3, respectively, and then mapped by applying the inverse distance weighting spatial interpolation technique (Tuo et al. Citation2016).
2.3.4. Mann–Kendall (MK) test
The MK test is used widely to identify the tendency of meteorological and hydrological variables (Mann Citation1945; Kendall Citation1975; Li et al. Citation2008; Gocic and Trajkovic Citation2013). There are two primary advantages to using the MK test. First, as a nonparametric test, it requires only independent data that need not be distributed normally. Second, it has weak sensitivity to abrupt breakpoints owing to inhomogeneous time series (CitationTabari et al. 2011). Based on the MK test, positive values of Z (the MK test trend statistic) indicate increasing trends, while negative Z values represent decreasing trends. The trend test is performed at a specific significance level. Generally, a trend is considered significant at the 0.05 level if |Z| ≥ 1.96. Furthermore, another nonparametric method (Sen’s slope estimator) was used in this study to detect the trends of meteorological variables (Sen Citation1968). The Sen’s slope estimator is a two-step approach for establishing robust linear regression that chooses the median slope among all lines through pairs of two-dimensional sample points, and it has the added advantage of efficient computation (Atta and Dawood 2017).
3. Results and analysis
3.1. Comparison between CHIRPS data and rain gauge observations
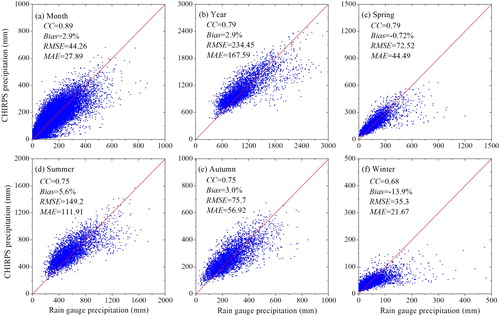
Comparison between CHIRPS data and rain gauge precipitation data was conducted using a point-to-pixel approach. This approach was selected to avoid additional errors and uncertainties during the interpolation process of rain gauge data; hence, only pixels that contained at least one rain gauge were considered. Scatter plots between CHIRPS data and rain gauge precipitation data on monthly, annual, and seasonal scales during 1981–2015 are illustrated in . It can be seen that CHIRPS precipitation agrees well with rain gauge precipitation at both monthly (CC = 0.89, RMSE = 44.26, and MAE = 27.89) and yearly scales (CC = 0.79, RMSE = 234.35, and MAE = 167.59). In addition, CHIRPS data systematically overestimate precipitation by 2.9%. Seasonally, the best performance is found in spring, followed in descending order by autumn, summer, and winter, with CC values in the range 0.68–0.79 and Bias values in the range −13.9 to 5.6%. It is worth noting the underestimation of CHIRPS precipitation in winter (Bias = −13.9%). This might be related to the fact that most satellite products perform well in detecting strong and convective rainfall events, but they lack sensitivity to drizzle or frozen precipitation during cold seasons (Kidd et al. Citation2012; Guo et al. Citation2015). Generally, CHIRPS precipitation is found in good agreement with the rain gauge observations.
Figure 2. Scatter plots of CHIRPS data and rain gauge precipitation at monthly, annual, and seasonal scales from 1981–2015.
3.2. Spatial distribution of precipitation
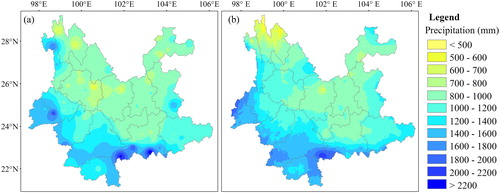
The spatial distribution of mean annual precipitation derived from the rain gauges and the CHIRPS data over Yunnan Province during 1981–2015 is shown in . The gauge-based data show the annual mean precipitation gradually decreases from southwest to northeast, with a minimum (maximum) of 548 (2327) mm in the northeast (south) of the region (. Compared with the gauge-based data, the CHIRPS data perform well in capturing the spatial pattern of the mean annual precipitation (. However, the CHIRPS data underestimate precipitation in some regions in the south and northwest of Yunnan Province, largely because of interactions between monsoon flow and topography (Li et al. Citation2019b). In addition, mean annual precipitation over Yunnan Province based on rain gauge and CHIRPS data is 1087 and 1143 mm, respectively, indicating slight overestimation of CHIRPS precipitation in comparison with rain gauge data.
Figure 3. Spatial distribution of mean annual precipitation over Yunnan Province from 1981–2015 based on (a) rain gauge data and (b) CHIRPS data.
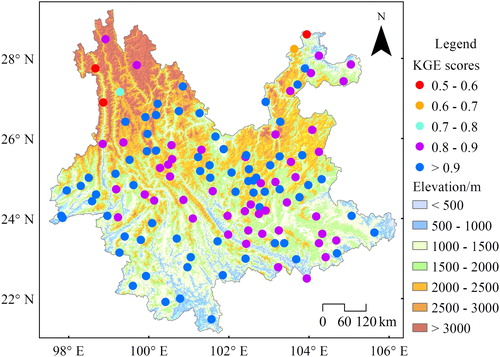
To further evaluate the performance of the CHIRPS dataset, the CHIRPS data were compared separately with the data from the 122 rain gauges acquired during 1981–2015. The KGE scores on the monthly scale were used for this spatial analysis. The median KGE score of the 122 rain gauges is 0.91. The median scores for the correlation, bias, and variability components of the KGE, expressed as |r − 1|, |β − 1|, and |γ − 1|, are −0.09, −0.06, and −0.05, respectively. Generally, the CHIRPS data show satisfactory performance when compared separately with the rain gauge data. The spatial distribution of KGE scores at different rain gauge stations is presented in . Overall, reasonable performance of CHIRPS data was found over most of the region, where the KGE scores are >0.8. However, the worst performance was found associated with several stations in the mountain–gorge regions of northwestern and northeastern Yunnan Province.
Figure 4. Spatial distribution of KGE scores at different rain gauge stations.
3.3. SPI comparison between CHIRPS and rain gauge precipitation
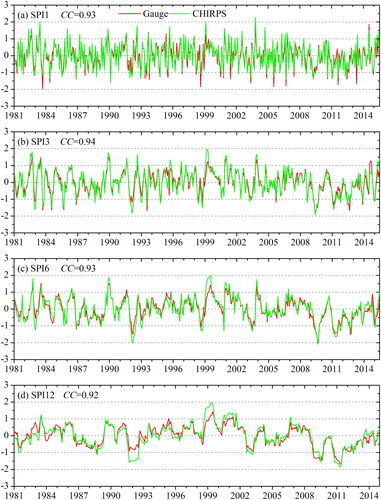
The SPI was first calculated based on rain gauge precipitation and CHIRPS precipitation individually at 1-, 3-, 6-, and 12-month timescales. The averaged CHIRPS-based SPI and gauge-based SPI during 1981–2015 are shown in . It can be seen that the CHIRPS-based SPIs can capture drought occurrence and the characteristics of drought variation in comparison with the gauge-based SPI. Strong correlation between the CHIRPS-based SPI and the gauge-based SPI is found at different timescales, with CCs >0.90. Based on the SPI-12, historical drought events can be reflected by the values of the SPI, e.g. 1987, 1992, 2003, 2006, 2009, 2010, and 2012. However, the CHIRPS-based SPI also has some slight errors. For instance, CHIRPS data overestimate drought intensity in 1992, 2003, and 2012, which is largely because of inherent error within the CHIRPS data, and partly because of the mismatch in spatial scale between the CHIRPS and the rain gauge data. Overall, the CHIRPS data could be used as an alternative precipitation source for analysis of drought within this region.
Figure 5. Spatially averaged time series SPIs for CHIRPS and rain gauge data from 1981–2015 at different time scales: (a) 1 month, (b) 3 months, (c) 6 months, and (d) 12 months.
3.4. Spatial and temporal variations of drought
3.4.1. Spatial distribution of drought frequency
The spatial distribution of drought frequency for different drought categories and timescales is shown in . It is clear that the drought frequency of a given category varies with location and timescale. On the annual scale, the frequency of overall drought categories (moderate and above) is in the range 17.2–46.5% with an average value of 31.1%. The areas affected most frequently by drought are in central, western, and southern regions (. The frequency of moderate drought varies in the range 5.8–31.9%, and central, western, and southwestern areas are affected most frequently by moderate drought (. The average frequency of severe and extreme drought is 6.8 and 2.1%, respectively (. According to , areas where extreme drought occurs most frequently are found in the southeast of the region.
Figure 6. Spatial distributions of annual and seasonal drought frequency (%) for different drought categories in Yunnan Province during 1981–2015.
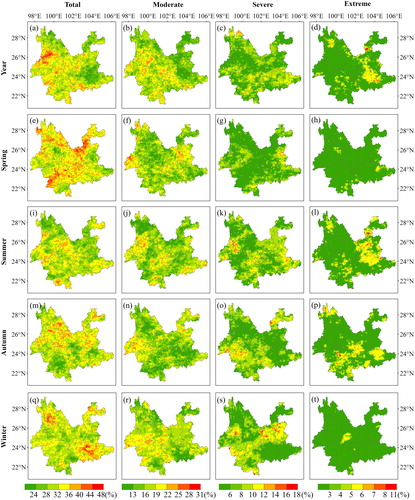
Seasonally, drought frequency also presents very distinct spatial differences. In spring, drought frequency is the highest among the four seasons; it ranges from 17.4 to 47.3%, with an average value of 33.5%. The majority of Yunnan Province is affected by drought (. The averaged drought frequencies in summer and autumn are 30.3 and 31.1%, respectively (. It is worth noting that the frequency of extreme drought in summer and autumn is higher than in other seasons (. In winter, drought frequency ranges from 20.8 to 47.8%, with an average value of 31.8% (. The frequency of drought occurrence in winter ranks second among the four seasons. The southwest and part of the northeast of the region are frequently influenced by severe drought (. Overall, spring and winter are prone to the highest drought occurrence of the four seasons; however, the east and south of the region are susceptible to extreme drought in summer and autumn, respectively.
3.4.2. Changing trend of the SPI
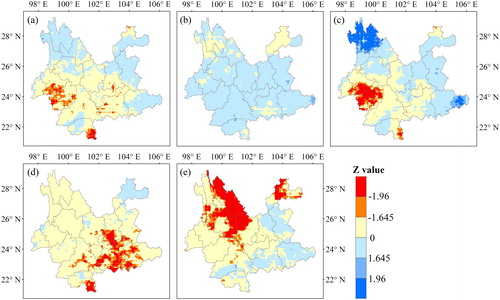
The spatial distribution of the MK trend statistic for the annual and seasonal SPI during 1981–2015 is shown in . Positive and negative trends represent trends toward wetter and drier conditions, respectively. On the annual scale, a downward trend (drying) dominates the south and southwest of Yunnan Province, while an upward trend (wetting) is observed in northwestern and eastern parts of the region (. On the seasonal scale, the majority of Yunnan Province experiences a wetting trend in spring; however, the trends are not significant (. In summer, the southwest of the region is becoming drier, while the northwestern and southeastern parts are becoming wetter (). A widespread drying trend is observed in autumn, and the trend is significant over the southeast of the region (. In winter, central, western, northwestern, and northeastern parts of the region are becoming drier and the changing trend is significant in the northwest and northeast (. In summary, the trends of annual SPI and seasonal SPI present remarkable spatial variations. In addition, most of Yunnan Province is generally becoming drier in autumn and winter.
Figure 7. Spatial distribution of the Z statistic based on the SPI during 1981–2015: (a) annual, (b) spring, (c) summer, (d) autumn, and (e) winter.
4. Discussion
Five statistical metrics were used to assess the quality of the CHIRPS data against rain gauge observations in Yunnan Province during 1981–2015. The CHIRPS data performed well in terms of annual (CC = 0.89, RMSE = 44.26, and MAE = 27.89) and monthly (CC = 0.79, RMSE = 234.35, and MAE = 167.59) precipitation estimation, although it systematically overestimated precipitation by 2.9%. However, in comparison with the findings of previous studies on the evaluation of different satellite-derived precipitation data (e.g. TRMM, CMORPH_CRT, and PERSIANN_CDR) in Lancang and the Yuanjiang River Basin in Yunnan Province (Zhang et al. Citation2018a, Citation2018b; Li et al. Citation2019b), the CHIRPS data were found to have smaller systematic errors.
The CHIRPS data also performed better in the warm seasons than the cold seasons, which might be related to its limited ability to detect drizzle or frozen precipitation during the latter period (Kidd et al. Citation2012); a phenomenon that has also been reported in previous studies (Qin et al. Citation2014; Guo et al. Citation2017; Zambrano et al. Citation2017; Bai et al. Citation2018). The KGE scores indicated that the CHIRPS data agreed well with the rain gauge observations, suggesting that the CHIRPS data are adequate for capturing precipitation variability across Yunnan Province, except over some mountain–gorge regions in northwestern and northeastern parts. Many previous studies have indicated that satellite-derived precipitation products generally have difficulty representing precipitation in areas of complex topography where precipitation is controlled by orography and characterized by high spatiotemporal variability (Derin and Yilmaz, Citation2014; Khan et al. Citation2014; Sun et al. Citation2018).
It was found that the CHIRPS-based SPI exhibited strong correlation with the gauge-based SPI over multiple timescales (i.e. 1-, 3-, 6-, and 12-month timescales), with CC values >0.90. In addition, the CHIRPS-based SPI was found satisfactory in capturing the occurrence and characteristics of drought events in comparison with the gauge-based SPI. This finding suggests the CHIRPS data could be used as an alternative precipitation source in drought monitoring over Yunnan Province. As a long-term (>30 years) and near real-time (3-week delay) precipitation dataset, the CHIRPS dataset is ideal for monitoring and warning of the occurrence of drought (Funk et al. Citation2015). In recent years, the CHIRPS data have been proven a valuable precipitation dataset in drought monitoring in Brazil (Paredes-Trejo et al. Citation2017), China (Gao et al. Citation2018; Lai et al. Citation2019; Zhong et al. Citation2019), East Africa (Agutu et al. Citation2017), Ethiopia (Bayissa et al. Citation2017), and South America (Zambrano et al. Citation2017).
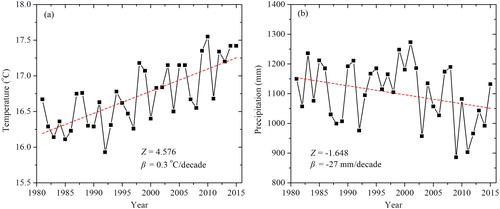
This study analysed drought variability using the CHIRPS-based SPI over multiple timescales. The results showed the areas affected most frequently by drought are in central, western, and southern regions on the annual timescale. On the seasonal scale, the highest frequency of drought was observed during spring and winter, consistent with the findings of previous studies (Yu et al. Citation2013). However, eastern and southern regions are susceptible to extreme drought in summer and autumn, respectively, which is a finding not reported in the literature following previous research (Yu et al. Citation2013; Yan et al. Citation2017). One explanation could be that the weakening of the Asian summer monsoon causes less water vapor transport to the eastern and southern regions, which result in the persistent deficient precipitation in summer and autumn and subsequently intensified drought (Li et al. Citation2015; Li et al. Citation2019a). Another reason is that under the influence of the monsoonal circulation and complex topography, the precipitation present high spatial and temporal variabilities across the region, which lead to different responses of drought behaviours in space and time. Moreover, the trends analysis of the SPI revealed that droughts have intensified over most regions of Yunnan Province, especially in the southwest during summer, southeast during autumn, and northwest and northeast during winter. Previous studies have also reported that the droughts have intensified across Yunnan province over the last decades, as detected by various drought indices (Yu et al. Citation2013; Li et al. Citation2014; Li et al. Citation2019a). For the period 1981–2015, Yunnan Province has experienced a warming-drying climatic tendency with increasing temperature (0.3 °C/decade) and decreasing precipitation (27 mm/decade) (), the decreased precipitation and rising temperature are the main factors responsible for the drought intensification.
Figure 8. Change trends of annual mean temperature (a) and precipitation (b) over Yunnan Province during 1981–2015. Z is the Mann–Kendall test statistic and β is the Sen’s slope.
5. Conclusions
In this study, the CHIRPS data were evaluated against data acquired at 122 rain gauge stations over Yunnan Province during 1981–2015. The spatial and temporal variabilities of drought were further investigated based on the SPI over multiple timescales. The main findings are as follows:
The CHIRPS data performed well in estimating annual and monthly precipitation over Yunnan Province, albeit with slight overestimation in total precipitation amount. Seasonal analysis showed the CHIRPS data underestimated (overestimated) precipitation during the dry (wet) season. Spatially, the CHIRPS data were found adequate in capturing the pattern of precipitation across Yunnan Province, except over some mountain–gorge regions where precipitation is strongly affected by interactions between monsoon flow and topography.
The CHIRPS-based SPI correlated well with the gauge-based SPI over multiple timescales (CC > 0.9). Moreover, the performance of the CHIRPS-based SPI was found reasonable in capturing the occurrence and characteristics of drought events in comparison with the gauge-based SPI, indicating that the CHIRPS data could be used as an alternative precipitation source in drought monitoring over Yunnan Province.
On the annual scale, the areas affected most frequently by drought are in central, western, and southern Yunnan Province. High frequency of drought was observed during spring and winter. However, eastern and southern regions were found susceptible to extreme drought in summer and autumn, respectively. In addition, the results revealed a widespread drying trend over Yunnan Province during 1981–2015, especially for the southwest during summer, southeast during autumn, and northwest and northeast during winter.
In summary, the long-term CHIRPS dataset is considered ideal for drought monitoring in Yunnan Province. Compared with gauge observations, the CHIRPS data were able to reveal enhanced detail of the characteristics of the regional distribution of drought. However, certain bias remains in the CHIRPS data when detecting drought intensity. Therefore, bias correction should be investigated in future study to improve the accuracy of the CHIRPS dataset. The regional drought analysis based on the CHIRPS dataset reported here could provide a reference for drought disaster reduction and water resource management.
Acknowledgments
The authors would like to acknowledge the CHIRPS research communities for making the data available to international users. Also, the authors acknowledge the editor and reviewers for their valuable comments.
Disclosure statement
No potential conflict of interest was reported by the authors.
Additional information
Funding
References
- Adamson P, Bird J. 2010. The Mekong: a drought-prone tropical environment. Int J Water Resour D. 26(4):579–594.
- Agutu NO, Awange JL, Zerihun A, Ndehedehe CE, Kuhn M, Fukuda Y. 2017. Assessing multi-satellite remote sensing, reanalysis, and land surface models’ products in characterizing agricultural drought in East Africa. Remote Sens Environ. 194:287–302.
- Ashraf M, Routray JK. 2015. Spatio-temporal characteristics of precipitation and drought in Balochistan Province, Pakistan. Nat Hazards. 77(1):229–254.
- Atta-Ur-Rahman, Dawood M. 2017. Spatio-statistical analysis of temperature fluctuation using Mann-Kendall and Sen’s slope approach. Clim Dynam. 48(3–4):783–797.
- Aziz A, Umar M, Mansha M, Khan MS, Javed MN, Gao H, Farhan SB, Iqbal I, Abdullah S. 2018. Assessment of drought conditions using HJ-1A/1B data: a case study of Potohar region, Pakistan. Geomat Nat Hazards Risk. 9(1):1019–1036.
- Bai L, Shi CX, Li L, Yang Y, Wu J. 2018. Accuracy of CHIRPS satellite-rainfall products over mainland China. Remote Sens. 10(3):362–390.
- Bayissa Y, Tadesse T, Demisse G, Shiferaw A. 2017. Evaluation of satellite-based rainfall estimates and application to monitor meteorological drought for the Upper Blue Nile Basin, Ethiopia. Remote Sens. 9(7):669–687.
- Beck HE, van Dijk A, Levizzani V, Schellekens J, Miralles DG, Martens B, de Roo A. 2017. MSWEP: 3-hourly 0.25° global gridded precipitation (1979-2015) by merging gauge, satellite, and reanalysis data. Hydrol Earth Syst Sci. 21(1):1–38.
- Beck HE, Vergopolan N, Pan M, Levizzani V, van Dijk A, Weedon GP, Brocca L, Pappenberger F, Huffman GJ, Wood EF. 2017. Global-scale evaluation of 22 precipitation datasets using gauge observations and hydrological modeling. Hydrol Earth Syst Sci Dis. 21(12):1–23.
- Chen C, Son N, Chen C, Chiang S, Chang L, Valdez M. 2016. Drought monitoring in cultivated areas of Central America using multi-temporal MODIS data. Geomat Nat Hazards Risk. 8(2):1–16.
- Chen F, Li J. 2016. Quantifying drought and water scarcity: a case study in the Luanhe river basin. Nat Hazards. 81(3):1913–1927.
- Chen H, Wu W, Liu H. 2017. Assessing the utility of meteorological drought indices in monitoring summer drought based on soil moisture in Chongqing, China. Theor Appl Climatol. 132(4):1–11.
- Derin Y, Yilmaz KK. 2014. Evaluation of multiple satellite-based precipitation products over complex topography. J Hydrometeorol. 15(4):1498–1516.
- Dinku T, Ruiz F, Connor SJ, Ceccato P. 2009. Validation and intercomparison of satellite rainfall estimates over Colombia. J Appl Meteorol Climatol. 49:104–114.
- Du L, Mikle N, Zou Z, Huang Y, Shi Z, Jiang L, McCarthy HR, Liang J, Luo Y. 2018. Global patterns of extreme drought-induced loss in land primary production: identifying ecological extremes from rain-use efficiency. Sci Total Environ. 628–629:611–620.
- Edossa DC, Babel MS, Gupta AD. 2010. Drought analysis in the Awash River Basin, Ethiopia. Water Resour Manage. 24(7):1441–1460.
- Funk C, Peterson P, Landsfeld M, Pedreros D, Verdin J, Shukla S, Husak G, Rowland J, Harrison L, Hoell A, et al. 2015. The climate hazards infrared precipitation with stations-a new environmental record for monitoring extremes. Sci Data. 2(1):66–87.
- Funk CC, Peterson PJ, Landsfeld MF, Pedreros DH, Verdin AP. 2014. A quasi-global precipitation time series for drought monitoring. US Geol Surv Data Ser. 832(4):1–12.
- Gampe D, Nikulin G, Ludwig R. 2016. Using an ensemble of regional climate models to assess climate change impacts on water scarcity in European river basins. Sci Total Environ. 573:1503–1518.
- Gao F, Zhang Y, Ren X, Yao Y, Hao Z, Cai W. 2018. Evaluation of CHIRPS and its application for drought monitoring over the Haihe River Basin, China. Nat Hazards. 92(1):155–172.
- Gao X, Zhao Q, Zhao X, Wu P, Pan W, Gao X, Sun M. 2017. Temporal and spatial evolution of the standardized precipitation evapotranspiration index (SPEI) in the Loess Plateau under climate change from 2001 to 2050. Sci Total Environ. 595:191–200.
- Gocic M, Trajkovic S. 2013. Analysis of precipitation and drought data in Serbia over the period 1980–2010. J Hydrol. 494(12):32–42.
- Guo H, Bao A, Liu T, Ndayisaba F, He D, Kurban A, De Maeyer P. 2017. Meteorological drought analysis in the Lower Mekong Basin using satellite-based long-term CHIRPS product. Sustainability. 9(6):901–922.
- Guo H, Chen S, Bao A, Hu J, Gebregiorgis AS, Xue X, Zhang X. 2015. Inter-comparison of high-resolution satellite precipitation products over Central Asia. Remote Sens. 7(6):7181–7211.
- Gupta HV, Kling H, Yilmaz K, Martinez G. 2009. Decomposition of the mean squared error and NSE performance criteria: implications for improving hydrological modelling. J Hydrol. 370:80–91.
- Hou A, Kakar R, Neeck S, Azarbarzin A, Kummerow C, Kojima M, Oki R, Nakamura K, Iguchi T. 2013. The global precipitation measurement mission. Bull Am Meteorol Soc. 95(5):701–722.
- Hsu K, Gao X, Sorooshian S, Gupta H. 1997. Precipitation estimation from remotely sensed information using artificial neural networks. J Appl Meteorol. 36(9):1176–1190.
- Huffman G, Adler R, Arkin P, Chang A, Ferraro R, Gruber A, Janowiak J, McNab A, Rudolf B, Schneider U. 1997. The Global Precipitation Climatology Project (GPCP) combined precipitation dataset. Bull Am Meteorol Soc. 78(1):5–20.
- Huffman GJ, Bolvin DT, Nelkin EJ, Wolff DB, Adler RF, Gu G, Hong Y, Bowman KP, Stocker EF. 2007. The TRMM multisatellite precipitation analysis (TMPA): quasi-global, multiyear, combined-sensor precipitation estimates at fine scales. J Hydrometeorol. 8(1):38–55.
- Ionita M, Scholz P, Chelcea S. 2016. Assessment of droughts in Romania using the Standardized Precipitation Index. Nat Hazards. 81(3):1483–1498.
- Jesús DA, Breña-Naranjo JA, Pedrozo-Acuña A, Yamanaka V. 2016. The use of TRMM 3b42 product for drought monitoring in Mexico. Water. 8(8):325–343.
- Joyce RJ, Janowiak JE, Arkin PA, Xie P. 2004. CMORPH: a method that produces global precipitation estimates from passive microwave and infrared data at high spatial and temporal resolution. J Hydrometeorol. 5(3):487–503.
- Kao SC, Govindaraju RS. 2010. A copula-based joint deficit index for droughts. J Hydrol. 380(1–2):121–134.
- Katsanos D, Retalis A, Tymvios F, Michaelides S. 2016. Analysis of precipitation extremes based on satellite (CHIRPS) and in situ dataset over Cyprus. Nat Hazards. 83(S1):53–63.
- Kendall MG. 1975. Rand correlation methods. London, UK: Charles Griffin.
- Khan SI, Hong Y, Gourley JJ, Khattak MUK, Yong B, Vergara HJ. 2014. Evaluation of three high-resolution satellite precipitation estimates: potential for monsoon monitoring over Pakistan. Adv Space Res. 54(4):670–684.
- Kidd C, Bauer P, Turk J, Huffman G, Joyce R, Hsu K, Braithwaite D. 2012. Intercomparison of high-resolution precipitation products over Northwest Europe. J Hydrometeorol. 13(1):67–83.
- Kling H, Fuchs M, Paulin M. 2012. Runoff conditions in the upper Danube basin under an ensemble of climate change scenarios. J Hydrol. 424–425:264–277.
- Lai C, Zhong R, Wang Z, Wu X, Chen X, Wang P, Lian Y. 2019. Monitoring hydrological drought using long-term satellite-based precipitation data. Sci Total Environ. 649:1198–1208.
- Li Y, He D, Hu J, Cao J. 2015. Variability of extreme precipitation over Yunnan Province, China 1960–2012. Int J Climatol. 35(2):245–258.
- Li Y, He D, Ye C. 2008. Spatial and temporal variation of runoff of Red River Basin in Yunnan. J Geogr Sci. 18(3):308–318.
- Li Y, Ren F, Li Y, Wang P, Yan H. 2014. Characteristics of the regional meteorological drought events in Southwest China during 1960–2010. J Meteorol Res. 28(3):381–392.
- Li Y, Wang Z, Zhang Y, Li X, Huang W. 2019a. Drought variability at various timescales over Yunnan Province, China: 1961–2015. Theor Appl Climatol. 138(1–2):743–757. 10.1007/s00704-019-02859-z.
- Li Y, Zhang Y, He D, Luo X, Ji X. 2019b. Spatial downscaling of the tropical rainfall measuring mission precipitation using geographically weighted regression Kriging over the Lancang River Basin, China. Chin Geogr Sci. 39(3):446–462.
- Ma S, Wu Q, Wang J, Zhang S. 2017. Temporal evolution of regional drought detected from GRACE TWSA and CCI SM in Yunnan Province, China. Remote Sens. 9(11):1124–1139.
- Mahajan DR, Dodamani BM. 2016. Spatial and temporal drought analysis in the Krishna river basin of Maharashtra, India. Cogent Eng. 3(1):1–15.
- Mann HB. 1945. Nonparametric tests against trend. Econometrica 3:245–259.
- Masih I, Maskey S, Mussá F, Trambauer P. 2014. A review of droughts on the African continent: a geospatial and long-term perspective. Hydrol Earth Syst Sci. 18(9):3635–3649.
- McKee TB, Doesken NJ, Kleist J. 1993. The relation of drought frequency and duration to time scales. Proceedings of the 8th Conference on Applied Climatology; Anaheim, California:, 17–22 January 1993, 179–184.
- Mishra AK, Desai VR, Singh VP. 2007. Drought forecasting using a hybrid stochastic and neural network model. J Hydrol Eng. 12(6):626–638.
- Mishra AK, Singh VP. 2010. A review of drought concepts. J Hydrol. 391(1–2):202–216.
- Mishra S, Nagarajan R. 2011. Spatio-temporal drought assessment in Tel river basin using Standardized Precipitation Index (SPI) and GIS. Geomat Nat Hazards Risk. 2(1):79–93.
- Paredes-Trejo FJ, Barbosa HA, Kumar T. 2017. Validating CHIRPS-based satellite precipitation estimates in Northeast Brazil. J Arid Environ. 139:26–40.
- Qin Y, Chen Z, Shen Y, Zhang S, Shi R. 2014. Evaluation of satellite rainfall estimates over the Chinese Mainland. Remote Sens. 6(11):11649–11672.
- Sen P. 1968. Estimates of the regression coefficient based on Kendall’s Tau. J Am Stat Assoc. 63(324):1379–1389.
- Shen Y, Xiong A, Hong Y, Yu J, Pan Y, Chen Z, Saharia M. 2014. Uncertainty analysis of five satellite-based precipitation products and evaluation of three optimally merged multi-algorithm products over the Tibetan Plateau. Int J Remote Sens. 35(19):6843–6858.
- Siuki SK, Saghafian B, Moazami S. 2017. Comprehensive evaluation of 3-hourly TRMM and half-hourly GPM-IMERG satellite precipitation products. Int J Remote Sens. 38(2):558–571.
- Stampoulis D, Anagnostou EN. 2012. Evaluation of global satellite rainfall products over continental Europe. J Hydrometeorol. 13(2):588–603.
- Stisen S, Sandholt I. 2010. Evaluation of remote-sensing-based rainfall products through predictive capability in hydrological runoff modelling. Hydrol Process. 24(7):879–891.
- Sun Q, Miao C, Duan Q, Ashouri H, Soroosh S, Hsu K. 2018. A review of global precipitation data sets: data sources, estimation, and intercomparisons. Rev Geophys. 56(1):79–107.
- Tabari H, Marofi S, Aeini A, Talaee PH, Mohammadi K. 2011. Trend analysis of reference evapotranspiration in the western half of Iran. Agric Forest Meteorol. 151(2):128–136.
- Tan M, Chua V, Tan K, Brindha K. 2017. Assessment of TRMM 3B43 product for drought monitoring in Singapore. Remote Sens Agric Ecosyst Hydrol. 10421:1–6.
- Tan M, Tan K, Chua V, Chan N. 2017. Evaluation of TRMM product for monitoring drought in the Kelantan river basin, Malaysia. Water. 9(1):57–72.
- Tao H, Fischer T, Zeng Y, Fraedrich K. 2016. Evaluation of TRMM 3B43 precipitation data for drought monitoring in Jiangsu Province, China. Water. 8(6):221–234.
- Toté C, Patricio D, Boogaard H, Van der Wijngaart R, Tarnavsky E, Funk C. 2015. Evaluation of Satellite Rainfall Estimates for Drought and Flood Monitoring in Mozambique. Remote Sens. 7(2):1758–1776.
- Tuo Y, Duan Z, Disse M, Chiogna G. 2016. Evaluation of precipitation input for SWAT modeling in Alpine catchment: a case study in the Adige River Basin (Italy). Sci Total Environ. 573:66–82.
- WMO. 2012. Standardized precipitation index user guide In: Svoboda M, editor. WMO-No. 1090. Geneva, Switzerland: WMO.
- Yan G, Liu Y, Chen X. 2018. Evaluating satellite-based precipitation products in monitoring drought events in southwest China. Int J Remote Sens. 39(10):3186–3214.
- Yan Z, Zhang Y, Zhou Z, Han N. 2017. The spatio-temporal variability of droughts using the standardized precipitation index in Yunnan, China. Nat Hazards. 88(2):1023–1042.
- Yu W, Shao M, Ren M, Zhou H, Jiang Z, Li D. 2013. Analysis on spatial and temporal characteristics drought of Yunnan Province. Acta Ecol Sin. 33(6):317–324.
- Zambrano F, Wardlow B, Tadesse T, Mario L, Lagos O. 2017. Evaluating satellite-derived long-term historical precipitation datasets for drought monitoring in Chile. Atmos Res. 186:26–42.
- Zhang D, Yan D, Lu F, Wang Y, Feng J. 2015. Copula-based risk assessment of drought in Yunnan province, China. Nat Hazards. 75(3):2199–2220.
- Zhang Y, Li Y, Ji X, Luo X, Li X. 2018a. Evaluation and hydrologic validation of three satellite-based precipitation products in the Upper Catchment of the Red River Basin, China. Remote Sens. 10(12):1881–1903.
- Zhang Y, Li Y, Ji X, Luo X, Li X. 2018b. Fine-resolution precipitation mapping in a mountainous watershed: geostatistical downscaling of TRMM products based on environmental variables. Remote Sens. 10(1):119–146.
- Zhong R, Chen X, Lai C, Wang Z, Lian Y, Yu H, Wu X. 2019. Drought monitoring utility of satellite-based precipitation products across mainland China. J Hydrol. 568:343–359.
- Zhong S, Wang C, Yang Y, Huang Q. 2018. Risk assessment of drought in Yun-Gui-Guang of China jointly using the Standardized Precipitation Index and vulnerability curves. Geomat Nat Hazards Risk. 9(1):892–918.
- Zhou Q, Yang S, Zhao C, Cai M, Luo H, Luo Y, Hou L. 2016. Development and implementation of a spatial unit non-overlapping water stress index for water scarcity evaluation with a moderate spatial resolution. Ecol Indic. 69:422–433.