
 ?Mathematical formulae have been encoded as MathML and are displayed in this HTML version using MathJax in order to improve their display. Uncheck the box to turn MathJax off. This feature requires Javascript. Click on a formula to zoom.
Abstract
With global climate change, cities face the challenge of increasing flood disaster caused by heavy rainfall, and the prediction and assessment of flood disaster risk is a crucial step towards risk mitigation and adaptation planning. In this study, a method combining Bayesian network (BN) model and geographic information system (GIS), which can capture the potential relationships between factors impacting flood disaster and has capacity of quantifying uncertainty and utilizing both data and knowledge-based sources, was proposed to assess flood disaster risk. The proposed methodology was applied in a case study to assess flood disaster risk and to diagnose the reason for flood disaster in Zhengzhou City, and the results were validated by comparing with actual situation. The results show that that the relative error of very-low, low, moderate, high and very-high risk predicted by the proposed model is 12.57%, 13.21%, 2.23%, 19.63% and 21.65%, respectively, which demonstrates the discriminative power of the established model. Based on the spatial distribution of different risk levels, it can be recognized that the flood disaster risk in Zhengzhou City is decreasing from the middle to the surroundings. The results provide some basis for the field control and management of urban flood disaster.
1. Introduction
Expected increases in intensity and frequency of rainfall due to climate change, and increased paving and loss of water storage space in urban areas is making cities more susceptible to pluvial flooding. For example, the ‘7.21’ heavy rain in Beijing in 2012, the Chennai flood in 2015, as well as in 2018, the flood in Jakarta of Indonesia in February, the northern part of India, Zhengzhou and Shouguang City of China in July. A series of significant disasters on international communities, like damage to physical property, interruption of the production of goods and services and loss or impairment of human life, etc., were resulted from rainstorms and floods, threatening the security of society and impairing economic development in cities (Komolafe et al. Citation2019). It is therefore considerable to identify and assess the potential risk of flood disaster to avoid or manage the level of disaster change and to minimize potential damages.
In general, two methodologies were discussed to assess the flood disaster risk: qualitative and quantitative methods (Chen et al. Citation2015). Qualitative methods mainly include neural network (Zhao et al. Citation2019), comprehensive evaluation method based on fuzzy mathematics (Ming et al. Citation2018), Dempster–Shafer (D-S) evidence theory (Abdallah et al. Citation2013), and so on. However, these techniques are mostly based on knowledge or experience to determine indicator weight, which lacks the support of quantitative data and are subject to great subjective influence and as a result, the evaluation accuracy is not high. Compared with qualitative assessment that rely primarily on experiential knowledge, quantitative methods that formulate facts and uncover patterns in research based on measurable data is preferred by many researchers. Methods for quantitatively assessing flood disaster risk are often based upon numerical simulations, such as hydrological model and hydrodynamic model (Dang and Kumar Citation2017; Abdulrazzak et al. Citation2019). There are many commonly used models, such as SCS-CN (Kazak et al. Citation2018), SWMM (Huang and Jin Citation2019), DRAINMOD (Youssef et al. Citation2018), and so on. These models typically require various types of data such as rainfall data, basic geographic data and socio-economic data (Wu et al. Citation2019). The ability of models is limited by data limitation or data-sparse, such as invalid values of model parameters, inadequate or erroneous information needed to apply the models such as input and calibration data, the defective description of relationships among data, etc. However, in the real world, decision variables in a problem and their interrelations are often interdependent in a complex and uncertain way. In fact, the flood disaster risk was collectively formed by disaster drivers, disaster environment and disaster bearers, including many parameters and data (Ozdemir Citation2011). These decision variables and their interrelations are often interdependent in a complex and uncertain way. Disaster drivers such as extreme rainfall are the key factors of flood disaster, while disaster environment plays a vital role in the redistribution of rainfall. Meanwhile, the consequence caused by disaster drivers depends on the situation of disaster bearers, such as the number of people and impacted infrastructure. Based on the analysis above, qualitative methods lack data support, while quantitative methods cannot describe the relationship between data. The underlying question is how to take a more scientific method that can combine quantitative and qualitative analysis to assess flood disaster risk.
The Bayesian network (BN) model, a representative way of knowledge representation and reasoning, has many advantages, such as identifying relevant variables and their relationships in the form of graphical representation, using prior knowledge that can be learned from actual data to infer and reason (Couasnon et al. Citation2018). Therefore, BN model has become a significant tool for dealing with complex problem, which was widely used in intelligent reasoning (Napolitano et al. Citation2010), prediction (Poelhekke et al. Citation2016), risk analysis (Chen et al. Citation2019), and so on. GIS (geographic information system) is an appropriate tool for processing data with attributes for deriving regional indicators on flood disaster risk (Mahmoud and Gan Citation2018). It also has spatial data operations through powerful spatial analysis and geo-statistical functions for the spatial analysis of flood disaster risk assessment.
The objective of this study is to assess urban flood disaster risk by combing qualitative and quantitative analysis based on BN model and GIS. First, on the basis of factors influencing flood disasters risk, BN structure graph was established to capture the potential relationships among various influence factors. Then the probability distribution table of BN model was calculated based on historical disaster data. Finally, the flood disaster risk in Zhengzhou City was assessed and evaluated using the proposed model, and the distribution of flood disaster risk was obtained from GIS.
2. Materials and methods
2.1. Case study
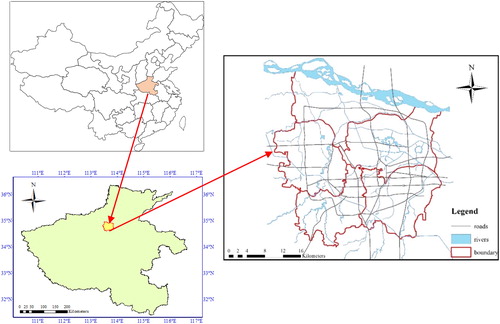
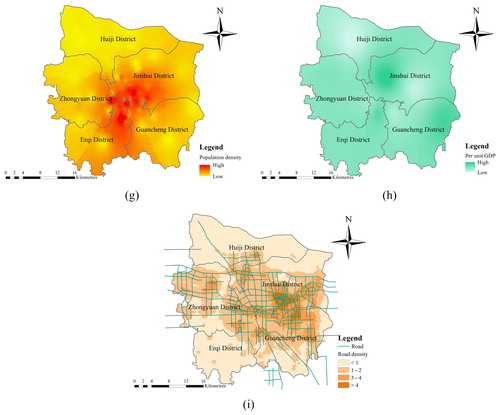
Zhengzhou, a city in north-central Henan Province, China, located between 112°42′ and 114°14′ eastern longitude and between 34°16′ and 34°58′ northern latitude, comprises an area of approximately 1010 km2 (). The area is characterized as lowland with an average altitude of 50 m, from the southwest to northeast, stepped down. The average slope in most of the wards (70% of the total area) is below 5° and only 2.2% of the districts have slope higher than 10°. Zhengzhou is one of the most populous cities in China and the most densely populated city in Henan province with about more than 4 million inhabitants. The selected region is in a temperate continental climate with a mean annual precipitation of 625.9 mm. The flood season, a period of frequent rainstorm and flood disaster, spans from July to September every year, during which the rainfall accounts for 60%–70% of the total annual rainfall. According to the statistics, Zhengzhou has suffered heavy rainstorms more than 15 times per year since 2006 and each time a flood disaster has caused more than 30 million dollars in economic losses.
Figure 1. Geographical location and specification of the study area.
2.2. BN model and GIS description
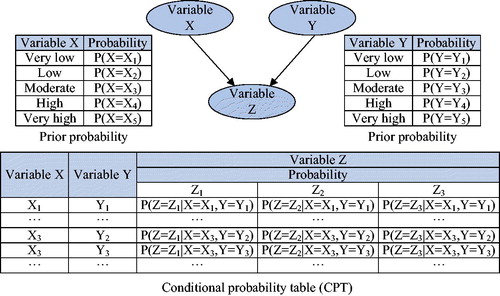
BN, also known as Bayesian Belief Network (BBN), composed by graphical structure and Bayes’ theorem, constitutes a widely accepted formalism for representing uncertain knowledge (subjective or objective) and for efficiently reasoning with it (Guarnieri et al. Citation2015; Abebe et al. Citation2018). A complete BN model, as presented in EquationEquation (1)(1)
(1) , contains a qualitative component and a quantitative one (Chen et al. Citation2019). The qualitative component of BN is a directed acyclic graph, where nodes and directed links signify system variables and their causal dependencies. The quantitative one of BN model is presented with a set of conditional probabilities or probability distributions for each child node given its parent nodes in the network.
(1)
(1)
where G is the BN structure graph,
V stands for the set of nodes, i.e.
denoting variables in flood disaster. E represents the set of directed edges that indicate the causal dependence between nodes, which generally points from the parent node to the child node; P expresses the parameters set of the BN, including the prior probability and the conditional probability distribution table (CPT) of nodes, denoting the strength of dependencies between nodes. It can be clearly seen from , where X, Y and Z represent random variables, and the arcs with arrow specify the dependencies of the variables. For example, X points to Z, indicating that X is the parent node of Z, whereas Z is the child node of X. X and Y have no parent node, which is also called root node. Root node has the prior probability, while the child node has no prior probability but conditional probability.
Figure 2. Representation of a simple BN model.
GIS is an appropriate tool for collecting and processing data with attributes for deriving regional indicators on flood risk (Bignami et al. Citation2018), which is a significant procedure in effective risk estimation. Building analytic units based on grids or administrative areas, GIS is capable of integrated modelling on natural conditions including climate, topography, hydrology, and other social and economic features. It also has intra-/inter-spatial data operations through powerful spatial analysis and geo-statistical functions for the spatial analysis of flood disasters and risk assessment.
2.3. The development of BN model
The general framework of assessing flood disaster risk based on BN model was presented in .
Figure 3. The general framework of assessing flood disaster risk based on BN model.
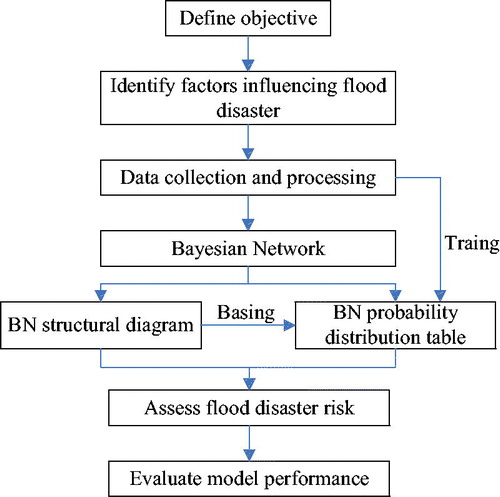
From , the proposed approach in this study consists of five procedures: (1) identification of the main factors (drivers of change) that can influence directly or indirectly the occurrence of flood disaster; (2) collection of data from the different data sources associated with the factors identified in the previous step; (3) development of the BN structural graph; (4) calculation of probability distribution table based on the BN structure and (5) the assessment of flood disaster risk and model evaluation.
2.3.1. Selection of criteria and risk factors
In order to identify the main factors affecting directly or indirectly urban flood disaster, a detailed questionnaire survey was designed to gather ideas on recent impacts of flood in the study area. Flood disaster survey was carried out in May 2019. The questionnaires were divided into three sections: (1) the interviewee information; (2) the characteristics of exposure (building, people or others) and (3) the memories of past flood events, with information on incurred damages and losses to cities. The influencing factors of flood disaster were also analyzed through the round tables with more than 10 experts in the field of flood disaster. Several competency questions were designed to consult them, such as ‘How is flood risk defined?’ ‘Which steps must be performed to assess flood disaster and which elements must be included in each step?’ and so on. Answering these questions helps further specify factors impacting flood disaster. What’s more, a review of the literature is one of the most important sources for determining the influencing factors of flood disaster. Most of the journals with the highest impact factors in the field of flood disaster and for each one, the most important publications for the last 10 years have been collected, and some studies that used a combination of factors in flood disaster risk assessment were summarized in .
Table 1. Factors influencing urban flood disaster used in previous studies.
Finally, taking the characteristics of the study area into account, the factors influencing flood disaster risk were identified. Factors that need to be considered when evaluating flood disaster risk are disaster drivers, disaster environment, disaster bearers, and each factor is composed of a series of sub-factors, all of which interactively influence and control the dynamic processes of flooding. Disaster drivers are defined as extreme (severe and prolonged) weather events that adversely affect human life, property and security. The flood disaster is closely related to the size of rainfall, the number of rainstorm days and the rainfall intensity. Since the rainfall intensity was calculated through the accumulated rainfall and rainfall duration, the accumulated rainfall and rainfall duration were used to characterize disaster drivers.
Disaster environment refers to conditions and surroundings where flood disaster occurred, determined by factors that mainly result from the combination of both climate variables and underlying surfaces. Urbanization has profoundly altered urban land cover, which affects the hydrology that determines flood disaster. Urban catchments have very low permeability and high rainfall-runoff conversion rates. Furthermore, micro-topography effects can cause localized drainage system failures (Mousavi et al. Citation2019). Masoudian and Theobald (Citation2011) studied the effect of topography on flood parameters, such as maximum flood discharge and time to peak. Besides, several studies suggested that the flood disaster also impacted by the distribution of rivers in cities (Abebe et al. Citation2018; Bouzembrak and Marvin Citation2019). Therefore, the elevation, slope, river network and impermeable area were considered as the most important factors for flood disaster risk assessment, which play a vital role in the redistribution of floods.
Disaster bearers are articulated into the human being and social properties affected by the disaster and its damage. The flood disaster is not only related to rainfall and urban environment, but also to resilience and adaptability of a region. For example, the damage caused by flooding is very serious in densely populated areas. The regions with prosperous economy and convenient transportation show that these areas have higher adaptability to disaster. Therefore, in this work, population density, road density, and per unit GDP were considered as measuring elements of resilience and adaptability. Flood disaster is resulted from the inability of the disaster bearers to adapt or mediate environmental changes, such as extreme rainfall events.
2.3.2. Overview of the collected data
The BN model for urban flood disaster was developed using the historical case data during the period 2010–2017 and the flood disaster risk in Zhengzhou City from 16 August to 20 August 2018 was predicted and evaluated. Consequently, the raw data related to topography, climatology, river network and land cover in this study were collected according to the factors influencing flood disaster defined above. All datasets were then projected, resampled to a 200 m grid cell, clipped to the study area and registered, so all input grids accurately overlaid with the same projection, cell size and extent. In this paper, Zhengzhou City has been classified into 24,775 grid cells. Except for zones near the city’s boundary, all grid cells have an area of 0.04 square kilometers. The data collection and processing are discussed below, and some of the data were presented in in the Appendix.
(1) Rainfall
Rainfall data from 2010 to 2018 was obtained from the China Meteorological Science Data Sharing Network (http://data.cma.cn) and the Rainfall Station in Zhengzhou City. Two indices were derived from this: rainfall duration that is the number of days from the onset of a rainstorm to the end of a flood, and accumulated rainfall that is defined as the total amount of rainfall during a flood. There are 13 rainfall stations in and around the city of Zhengzhou (). Based on these stations, rainfall for all parts of the city was calculated using kriging interpolation.
Figure 4. Data collection of flood disaster in Zhengzhou City: (a) accumulated rainfall, (b) elevation, (c) slope, (d) river density, (e) river proximity, (f) impervious area ratio, (g) population density, (h) per unit GDP, (i) road density.
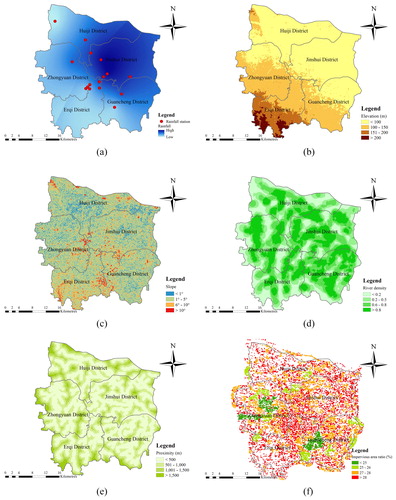
(2) Topographic characteristics
Topography has a significant influence on flood formation and redistribution. Elevation and slope are regarded as the influencing factors of terrain in flood disaster. Elevation is commonly represented by the vertical distance from certain surface to the reference basement. Slope is a measure of the average rate of change of elevation in a given domain. Both elevation and slope in each study grid cells were generated from the Digital Elevation Model (DEM) at a 30 m resolution, which was downloaded from the Geospatial Data Cloud Service Platform. And then the two terrain factors are reclassified in ArcGIS 10.3, which were divided into four levels by block statistics and grid algebra calculation, as shown in , respectively.
(3) River network
Zhengzhou is bordered by Yellow River to the north and located in upstream of Jia Lu River, through which several rivers flow before joining the Huai River, which were collected from National Bureau of Surveying and Mapping Geographic Information. The distribution of river network plays a crucial role in flood disaster, especially the density of river and the distance to the river. So, two indices – river density and river proximity – were designed to account for flood inundation. River density refers to the length of rivers per unit area, which was calculated from the Line Density function using 200 m radius, and river proximity shows the distance to the closest river, which was obtained using the Multiple Buffer operator, shown in , respectively.
(4) Land cover
Land cover is one of the most important underlying factors in the disaster environment, which can also be downloaded from National Bureau of Surveying and Mapping Geographic Information. Of particular interest for this study is the relative proportion of paved surfaces and impervious area. Therefore, impervious area was estimated by summing up buildings, roads and other paved surfaces. Paved surfaces divided by the total area is the ratio of impervious area that is recognized as one of the indicators of impacting flood disaster, as shown in .
(5) Social and economic features
The flood disaster is not only related to rainfall and urban conditions but also to the resilience and adaptability of a region. In densely populated areas, the damage caused by flooding is very serious, which could be at high risk. The regions with prosperous economy and convenient transportation show that these areas have higher adaptability to disasters. Therefore, in this study, population density, road density, and per unit GDP were considered as measuring elements of resilience and adaptability, which can be collected from Zhengzhou Statistical Yearbook and exhibited using ArcGIS, as shown in . Flood disaster is resulted from the inability of the disaster bearers to adapt or mediate environmental changes, such as extreme rainfall events.
Since BN model generally deals with discrete probabilities, each node is classified into a finite set of state values accompanying with a probability. For this reason, it is necessary to discretize all relevant factors. The factors affecting flood disasters were grouped into four classes, as summarized in , where accumulated rainfall, rainfall duration, elevation, slope, river density and proximity were classified according to recent works (Chen et al. Citation2015; Yoon et al. Citation2016; Lin et al. Citation2017). The impervious area ratio, road density, population density and per unit GDP were divided through the statistics of land, population and economy of case study and the information of historical disaster cases.
Table 2. Classification of different risk factors.
2.3.3. Model established
Based on the hazardous factors defined, the BN model for flood disaster risk evaluation was developed, and the technical procedure was composed by two steps: structural learning and parameter learning, so-called training. The BN structure graph depicts the potential relationships between factors influencing flood disaster through a directed acyclic graph. The factors impacting flood disaster defined in Section 2.3.1 were regarded as nodes in the BN structure graph, while the potential relationships between various influencing factors were seen as the relationships among different nodes. In this study, the potential relationships between various factors were determined by the genetic mechanism of flood disaster, experts’ experience and empirical knowledge.
Given the BN structure graph, certain learning algorithms, such as Bayesian estimation and maximum likelihood estimation can be used for parameter learning through training from sample data to determine the conditional probability distribution among related variables (Vogel et al. Citation2014). The maximum likelihood estimation algorithm is generally used for large data size and the parameters estimated using this tool coincide well with the actual state. In this research, many data related to rainstorms and floods could be gathered from various data sources, so the maximum likelihood estimation algorithm is more suitable for parameter learning in this paper. This method seeks to find the parameters that maximize the likelihood function, and the working principle is as follows (Han and Coulibaly Citation2017):
It is assumed that the observed data set is independent and uniformly distributed, and the likelihood function of D is functional to the model parameters, which can be computed as:
(2)
(2)
where
represents an unknown parameter;
refers to the structure of BN. Since the observed data set D has been determined, the parameters can be obtained by maximizing the likelihood function.
In parameter learning, the updated probability for the m number of mutually exclusive variables or parameters and given evidence or data D, was determined by the following relationship:
(3)
(3)
where
is the posterior probability of V based on the data or evidence D;
refers to the prior probability;
denotes the conditional probability.
The proposed model was evaluated by comparing with actual situation. Zhengzhou City has been divided into 24,775 grid cells. The number of grid cells per risk class for predicted and actual conditions were counted, respectively. The prediction accuracy of BN model was quantified by analyzing relative error of prediction, which is defined as follows:
(4)
(4)
where Re refers to the relative error of prediction;
and
denote the number of cell grids for predicted and actual, respectively.
As a large amount of data was collected and processed in this study with high computational workload and difficulty, the machine learning method was proposed to develop and test BN model. Examples of software commonly used in constructing BN are MATLAB-BNT, Netica, GeNIe (Lohr et al. Citation2017; Sahin et al. Citation2019). GeNIe provides an interface for introducing data, where data can be directly imported from Excel or database. Besides, it not only has a variety of algorithms that is helpful for structure and parameter learning, which facilitates logical reasoning of the problem being studied, but performs sensitivity analysis on simple graphs to calculate their impact on the results. Acknowledging these qualities, GeNIe software was used for accomplishing the construction, reasoning and verification of BN model.
3. Results and discussion
3.1. Construction of BN for urban flood disaster risk evaluation
BN model for flood disaster risk evaluation in Zhengzhou City was established using the methodologies presented in above. The developed model, the nodes together with their corresponding states, were presented in . The model contains four groups of factors: (1) flood disaster (white node): the level of flood disaster risk was classified according to the probability of flood disaster; (2) a group of disaster drivers’ factors (blue nodes), namely: accumulated rainfall and rainfall duration; (3) a group of disaster environment (red nodes) that are river density, proximity, elevation, slope and impervious area ratio and (4) factors of disaster bearers (yellow nodes) which include population density, road density and per unit GDP. The state of these nodes is given in the squares (e.g. the node ‘Elevation’ has different altitudes such as low, moderate, high or serious). In each square, the bars represent the probabilities of the state, expressed as percentage. For example, the node of ‘Elevation’, with reference to risk classification defined in , 57% of the elevation are below 100 m that is represented using the state of ‘low’; ‘moderate’ indicates that the elevation is between 101 and 150 m with a probability of 32%; ‘high’ means that elevation ranges from 151 to 200 m and its probability is 8%, and ‘serious’ indicates that the probability of being over 200 m is 2%. The node of ‘flood disaster’ expresses the probability of flood disaster, and the flood disaster risk was classified into different grades through these probability values. Therefore, according to these probability values and based on the characteristics of case study, the risk of flood disaster was divided into five grades: very-low, low, moderate, high and very-high, and their corresponding probability were presented in , respectively. From this table, if the probability of flood disaster calculated in BN model is less than 0.2, showing that the risk of flood disaster is less likely, it can be regarded as very-low risk. That’s how the rest of the grades were determined.
Figure 5. BN model for flood disaster risk assessment.
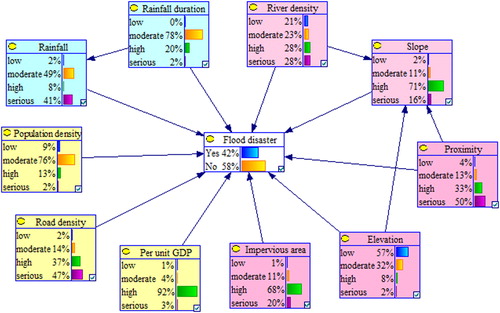
Table 3. Classification of flood disaster risk.
From , it is noted that the remaining 10 factors directly or indirectly affect the occurrence of flood disaster. The connected nodes have potential relationship, among which the initial node of the arrow is the cause while the pointing node is the effect. This potential relationship can be expressed by the conditional probability calculated based on historical data (EquationEquation (3)(3)
(3) ), which can be queried by attribute of each node. Taking the node ‘slope’ as an example, the conditional probabilities of this node were shown in in the Appendix, which allowed several queries of conditional probabilities of different states.
3.2. Assessment of urban flood disaster risk based on BN
Using the developed BN model under the specific 2010–2018 conditions, the expected probability values of flood disaster risk for all the 24,775 grid cells in Zhengzhou City were respectively predicted and summarized in . The summarized results in emphasize the changes between risk classes aggregated per cell, which can be a good quantitative measure of the performance of BN model. In this table, the number of cells corresponding to different levels of risk for actual flood disaster conditions were obtained from historical case information, while the number of grids for prediction were obtained from the proposed model. It can be seen that most grids record a low or moderate risk, while few cells are at very-high risk. Further analysis was shown in .
Figure 6. The distribution of flood disaster risk obtained from BN model.
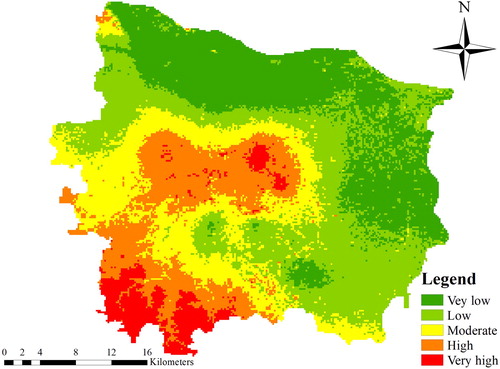
Table 4. The number of grid cells per risk class for predictive and actual conditions.
In , a flood disaster risk map was delineated as an output from the BN model. For each risk class, combined with the relevant data in , the percentage of the study area was calculated. About 19% of the total study area was classified as very-low risk and 34% is low risk, suggesting that these regions are less likely to suffer from flood disaster, whereas 16% grids were found to have high risk, plus another 8% were very-high risk. From the pattern, the downtown areas could be at high risk, while the eastern and northern areas that are new city zone with low density of property and population have low risk. Overall, it can be recognized in that the flood disaster risk in Zhengzhou City is decreasing from the middle to the surroundings, which is basically consistent with the results of other studies in this area (Lin et al. Citation2017), devoting to risk management of urban flood disaster. Therefore, according to these results, strategies to cope with and prevent flood disaster should be proposed to reduce losses for different regions. For example, in low-risk areas, risk reduction should be targeted towards individual protection, especially the elder and children. While for the high and very-high risk, measures should be targeted towards building municipal economic support funds to help affected inhabitants (after a flash-flood event) during the recovery phase. Moreover, in high and very-high risk area, it is necessary to employ more advanced methods for forecasting rainfall and encourage the application of new technology, such as radar and remote sensing to improve forecast accuracy and lead time.
3.3. Model performance
The predicted probability of flood disaster risk was validated by comparing with the number of grid cells of actual disaster situation. Based on the statistical results, EquationEquation (4)(4)
(4) was used to calculate the relative error of this method, as shown in . According to the comparison of relative errors, the model has the smallest error in the prediction of moderate risk, followed by low and very-low risk, whose relative error is within 15%. The relative error of very-high risk is the highest, at 21.65%. It can be concluded that compared with low and moderate risks, the prediction of high and very-high risks by this model is poor, which may be due to the spatial aggregation of high-risk areas.
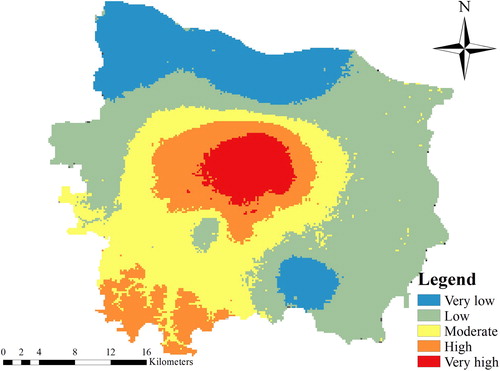
Moreover, the distribution of actual flood disaster risk obtained from historical case was used as a surrogate for ground truth for the verification of the results obtained from BN model. The distribution of flood disaster risk was obtained from the case of historical disaster case of Zhengzhou City, as shown in , which provides a partial verification of the modelling approach. Since the north and east are new city zones with low urbanization rate and population density, most of them were at low and very-low risk, coinciding well with the locations derived from predictive results using developed BN model. Compared with low risk, this model was unsatisfactory in high and very high risk. Wards being at very-high risk were mainly located in the central with high urbanization rate, flat terrain and dense population, whereas the high-risk areas obtained from BN model were located at the middle and southwest. It is speculated this may be due to the higher terrain in southwest, so the flood disaster risk is lower than expected. It can be observed that although there are still certain mismatches between predicted and actual conditions, the developed flood disaster risk evaluation model can predict the general distributed trends of flood disaster risk. From the above analysis, it is concluded that distinguishing from the previous studies of determining index weight based on empirical knowledge, the constructed BN model can objectively determine relationships among different influencing factors and quantitatively infers the probability of flood disaster risk based on a large number of historical disaster data, which effectively reduces the subjectivity and uncertainty in the evaluation and provides a new way for flood disaster risk assessment.
Figure 7. The distribution of flood disaster risk obtained from historical disaster cases.
3.4. Sensitivity analysis
Because many factors are being produced with different sets of input variables, the BN model learns and records the relative importance of the input variables in predicting the output. Sensitivity analysis was applied in the BN model to find variables that strongly affect the behaviour of a system and to determine variables that are not very sensitive to changes in the process of assessing flood disaster risk (Bouzembrak and Marvin Citation2019). The sensitivity to different factors for the target node ‘flood disaster’ was presented in . The depth of node colour demonstrates the sensitivity. And the sensitivity value of each factor influencing flood disaster risk was exhibited in that summarized the parameters according to their level of influence on flood disaster. According to the sensitivity values of different factors, variables related to disaster drivers, i.e. rainfall and duration, have the greatest impact on flood disaster, followed by population density, road density and per unit GDP, which affects the possibility of flood disaster to some extent. It should be noted that although the sensitivity value of some factors is low, it does not mean these are not vital elements in pluvial flood, which is particularly evident for variables related to disaster environment (e.g. elevation, slope, river network, etc.). Among the many factors affecting the flood disaster risk in Zhengzhou City, the variables related to disaster drivers are the most influential factors on flood disaster, followed by disaster bearers, while the impact of disaster environment is relatively weak. Several reasons can be used to explain this. Zhengzhou City is characterized as lowland, and there are little changes in elevation and slope. The elevation and slope have direct effect on trend of most rivers. Therefore, disaster environment has lower sensitivity value, partly due to their almost uniform across the case study, which has an unnoticeable impact on the flood disaster. In view of this sensitivity analysis, it is necessary to strengthen the rainstorm forecast in the future to prevent the occurrence of disasters in advance. This can be achieved by applying more advanced methods for forecasting rainfall, encouraging the application of new technology, such as radar and remote sensing to improve forecast accuracy and lead time, and so on. In addition, it is important to facilitate economic development and enhance the individual and collective adaptability to reduce the losses caused by flood (Abebe et al. Citation2018).
Figure 8. Sensitivity analysis showing the effect of each factor on flood disaster.
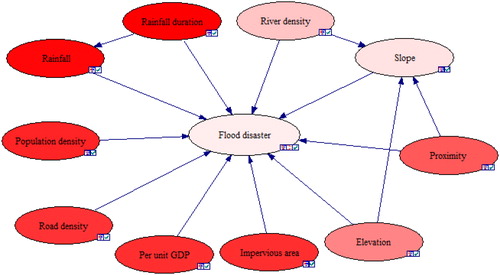
Table 5. Sensitivity value of different nodes to the flood disaster.
3.5. Comparisons with other methods
Some experts have used BN model to assess flood disaster vulnerability. The most representative study was developed by Abebe et al. (Citation2018). Urban flood disaster vulnerability in Toronto was assessed using BBN model, and the results were validated by comparing with the number of approved basement flood subsidy protection programme applications (BFSPP). However, in this study, the BBN model focused more on describing the impact of various factors on vulnerability, but fails to fully describe the relationships between the flood disaster influencing factors. What’s more, the conditional probabilities in BBN were learned using expectation-maximization that is suitable for less data, while the maximum likelihood estimation used in our study seems to be more general. It is important to have high-resolution data to conduct a more robust investigation. In the BBN model, the city of Toronto was classified into 760 grid cells at a 1 km resolution, which may be not meet the requirements of high-precision evaluation. As for the model evaluation, the approved BFSPP was used to validate the prediction output in the research developed by Abebe et al. (Citation2018), which may be not applicable in most of the cities that are lack of BFSPP. Compared with this, it is more universal to evaluate the model performance evaluated based on relative error.
Besides, Lin et al. (Citation2017) proposed a flood disaster vulnerability evaluation method based on analytic hierarchy process (AHP) in Zhengzhou City. The results show that the flood disaster vulnerability in central and eastern regions appears to be high, which is in agreement with the distribution of risk obtained from the present study, but the results obtained from BN model are more reasonable than the one based on AHP. The determination of index weight based on AHP lacks the support of quantitative data and has great subjectivity, while the BN model established in this study takes advantage of objective data, which reduces the uncertainty caused by the determination of index weight and as a result, the results of flood disaster assessment are more accurate and reliable.
It is expected that the methodologies adopted in this paper would better predict such flood events with BN model. There are still many problems in the research, such as the accuracy of data, the comprehensiveness of indicators. So how to obtain high-quality data and constantly improve the evaluation index system is the focus of future study. Besides, all the data were discretized for use in BN model. Discretization breaks of numeric variables are either suggested by experts or uniformly distributed, lacking hypotheses on which to base discretization, further analysis could focus on the effect of discretization.
4. Conclusions
A method for the assessment of flood disaster risk was proposed, where spatial grid data for input, storage, analysis, and mapping was explicitly processed using GIS and flood disaster risk was assessed and analyzed based on BN model. The case study revealed that the relative error of very-low, low, moderate, high and very-high risk predicted by the BN model is 12.57%, 13.21%, 2.23%, 19.63% and 21.65%, respectively, which demonstrates the discriminative power of the established model. Based on the spatial distribution of different risk levels, it can be recognized that the flood disaster risk in Zhengzhou City is decreasing from the middle to the surroundings. The proposed methodology in this paper is distinct from previous researches that predict the probability of flood disaster risk deterministically, giving additional insight for the decision-makers into the uncertainty related to the analysis, which also has significant implications to risk assessment in other fields.
However, there is much room for further improvement. The established BN model in this study was not comprehensive, and more factors influencing flood disaster, such as drainage pipe network in city, must be included in the future. Besides, the accuracy of the model needs further improvement by improving data quality.
Acknowledgements
The authors thank the anonymous reviewers for their valuable comments.
Disclosure statement
No potential conflict of interest was reported by the authors.
Table A1. Conditional probability distribution of node ‘Slope’.
Table A2. Part of the data needed to establish BN model.
Additional information
Funding
References
- Abdallah NB, Mouhousvoyneau N, Denoeux T. 2013. Using Dempster-Shafer theory to model uncertainty in climate change and environmental impact assessments. 16th International Conference on Information Fusion; July 9–12; Istanbul, Turkey, hal-00932975.
- Abdulrazzak M, Elfeki A, Kamis A, Kassab M, Alamri N, Chaabani A, Noor K. 2019. Flash flood risk assessment in urban arid environment: case study of Taibah and Islamic universities’ campuses, Medina, Kingdom of Saudi Arabia. Geomat Nat Hazards Risk. 10(1):780–796.
- Abebe Y, Kabir G, Tesfamariam S. 2018. Assessing urban areas vulnerability to pluvial flooding using GIS applications and Bayesian Belief Network model. J Clean Prod. 174:1629–1641.
- Bignami DF, Dragoni A, Menduni G. 2018. Assessing and improving flood and landslide community social awareness and engagement via a web platform: the case of Italy. Inter Journal of Disa Risk Scie. 9(4): 530–540. http://doi.org/10.1007/s13753-018-0199-0.
- Bouzembrak Y, Marvin HJP. 2019. Impact of drivers of change, including climatic factors, on the occurrence of chemical food safety hazards in fruits and vegetables: a Bayesian Network approach. Food Control. 97:67–76.
- Chen J, Zhong PA, An R, Zhu FL, Xu B. 2019. Risk analysis for real-time flood control operation of a multi-reservoir system using a dynamic Bayesian Network. Environ Model Softw. 111:409–420.
- Chen Y, Liu R, Barrett D, Gao L, Zhou M, Renzullo L, Emelyanova I. 2015. A spatial assessment framework for evaluating flood risk under extreme climates. Sci Total Environ. 538:512–523.
- Couasnon A, Sebastian A, Morales-Napoles O. 2018. A Copula-based Bayesian Network for modeling compound flood hazard from riverine and coastal interactions at the catchment scale: an application to the Houston Ship Channel, Texas. Water. 10(9):1–19.
- Dang ATN, Kumar L. 2017. Application of remote sensing and GIS-based hydrological modelling for flood risk analysis: a case study of District, Ho Chi Minh city, Vietnam. Geomat Nat Hazards Risk. 8(2):1792–1811.
- Darabi H, Choubin B, Rahmati O, Haghighi AT, Pradhan B, Klove B. 2019. Urban flood risk mapping using the GARP and QUEST models: a comparative study of machine learning techniques. J Hydrol. 569:142–154.
- Guarnieri A, Masiero A, Vettore A, Pirotti F. 2015. Evaluation of the dynamic processes of a landslide with laser scanners and Bayesian methods. Geomat Nat Hazards Risk. 6(5–7):614–634.
- Han S, Coulibaly P. 2017. Bayesian flood forecasting methods: a review. J Hydrol. 551:340–351.
- Huang M, Jin S. 2019. A methodology for simple 2-D inundation analysis in urban area using SWMM and GIS. Nat Hazards. 97(1):15–43.
- Kazak J, Chruściński J, Szewrański S. 2018. The development of a novel decision support system for the location of green infrastructure for stormwater management. Sustainability. 10(12):4388.
- Komolafe AA, Herath S, Avtar R. 2019. Establishment of detailed loss functions for the urban flood risk assessment in Chao Phraya River basin, Thailand. Geomat Nat Hazards Risk. 10(1):633–650.
- Lin L, Hu C, Wu Z. 2017. Assessment of flood hazard based on underlying surface change by using GIS and analytic hierarchy process. International Conference on Geo-Informatics in Resource Management & Sustainable Ecosystems; September 25–26; Handan, China; Singapore: Springer. Vol. 698, p. 589–599.
- Lohr C, Wenger A, Woodberry O, Pressey RL, Morris K. 2017. Predicting island biosecurity risk from introduced fauna using Bayesian belief networks. Sci Total Environ. 601–602:1173–1181.
- Mahmoud SH, Gan TY. 2018. Urbanization and climate change implications in flood risk management: developing an efficient decision support system for flood susceptibility mapping. Sci Total Environ. 636:152–167.
- Masoudian M, Theobald S. 2011. Influence of land surface topography on flood hydrograph. J Am Sci. 7(11):354–361. http://www.americanscience.org.
- Ming T, Huchang L, Zongmin L, Zeshui X. 2018. Nature disaster risk evaluation with a group decision making method based on incomplete hesitant fuzzy linguistic preference relations. Int J Environ Res Public Health. 15(4):751.
- Mousavi SM, Roostaei S, Rostamzadeh H. 2019. Estimation of flood land use/land cover mapping by regional modelling of flood hazard at sub-basin level case study: Marand basin. Geomat Nat Hazards Risk. 10(1):1155–1175.
- Napolitano G, See L, Calvo B, Sav, F, Heppenstall A. 2010. A conceptual and neural network model for real-time flood forecasting of the Tiber River in Rome. Phys & Chem of the Eart Parts A/b/c. 35(3):187–194.
- Ozdemir A. 2011. Landslide susceptibility mapping using Bayesian approach in the sultan mountains (AkAYehir, Turkey). Nat Hazards. 59(3):1573–1607.
- Poelhekke L, Jager WS, Van Dongeren A, Plomaritis TA, Mccall R, Ferreira Q. 2016. Predicting coastal hazards for sandy coasts with a Bayesian network. Coast Eng. 118:21–34.
- Sahin O, Stewart RA, Faivre G, Ware D, Tomlinson R, Mackey B. 2019. Spatial Bayesian Network for predicting sea level rise induced coastal erosion in a small Pacific Island. J Environ Manage. 238:341–351.
- Sharma SVS, Roy PS, Chakravarthi V, Rao GS. 2018. Flood risk assessment using multi-criteria analysis: a case study from Kopili River Basin, Assam, India. Geomat Nat Hazards Risk. 9(1):79–93.
- Vogel K, Riggelsen C, Korup O, Scherbaum F. 2014. Bayesian network learning for natural hazard analyses. Nat Hazards Earth Syst Sci. 14(9):2605–2626.
- Wu Z, Shen Y, Wang H. 2019. Assessing urban areas’ vulnerability to flood disaster based on text data: a case study in Zhengzhou City. Sustainability. 11(17):4548.
- Yoon DK, Kang JE, Brody SD. 2016. A measurement of community disaster resilience in Korea. J Environ Plan Manage. 59(3):436–460.
- Youssef MA, Abdelbaki AM, Negm LM, Skaggs RW, Thorp KR, Jaynes DB. 2018. DRAINMOD-simulated performance of controlled drainage across the U.S. Midwest. Agric Water Manage. 197:54–66.
- Zhao G, Pang B, Xu ZX, Peng DZ, Xu LY. 2019. Assessment of urban flood susceptibility using semi-supervised machine learning model. Sci Total Environ. 659:940–949.