
 ?Mathematical formulae have been encoded as MathML and are displayed in this HTML version using MathJax in order to improve their display. Uncheck the box to turn MathJax off. This feature requires Javascript. Click on a formula to zoom.
Abstract
The rainfall erosivity in China have shown different change characteristics and patterns at different spatial–temporal scales. In this article, we introduced a gravity centre model for use in studying and analyzing the spatial–temporal distribution patterns of rainfall erosivity in China in the past 58 years combined with traditional geostatistical analysis methods at different spatial–temporal scales. During 1961–2018, rainfall erosivity in China showed a decreasing trend from southeast to northwest in spatial distribution. Moreover, the spatial distribution patterns of the annual average rainfall erosivity had been negatively affected by altitude. In terms of interannual variability, rainfall erosivity had shown a fluctuating upward trend in the past 58 years, with a steep upward slope in 1982 and a steep downward slope in 1990. In the past 58 years, the gravity centre of rainfall erosivity in China had moved southeastward, which indicated that the increment and increasing rate of rainfall erosivity in eastern and southern China were greater than those in western and northern China. These results could provide important data to support decisions regarding the prevention and control of soil erosion at regional and national scales.
1. Introduction
Rainfall erosivity refers to the potential soil erosive ability of rainfall, which is a main dynamic factor in soil erosion (Wischmeier and Smith Citation1958). This issue is of great significance for soil erosion research and water and soil conservation in China for the accurate evaluation of the erosion force of rainfall, analysis of its distribution, and evolution characteristics at different temporal and spatial scales, and exploration of possible laws and trends of rainfall erosion.
Scholars around the world have studied rainfall erosivity (R), defined an index of rainfall erosive ability, and established the erosion force model of daily rainfall with a power function structure, the performance of which has been analyzed and verified in some areas (Richardson et al. Citation1983; Renard and Freimund Citation1994; Zhang et al. Citation2002a; Lee and Heo Citation2011). Chinese scholars have utilized the experience of others to improve their models and establish a simple algorithm for modelling rainfall erosivity based on daily rainfall and to estimate annual average rainfall erosivity and seasonal changes (Yu and Rosewell Citation1996; Yu Citation1998; Yu et al. Citation2001). The spatial distribution characteristics of rainfall erosivity in typical regions in China have been analyzed, including loess plateaus(Li et al. Citation2008), southwest mountains (Cao et al. Citation2018), and the Yarlung Zangbo River basin (Liu et al. Citation2019). Studies have shown that the spatial and temporal distributions of rainfall erosivity are basically the same as that of rainfall, and the annual changes are very significant (Jiang et al. Citation2017; Zhong and Zheng Citation2017; Sun and Zha Citation2019; Wu Citation2019). In most regions, the erosion force of rainfall is on the rise, with obvious annual fluctuation and fluctuation cycles (Liu et al. Citation2010). However, few studies have addressed the variation characteristics of rainfall erosivity in China at multiple spatial–temporal scales, and as yet differences in the variation of rainfall erosivity at different spatial–temporal scales are not clear. Due to the influences of its east Asian monsoon climate and natural geography, China has become one of the countries most frequently and seriously affected by water erosion disasters. According to China’s second national remote sensing survey of soil erosion, the area in China subject to water erosion in the late 1990s accounted for 17.19% of the total area, and 46.35% of the total soil erosion area (Liu et al. Citation2013). In addition, rainfall erosivity is one of the leading factors influencing the intensity of water erosion. Therefore, the study of the spatial–temporal distribution characteristics and rules of rainfall erosivity is of great significance to the regions of China.
In this study, we introduced a gravity centre model to study the multiple spatial–temporal scale variation patterns of rainfall erosivity from 1961 to 2018 and to reveal the characteristics and evolution rules of rainfall erosivity at different spatial–temporal scales.
2. Materials and methods
2.1. Data sources and processing
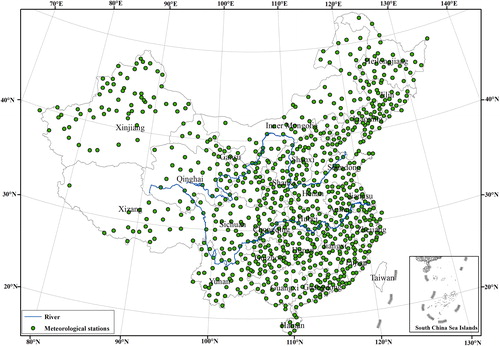
Daily precipitation data obtained by China's 833 meteorological stations from 1961 to 2018 () for the past 58 years were freely available from the China meteorological data network (http://data.cma.cn/). We calculated the rainfall erosivity based on the C Sharp and obtained rainfall-erosivity grid datasets (annual and monthly) at a 1-km spatial resolution using the coKriging interpolation tool of ArcGlS10.2.
Figure 1. Distribution of meteorological stations in China. Source: Author.
2.2. Rainfall erosivity
In this article, the algorithm of rainfall erosivity that proposed by Zhang et al. (Citation2002b) was adopted (EquationEquation 1(1)
(1) ).
(1)
(1)
Where is the rainfall erosivity of k month (MJ·mm)/(hm2·h), α, β are the model parameters,
is the annual average value of erosive precipitation (≥12 mm/day) (mm).
2.3. Gravity centre model
The concept of ‘gravity centre’ derives from the field of physics and refers to the point at which the force of gravity is exerted equally on each part of an object. In the field of geography, the ‘gravity centre’ concept is widely used in the studies of population, economy, food, land use, ecological environments, regional development, and other fields. The spatial variation characteristics of a ‘gravity centre’ can reflect the degrees of variation and trends of geographical phenomena. The attribute value of a plane space unit (grid i) is Given its Cartesian coordinates (
), the spatial mean value of a region composed of plane space units (grid) is defined as a Cartesian coordinate point (
), the calculation formulas for which are as follows (Tian et al. Citation2010; Wang Citation2011):
(2)
(2)
(3)
(3)
When the regional gravity centre of a spatial phenomenon differs significantly from the regional geometric centre, this indicates that this spatial phenomenon has an unbalanced distribution, which is referred to as a ‘deviation in the gravity centre.’ The deviation direction of the gravity centre points to a ‘high density’ area in the spatial phenomenon, and the deviation distance of the gravity centre describes the degree of this unbalanced distribution (Zheng Citation2012). The movement trajectory of the gravity centre in different periods can reflect the evolution of the distribution of a spatial phenomenon. The calculation formulas for the movement direction and distance of the gravity centre are as follows:
(4)
(4)
(5)
(5)
where
and
respectively, are the direction of movement and distance from the gravity centre of spatial phenomena
and
respectively, are the latitude coordinates of spatial phenomena at time
and time
and
and
respectively, are the longitude coordinates of spatial phenomena at these times.
2.4. Trend coefficient and climate trend rate
The trend coefficient (TC) indicates the direction and degree of long-term change in rainfall erosivity for which the calculation formula is as follows (Wang and Liu Citation2010; Liu et al. Citation2011; Li and Wang Citation2019):
(6)
(6)
where n is the serial number of the year, t is the monitoring period,
is the rainfall erosivity of the ith year, and
is the mean value. When the TC is positive, this means that the rainfall erosivity increased in the study period, and when negative, it showed a linear decrease.
The change trend of meteorological elements is generally expressed by the following linear equations:
(7)
(7)
(8)
(8)
where
10 is the climate trend rate,
is the predicted value in t year, and the unit is a factor unit/10a.
According to the linear regression theory, we can obtain the following:
(9)
(9)
where
is the mean variance of factors and
is the mean variance of 1, 2,…,n.
3. Spatial divisions in rainfall erosivity in China
The spatial change patterns of rainfall erosivity of China are complex due to vast territory and various climate and topography. In order to obtain the regional change characteristics, spatial divisions for rainfall erosivity should be conducted. To some extent, rainfall has a spatial correlation, whereby adjacent regions have rainfall erosivity with similar spatial–temporal variation characteristics. In this article, we used principal component analysis and ISODATA dynamic clustering methods to obtain spatial partitions. First, using principal component analysis, we obtained the first six principal components for the rainfall-erosivity grid dataset from 1961 to 2018. Then, using the ISODATA dynamic clustering method based on these first six principal components, we obtained the 4, 5, 7, and 8 clustering results for rainfall erosivity ().
Figure 2. ISODATA dynamic clustering results: (a) four classes, (b) five classes, (c) seven classes, (d) eight classes. Source: Author
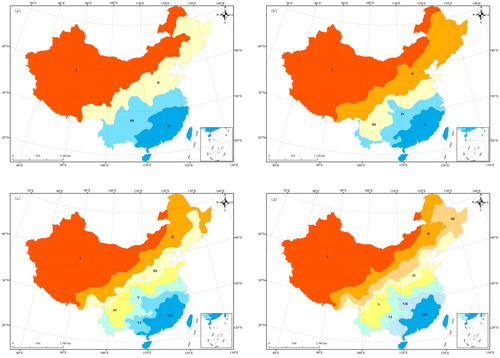
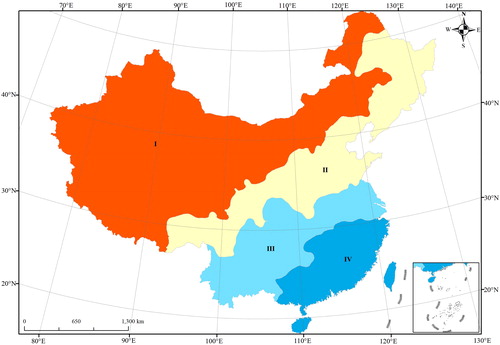
By comparing the clustering results, we found that the distribution of each sub-region in different zoning schemes was basically similar to the precipitation change law. The partition lines for sub-regions I, II, III in each zoning schemes were consistent with the isoprecipitation lines of 200 and 400 mm, respectively. The sub-region IV in , sub-region V in , sub-region VII in and sub-region VIII in covered the same regions with precipitation >1600 mm. To fully consider the ecological environmental characteristics and the precipitation distribution patterns (isoprecipitation lines of 400, 800, and 1600 mm), we used the final clustering results with four sub-regions of rainfall erosivity to analyze the regional change characteristic of rainfall erosivity () (Zhang et al. Citation2003). In this partition scheme, sub-region I mainly included the Northwest River and Southwest River basins, the southern Liaohe River basin, and the southern Haihe River basin. Sub-region II mainly included the southern part of the Songhua River basin and the Haihe River basin. Sub-region III was mainly composed of the Yangtze River basin and the south of the Huaihe River basin. Sub-region IV mainly included the Pearl River basin, Southeast River basin, and the southern Yangtze River basin.
Figure 3. Spatial partition schemes of rainfall erosivity. Source: Author
4. Results and discussions
4.1. Spatial distributions of average annual rainfall erosivity
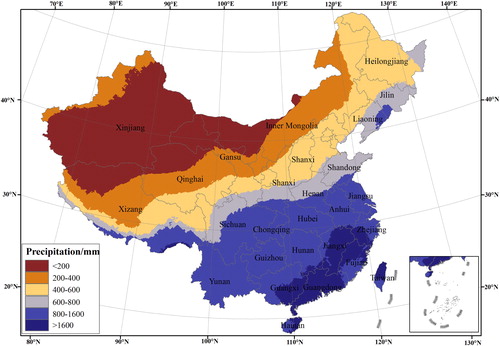
The spatial distributions of average rainfall erosivity during the past 58 years were obtained using grid datasets of the annual rainfall erosivity (). As shown in , the rainfall erosivity in China decreased from southeast to northwest and from the coast to the inland as a whole, which was basically the same as the spatial distribution of annual precipitation (). Roughly bounded by the line along the Daxing'an Mountains–Yanshan–Northwest Shaanxi–Liupanshan–West Qinling–Longmenshan–East Himalayas, the average annual rainfall erosivity in the northwest of this line was below 1000 MJ mm hm−2 h−1, and the rainfall erosivity in the southeast of this line was higher than 1000 MJ mm hm−2 h−1. This above result was consistent with the study of Liu et al. (Citation2013). There were two high-value regions along the coast of South China and in central East China, where the annual average rainfall erosivity exceeded 8500 MJ mm hm−2 h−1.The reason lied in the fact that in these above regions, there were intensive and heavy precipitation in summer and autumn, which was caused by warm and humid ocean currents and tropical cyclones (He et al. Citation2017). On the whole, the average rainfall erosivity, i.e. 100 MJ mm hm−2 h−11,000 MJ mm hm−2 h−1, and 4000 MJ mm hm−2 h−1were consistent with the annual average rainfalls of 200, 400, and 800 mm, respectively (Liu et al. Citation2013).
Figure 4. Spatial distributions of annual average rainfall erosivity in China. Source: Author
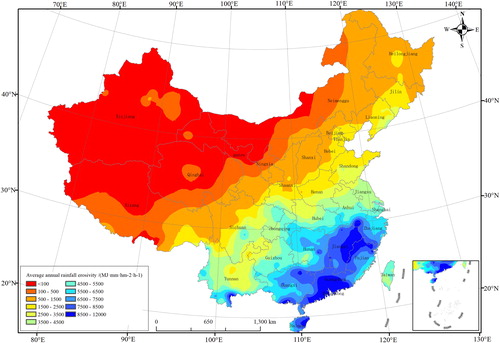
Figure 5. Spatial distribution of average annual precipitation. Source: Author
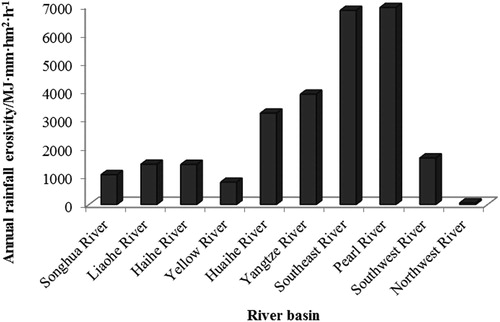
There were significant differences in the rainfall erosivity of different river basins (). The Southeast River and Pearl River basins had the largest rainfall erosivity, with 6842.4 and 6943.8 MJ mm hm−2 h−1, respectively, followed by the Huaihe River basin (3218.9 MJ mm hm−2 h−1) and the Yangtze River basin (3885.1 MJ mm hm−2 h−1).The rainfall erosivity was smallest in the Northwest River basin, with a value of 54.7 MJ mm hm−2 h−1 The distribution pattern of rainfall erosivity was closely related to that of precipitation in China, which was mainly affected by the southeast monsoon and the warm and wet air flow over the Pacific Ocean (Yin et al. Citation2019).
Figure 6. Rainfall erosivity in different river basins. Source: Author
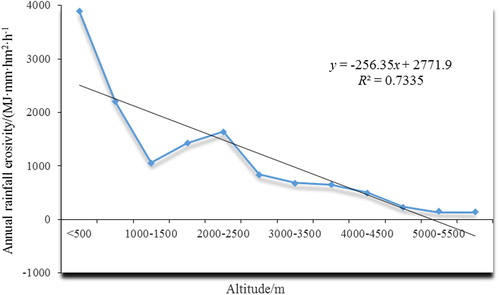
The spatial distribution pattern of the average rainfall erosivity was significantly affected by terrain. As shown in , on the whole, rainfall erosivity decreased with the increase of altitude, which was related to the special topographic distribution (Alpine Plateau Plain)from west to east in China (Liu et al. Citation2013). In addition, rainfall erosivity reached its maximum value in the altitude zone <500 m, with a value of 3882.6 MJ mm hm−2 h−1. However, there was a negative relation between rainfall erosivity and altitude, with the rainfall erosivity reaching an interval minimum value of 1044.91 MJ mm hm−2 h−1in the altitude zone of 1000–1500 m. In the altitude zone of 1500–2500 m, rainfall erosivity presented a significant upward trend with increases in altitude, with rainfall erosivity reaching an interval maximum value of 1413.8 MJ mm hm−2 h−1 in the altitude zone of 1500–2500 m. In addition, the rainfall erosivity decreased with the increase of altitude in the altitude zone of >5500 m, with the rainfall erosivity only 128.8 MJ mm hm−2 h−1. The rainfall erosivity in low-altitude areas was relatively high, whereas that in high-altitude areas was generally low. The reason lied in the fact that zones with lower latitude (<500 m) were mostly distributed in the eastern coastal areas, which were significantly influenced by warm and moist airflow (Yin et al. Citation2019). However, with the extension of inland, the precipitation would decrease with the gradually weakening ocean climate. Moreover, the orographic rain played an important role in increasing rainfall erosivity in zones with latitude between 1500 and 2500 m. Zones with latitude >2500 m were mostly located in the middle and west of China, where the temperate continental climate played a leading role that characterized by less rainfall (He et al. Citation2017).
Figure 7. Relationship between rainfall erosivity and altitude. Source: Author
4.2. Interannual change of rainfall erosivity
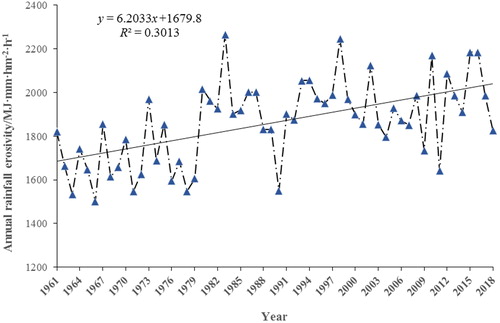
In this article, the annual rainfall erosivity for the past 58 years were utilized to analyze the interannual variation characteristics of rainfall erosivity in China. As shown in , the mean value of rainfall erosivity in China showed an increasing fluctuation trend in the past 58 years, with an increasing trend of 76.49 MJ mm hm−2 h−1/a and a maximum value of 2266.19 MJ mm hm−2 h−1 in 1983, and a minimum value of 1501 MJ mm hm−2 h−1 in 1966. Prior to 1980, the average rainfall erosivity in the study area was less than 2000 MJ mm hm−2 h−1 and the increase trend was slight. After 1980, the average rainfall erosivity increased significantly and fluctuated around 2000 MJ mm hm−2 h−1. Relative studies found that there was a significant increase in precipitation in China after 1980, which was consistent with the above results (Liu et al. Citation2013; Yin et al. Citation2019). However, in 1990 and 2011, there were two ‘valleys’ for which the rainfall erosivity was only 1548.73 and 1641.18 MJ mm hm−2 h−1, respectively. The reason lied in the fact that in these above 2 years, the precipitation was relative less due to the warm and dry climate (Yin et al. Citation2019).
Figure 8. Interannual variation characteristics of rainfall erosivity in China. Source: Author
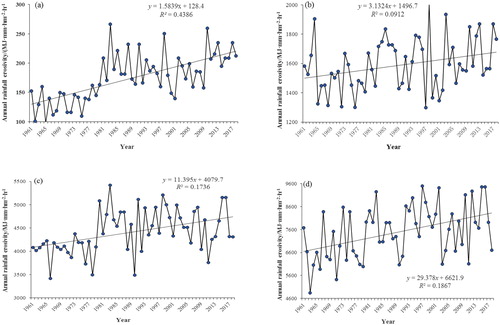
Due to China’s vast territory and complex terrain, the change characteristics of rainfall erosivity in different regions differed greatly. As shown in , there was an upward trend of rainfall erosivity for each sub-region from 1961 to 2018, but the annual average variation characteristics of rainfall erosivity in each sub-region differed significantly. The mean value of annual rainfall erosivity in sub-region I was mostly less than 300 MJ mm hm−2 h−1. From 1961 to 1980, rainfall erosivity was less than 200 MJ mm hm−2 h−1, while the rainfall erosivity gradually increased from 1981 to 2018, especially in 1983 and 2010, when these values reached 266.3 and 259.7 MJ mm hm−2 h−1, respectively. However, the increasing trend of rainfall erosivity was the most significant in sub-region I, where the climate became warmer and moister during the past 58 years (Wang and Liu Citation2010). In sub-region II, the annual rainfall erosivity remained mainly between 1300 and 1900 MJ mm hm−2 h−1. The maximum fluctuation range occurred in sub-region III, where the annual rainfall erosivity reached 5418.22 MJ mm hm−2 h−1 in 1983 and 3419.001 MJ mm hm−2 h−1in 1966. The mean value of annual rainfall erosivity in sub-region IV was mostly larger than 5000 MJ mm hm−2 h−1. In addition, the increasing trend of rainfall erosivity in sub-region IV was more significant than that of sub-regions II and III.
Figure 9. Interannual variation of rainfall erosivity in China for sun-regions: (a) sub-region I, (b) sub-region II, (c) sub-region III, and (d) sub-region IV. Source: Author
4.3. Trend coefficient and climate trend rate of rainfall erosivity
To further analyze the spatial–temporal variation trend in rainfall erosivity, we obtained the TC and climate trend rate of rainfall erosivity for the past 58 years. As shown in , rainfall erosivity in most regions of China showed an increasing trend, with a total area of 6.46 million km2. A small part of China showed a decreasing trend for rainfall erosivity with a total area of 3.14 million km2. Four regions exhibited a significant decrease in rainfall erosivity (TC < –0.08), including the junction zone of Sichuan–Chongqing–Shaanxi–Hubei, the junction zone of Yunnan–Guizhou, Eastern Inner Mongolia, and the junction zone of Inner Mongolia–Heilongjiang. In these arid and semi-arid areas of North and Northwest China, the climate was characterized by increasing temperature and decreasing precipitation (Liu et al. Citation2013). In southern Xinjiang and Eastern Heilongjiang, there were two sub-centres of decreasing rainfall erosivity, with TCs ranging from –0.08 to 0.04. Six regions, i.e. the junction zone of Qinghai–Gansu, western Inner Mongolia, eastern Shandong Province, eastern Zhejiang Province, the junction zone of Guangxi–Guangdong, and northern Xinjiang, exhibited significant increasing rainfall erosivity with TCs > 0.17. During the past decades, the rainfall increased significantly in these above regions with the development of global warming (Yin et al. Citation2019). In conclusion, we found more significant increasing trends of rainfall erosivity in eastern coastal areas, the eastern Qinghai–Tibet Plateau, and northern Xinjiang than in in other areas, which indicates that there is also a greater risk of a rapid increase in soil erosion in these areas. As such, soil and water conservation measures should be strengthened in these areas in particular.
Figure 10. Spatial distributions of rainfall erosivity change trend coefficients in China. Source: Author

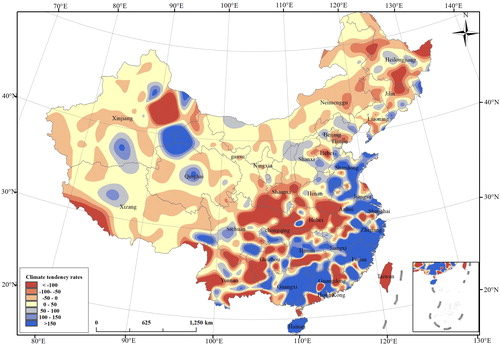
Climate tendency rates may reflect the change trend of rainfall erosivity from another perspective. showed that in the past 58 years, there were two significantly decreasing centres of rainfall erosivity in China with climate tendency rates of <–150 MJ mm hm−2 h−1 10a−1, namely, the junction zone of Sichuan–Chongqing–Shaanxi–Hubei and the junction zone of Yunnan–Guizhou. At the same time, there have been three sub-centres with reductions in rainfall erosivity with a climatic tendency rate < –50 MJ mm hm−2 h−1 10a−1, namely, southern Tibet, northeastern Xinjiang, and the junction zone of Inner Mongolia–Jilin–Heilongjiang. Rainfall erosivity in the eastern coastal areas showed a significant increasing trend with a climatic tendency rate >100 MJ mm hm−2 h−1 10a−1, which is consistent with the spatial distribution of rainfall erosivity TCs.
Figure 11. Spatial distributions of rainfall erosivity climate tendency rates in China. Source: Author
4.4. Spatial distribution of gravity centre of rainfall erosivity
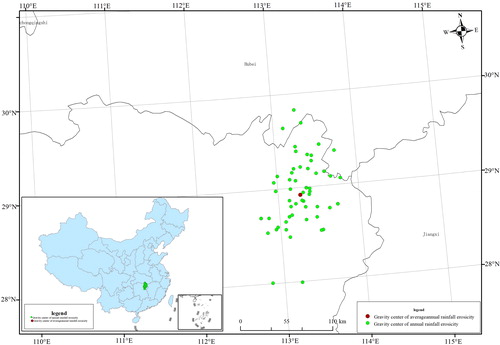
The gravity centre of rainfall erosivity can effectively show the imbalance and deviation in the spatial distribution of rainfall erosivity in the study area. In this study, we calculated the gravity centre of the average and annual rainfall erosivity in the past 58 years (), which were mainly concentrated in Yueyang City in the province of Hunan. These results indicated that the total rainfall erosivity in the southeast of China was higher than that in the northwest, which was consistent with the analysis results of Liu et al. (Citation2013).
Figure 12. Distributions of the gravity centre of rainfall erosivity in China during 1961–2018 period. Source: Author
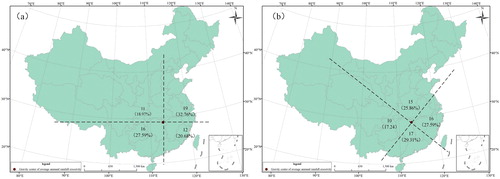
To further explain the spatial distribution characteristics of rainfall erosivity, we established a coordinate system by taking the gravity centre of the average annual rainfall erosivity as the origin, the north–south direction as the vertical axis, and the east–west direction as the horizontal axis. We then calculated the number of gravity centres of rainfall erosivity and the percentages of the total number of gravity centres in different quadrants of the coordinate system. The results () showed that 32.76% of the gravity centres of rainfall erosivity were located in the northeast quadrant, which meant that the increment and increasing rate of rainfall erosivity in Northeast China were relatively large in the past 58 years. The numbers of gravity centres of rainfall erosivity in the southwest and southeast regions were smaller, representing 18.97 and 20.76%, respectively. If we divided the study area into two parts according to the axis, there were more gravity centres of rainfall erosivity in the east (53.44%) than in the west (46.56%), which meant that the increment and increasing rate of rainfall erosivity in eastern China was greater than that in the west in the past 58 years. The number of gravity centres of rainfall erosivity in the south of the study area (51.73%) was roughly the same as that in the north (48.27%).
Figure 13. Distribution of the gravity centre of rainfall erosivity in the study area from 1961 to 2018. Source: Author
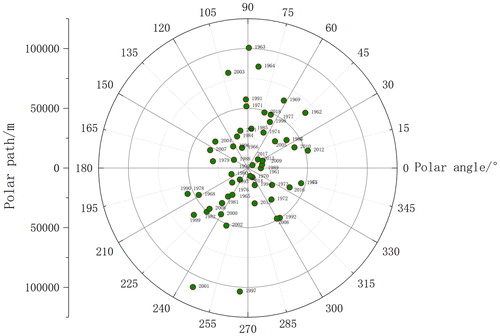
China was a country seriously affected by monsoons. Considering the direction of monsoons in the study area, we rotated coordinate system a 45° counterclockwise to obtain coordinate system b, and then counted the number and proportion of gravity centres of rainfall erosivity in the different quadrants of the coordinate system, as shown in .We can see that the proportions of gravity centres of rainfall erosivity were roughly the same in the southern, northern, and eastern quadrants, i.e. 29.31, 25.86, and 27.59%, respectively, which were significantly higher than that in the western quadrant (17.24%). This showed that the increment and increasing rate of rainfall erosivity in the west were lower than those in the east, south, and north in the past 58 years. showed that the gravity centres of rainfall erosivity in 1963, 1964, 1997, 2001, and 2003 were larger than their deviation distances from the origin, which indicates that the increments of rainfall erosivity in the north and southwest of China were significant in the last 5 years. However, the gravity centres of rainfall erosivity in the other 53 years were smaller than their deviation distances from the origin, and the variations in rainfall erosivity in each region were relatively consistent.
Figure 14. Distribution of the gravity centre of China's rainfall erosivity during 1961–2018. Source: Author
4.5. Gravity centre migration of rainfall erosivity at temporal scales of 5a and 10a
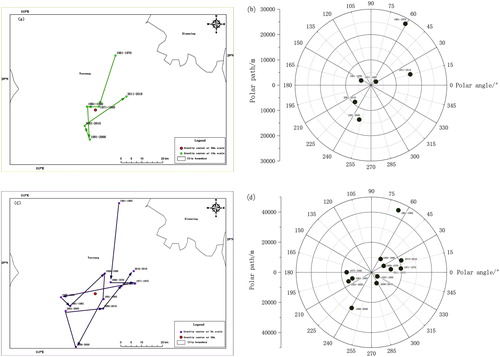
To further explore the spatial variation rules of the gravity centre of rainfall erosivity, we analyzed the migrations trajectory of gravity centres at different temporal scales from 1961 to 2018. Considering the influence of extreme climate and other factors on the changes in the gravity centres of rainfall erosivity, we determined the migration law of the gravity centre of rainfall erosivity in the study area at two temporal scales (10 and 5 years). showed that on a 10-year scale, the gravity centre of rainfall erosivity shifted southward from 1971 to 1980 compared with that from 1961 to 1970, indicating that the increment in rainfall erosivity in the southern part of the study area was larger than that in the northern part of the study area. However, the gravity centre of rainfall erosivity from 1981 to 1990 shifted from that of 1971–1980, which meant that the increment in rainfall erosivity in the west was larger than that in the east. Compared with the 1981–1990 period, the gravity centre of rainfall erosivity generally moved southward from 1990–2000 to from 2001–2010 and it gradually moved northward from 2011 to 2018. As shown in , on a 5-year scale, the gravity centre of rainfall erosivity in China first moved southward (1966–1970) and then moved southeast (1966–1970→1971–1975), indicating that the increment of rainfall erosivity in the 1971–1975 period was larger than that of 1966–1970. From 1975 to 2015, the gravity centre of rainfall erosivity generally moved westward, which meant that in the past 30 years, the increment and increasing rate of rainfall erosivity in the western part of the study area were higher than those in other regions. However, the gravity centre of rainfall erosivity began to move northeast in 2016, which indicated that the increment and increasing rate of rainfall erosivity in the eastern and northern parts of the study area were higher than that in other regions after 2016.
Figure 15. Migration trajectory of rainfall erosivity gravity centre of g at different spatial scales (a) and (b) are at 10a scale; (c) and (d) are at 5a scale. Source: Author
4.6. Spatial change patterns of rainfall erosivity at temporal scales of 58a and 10a
To analyze the spatial change patterns of rainfall erosivity at multiple scales, we performed trend line analyses at multiple scales, including 58a and 10a (). As shown in , 84.2% of the rainfall erosivity in the study region was stable with the change ratios ranging between –0 and 10%, which were mainly distributed in the northwest and northern China. However, significantly increasing zones of rainfall erosivity with change ratios >10% were mainly distributed in Shanghai, the provinces of Zhejiang and Fujian, the junction zone of Hebei–Anhui–Zhejiang–Hubei, and the centre of Sichuan. There were also five significantly decreasing centres of rainfall erosivity with change ratios <–10%, which were mainly located in the Hengduan Mountains, junction zone of Yunnan–Sichuan Province, the northeast of the province of Guizhou, and the southeast of the province of Gansu. Overall, we found a more significant increasing trend of rainfall erosivity in the western South China and southern East China than in other regions.
Figure 16. Spatial–temporal change trend of rainfall erosivity at multiple temporal scales of 58a and 10a (a) 1961–2018; (b) 1969–1978; (c) 1979–1988;(d) 1989–1998;(e) 1999–2008;(f) 2009–2018. Source: Author
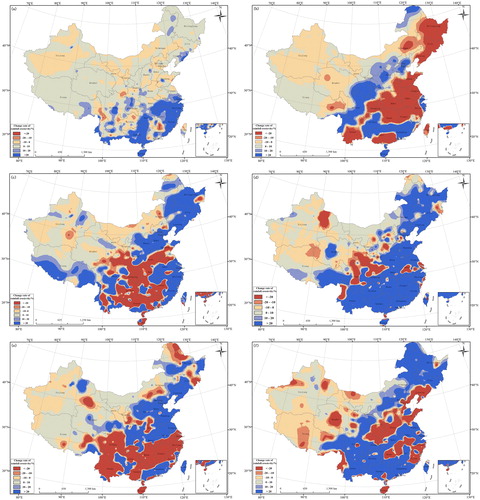
In addition, we conducted a spatial–temporal change analysis of rainfall erosivity at the 10a scale. In , we can see the following:
During the 1969–1978 period, zones with significantly increasing rainfall erosivity were mainly distributed on Hainan Island, the Minjiang–Tuojiang River basins, and in the north of the Jialiang River basin. However, some regions, including the Songhua River basin, Huaihe River basin, and the middle and lower reaches of the Yangtze River, showed a decreasing trend.
During the 1979–1988 period, the area of zones with increasing rainfall erosivity enlarged, compared to that of 1961–1978. These regions, including the Songhua River basin, Liaohe River basin, Haihe River basin, Southeast River basin, and Southwest River basin, showed an increasing trend. However, zones with decreasing rainfall erosivity were mostly located in the north of the Pearl River basin and the middle reaches of the Yangtze River basin.
During the 1989–1998 period, the area of zones with increasing rainfall erosivity further enlarged, more than ever before. Except for the middle reaches of the Yangtze River basin, the rainfall erosivity in the southern region of the 800-mm precipitation line increased significantly. On the other hand, the rainfall erosivity of the Northwest River basin and the eastern Qinghai–Tibet plateau had a decreasing trend.
During the 1999–2008 period, the area of zones with increasing rainfall erosivity reduced. These zones were mainly distributed in the middle and lower reaches of the Yellow River basin, Pearl River basin, Huaihe River basin, and Haihe River basin. The rainfall erosivity of the Heilong River basin, Yangtze River basin, and Southwest River basin also showed a decreasing trend. During this period, there was a decreasing trend in precipitation, which were consistent with studies of Liu et al. (Citation2013).
During the 2009–2018 period, the area of zones with increasing rainfall erosivity enlarged beyond that of 1999–2008. The zones with increasing rainfall erosivity were mainly distributed in in Songhua River basin, Huaihe River basin, the middle and upper reaches of Yangtze River basin, Pearl River Basin, and the Southwest River basin, where the annual rainfall had a significant increasing trend (Yin et al. Citation2019). The zones with decreasing rainfall erosivity were mostly concentrated in the Shandong Peninsula, Liaodong Peninsula, east of the Qinghai–Tibet plateau, and the middle of the Yangtze River basin.
As shown in , there was an increasing trend in sub-region I throughout the study period. Except for the 1969–1978 period, the rainfall erosivity of sub-region II has also shown an increasing trend during the past 40 years. Rainfall erosivity in sub-regions III and IV experienced obvious periodic change in the past 50 years, which is basically consistent with the variation characteristics of rainfall erosivity for the whole study area.
Table 1. Change trend of rainfall erosivity at multiple spatial–temporal scales.
5. Conclusion
In this study, we introduced a gravity centre model to discuss the multiple spatial–temporal scale variation patterns and evolution laws of rainfall erosivity from 1961 to 2018.
During 1961–2018, rainfall erosivity in China generally showed a decreasing trend from southeast to northwest. In addition, the annual average rainfall erosivity in different river basins differs greatly, with the southeastern River and Pearl River basins exhibiting the largest rainfall erosivity. There was a significantly negative relationship between rainfall erosivity and altitude, with rainfall erosivity decreasing with increasing altitude.
In terms of interannual variation, the average rainfall erosivity in China has shown an increasing trend of fluctuation in the past 58 years, with steep rising and descending slopes occurring in 1982 and 1990, respectively.
During the past 58 years, the gravity centre of rainfall erosivity in China has generally moved southeastward, which indicates that the increment and increasing rate of rainfall erosivity in eastern and southern China are larger than those in western and northern China.
Disclosure statement
No potential conflict of interest was reported by the authors.
Additional information
Funding
References
- Cao Y, Wang SJ, Bai XY, Li HW, Wang MM, Wu LH. 2018. Inversion calculation and spatial-temporal pattern of rainfall erosivity in southwestern China over one hundred years. Acta Ecol Sin. 38(24):8766–8773.
- He SL, Guo XJ, Li FY, Li N, He XW. 2017. Spatial-temporal variation of rainfall and rainfall erosivity in southern China in recent 60 years. Resour Environ Yangtze Basin. 26(9): 1406–1416.
- Jiang C, Gao YN, Li F, Wang DW, Zhang LB, Li DQ. 2017. Soil erosion status variation and attribution in the three-river headwaters region during 1956-2010. Res Environ Sci. 30(01):20–29.
- Lee JH, Heo JH. 2011. Evaluation of estimation methods for rainfall erosivity based on annual precipitation in Korea. J Hydrol. 49(1–2):30–48.
- Li J, Liu ZH, Li R. 2008. Temporal and spatial characteristics of rainfall erosivity with different geomorphology types on the loess plateau. Bull Soil Water Conserv. 2(3):124–127.
- Li WJ, Wang JL. 2019. Spatial and temporal variations of rainfall erosivity at each level in Taihang mountain. J Nat Resour. 34(04):785–801.
- Liu H, Li XY, Yao ZY. 2019. Rainfall erosivity in Yarlung Zangbo river basin during 1961-2015. J Desert Res. 39(02):166–176.
- Liu LL, Liu ZF, Ren XY, Fischer T, Xu Y. 2010. Hydrological impacts of climate change in the Yellow River Basin for the 21st century using hydrological model and statistical downscaling model. Qatern Int. 244(2): 211–220.
- Liu M, Peng XY, Li JX, Pu MJ. 2011. Climatic characteristics of high temperatures in Jiangsu province in recent 50 Years. Resour Sci. 33(10):1991–1998.
- Liu BT, Tao HP, Song CF, Guo B, Shi Z, Zhang C, Kong B, He B. 2013. Temporal and spatial variations of rainfall erosivity in China during 1960 to 2009. Geogr Res. 32(02):245–256.
- Renard KG, Freimund JR. 1994. Using monthly precipitation data to estimate the R factor in the revised USLE. J Hydrol. 157(1–4):287–306.
- Richardson CW, Forster GR, Wright DA. 1983. Estimation of erosion index from daily rainfall amount. Trans ASAE. 26(1):153–156.
- Sun LL, Zha X. 2019. Variation trend of rainfall and rainfall erosivity in 60 years of Hainan Province. Subtrop Soil Water Conserv. 31(01):1–6.
- Tian G, Liang Y, Chen XM, Liu T. 2010. Comparative study on several rainfall erosiveness models in Lianshui basin. Acta Pedol Sin. 47(01):7–12.
- Wang FY, Liu PX. 2010. Characteristic analysis on sunshine duration change in Jiuquan oasis in recent 45 years. Plateau Meteorol. 29(04):999–1004.
- Wang R. 2011. Simulation study on soil erosion in Karst area——a case study of Wujing River Basin in Guizhou province. Peking University, Beijing.
- Wischmeier WH, Smith DD. 1958. Rainfall energy and its relation-ship to soil loss. Trans Agu. 39(2):285–293.
- Wu MY. 2019. Characteristics of annual spatial and temporal distribution of rainfall and rainfall erosivity in Chengdu. Yangtze River. 50(04):81–85.
- Yin SQ, Xue XC, Yue TY, Xie Y, Gao G. 2019. Spatiotemporal distribution and return period of rainfall erosivity in China. Trans Chinese Soc Agric Eng. 35(9):105–113.
- Yu B. 1998. Rainfall erosivity and its estimation for Australia’s tropics. Aust J Soil Res. 36(1):143–165.
- Yu B, Hashim GM, Eusof Z. 2001. Estimating the R-factor with limited rainfall data: a case study from peninsular Malaysia. J Soil Water Conserv. 56:101–105.
- Yu B, Rosewell CJ. 1996. An assessment of a daily rainfall erosivity model for New South Wales. Soil Res. 34(1):139–152.
- Zhang WB, Xie Y, Liu BY. 2002a. Research evolution of rainfall erosivity. J Soil Water Conserv. 16(2):43–46.
- Zhang WB, Xie Y, Liu BY. 2002b. Rainfall erosivity estimation using daily rainfall amounts. Sci Geogr Sin. 22(6):705–711.
- Zhang WB, Xie Y, Liu BY. 2003. Spatial distribution of rainfall erosivity in China. J Mt Sci-Engl. 21(1):33–40.
- Zheng ZY. 2012. Study on the regional structure change of inbound tourismin Zhejiang province based on the gravity model. J Zhejiang Normal Univ. 35(01):115–120.
- Zhong KY, Zheng FL. 2017. Spatial and temporal variation characteristics of rainfall erosivity in the Songhua river basin from 1960 to 2014. J Nat Resour. 32(02):278–291.