
 ?Mathematical formulae have been encoded as MathML and are displayed in this HTML version using MathJax in order to improve their display. Uncheck the box to turn MathJax off. This feature requires Javascript. Click on a formula to zoom.
Abstract
Revealing the future spatial-temporal patterns of heatwave impacts on crops due to global climate change is of great scientific significance for climate change-related agricultural hazards prevention. However, the prediction of future wheat heatwave considering the planting distribution, growth period of wheat, as well as heatwave frequencies, days, and intensities remain poorly understood. In this paper, using predicted meteorological data of the Representative Concentration Pathway 8.5 (RCP8.5) scenario from 2011 to 2099 as well as a set of indicators that include heatwave days, frequencies and effective accumulative high temperatures, a comprehensive evaluation was performed to characterize the spatial-temporal variability of the heatwave hazard impacts on wheat in northern China under extreme climate scenarios. The results indicate that heatwaves across the Huang-Huai-Hai Plain, Xinjiang, western Gansu and the agro-pastoral ecotone are most frequent in the long-term. Heatwaves show significant increasing trends with regard to future occurrence frequency, days and intensities. The heatwave hazard on the Huang-Huai-Hai Plain, Northeast China, and the agro-pastoral ecotone shows a rapid growth trend, and there is a clear transition from relatively low heatwave hazard to a higher hazard. We argue that the continuous increase in heatwaves may pose a great threat to wheat production in northern China.
1. Introduction
A heatwave refers to a type of climate-related hazard on a short time scale that imposes significant negative impacts on human health, regional economies and ecological systems (Karl and Knight Citation1997; Meehl and Tebaldi Citation2004; Xu et al. Citation2009). Many studies have shown that heatwaves can strongly threaten agricultural production by, for example, seriously reducing the yield of wheat, maize and other crops (Semenov Citation2008; Chung et al. Citation2014). Under the background of global warming, heatwaves are predicted to become more frequent and serious in the future, and observations indicate that they have already begun this trend (Coumou and Rahmstorf Citation2012; IPCC Citation2014; Dong et al. Citation2015); moreover, heatwaves are expected to pose greater threats to global food production. Therefore, it is urgently needed to assess heatwave hazards on the main food crops at both global and regional scales from the perspective of adapting to, preventing and managing the heatwave risk caused by climate changes and guaranteeing food safety.
However, studies of heatwave hazard assessment in the context of crops still exhibit wide disparities in scientifically evaluating the extent of the hazard and revealing the spatial-temporal patterns. First, to date, there is no unified and clear global heatwave standard (Kalkstein et al. Citation1996; Huynen et al. Citation2001; Jia and Hu Citation2017; Wang and Zeng Citation2017). Second, different scholars have defined different temperature thresholds for each crop based on its physiological characteristics (Teixeira et al. Citation2013; Chung et al. Citation2014; Meng et al. Citation2015; Tao et al. Citation2015; Liu et al., Citation2016). On this basis, many studies have evaluated the extent of heatwave hazard impacts on crops. For example, heatwave days, times, frequency and duration have been used to evaluate the heatwave hazard impacts on rice (Meng et al. Citation2015). In addition, different temperature values have been used to reflect different levels of agricultural heatwave hazards (Cai et al. Citation2011). Bastos et al. (Citation2014), based on two record-breaking heatwave events, used normalized average temperature anomalies during the heatwave years to reflect the heatwave characteristics. Similarly, Chung et al. (Citation2014) calculated deviations in the maximum temperatures between heatwave years relative to normal years to reflect heatwave the characteristics. The above-mentioned approaches are very common in the meteorological hazard evaluation of crops because they can partially reveal the threat of heatwaves on crops. However, we argue that these existing indicators are inadequate for describing the hazard mechanism and characteristics of the heatwave hazard-inducing factors in the context of crops. For example, the effective accumulative high temperature can reflect not only the heat duration but also the intensity of a high-temperature hazard (Xiong et al. Citation2016). Moreover, many studies have shown that the effective cumulative temperature does reflect the negative impact of heatwaves on wheat production to some extent (Lobell et al. Citation2011; Tao et al. Citation2015; Chen et al. Citation2016). However, to date, few studies have focused on using effective accumulative high temperatures to evaluate the heatwave hazard of wheat at a broad scale. Though the relationships between crop output, such as rice and maize, and high-temperature events have been analysed based on their effective cumulative high temperatures (Butler and Huybers Citation2013; Xiong et al. Citation2016). However, the indicator system and hazard assessment model must be further refined to reveal the spatial-temporal patterns of the heatwave hazard impacts on crops under future climate change scenarios.
Wheat is the food crop with the largest planting area and annual yield globally. As the largest wheat-producing country in the world, China accounts for 17.5% of global wheat production (USDA Citation2018). As a country with a large population, China's wheat production will directly affect the stability and sustainable social development of China. Furthermore, because it is a type of C3 crop that prefers relatively cool temperatures (Lobell et al. Citation2012; Zhang et al. Citation2015), wheat is more inclined to be threatened by high temperatures compared to maize, rice, and soybean (Teixeira et al. Citation2013; Deryng et al. Citation2014), thus resulting in decreases in output and quality (Wheeler et al. Citation2000; Rezaei et al. Citation2015). Although scholars have conducted analyses of the relationship between heatwaves and wheat output (Nuttall Citation2012), there is still a lack of scientific predictions of the heatwave hazard impacts on wheat under future changes in climate, thus making it difficult to assess the development trends of heatwaves (Zhao et al. Citation2013).
Therefore, to better characterize the heatwave hazard impacts on wheat under climate change, this paper aims to propose an evaluation method that can comprehensively reflect the heatwave hazard impacts on wheat, reveal the spatial-temporal patterns, and determine the evolution trend of the heatwave hazard impacts on wheat in northern China under extreme climate scenarios by applying the evaluation method. In this paper, we adopted the Representative Concentration Pathway 8.5 (RCP8.5) scenario, a climate scenario with very high greenhouse gas emissions, which represents CO2-caused radiation capture reaching 8.5 W/m2 by the end of the twenty first century (Van Vuuren et al. Citation2011), as the extreme climate scenario.
2. Data and methods
2.1. Study area
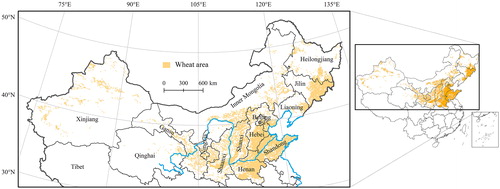
Wheat is planted in most regions of China, and its cultivation areas are centralized in northern China, the northern region of Northeast China and the north-eastern area of Southwest China (Zhang et al. Citation2013). Among them, northern China (which is located to the north of the Qinling - Huaihe - Qinghai-Tibet Plateau, ) accounts for 67.95% of the total national wheat planting area, which has a total output of 72.22% and thus has been the main wheat production area in China. Henan, Shandong, Hebei, Xinjiang, and Shaanxi account for 57.80% of the total planting area in northern China, accounting for 61.83% of its total output (NBSC Citation2017). The high-temperature threats in China in recent years have been continuously intensifying (You et al. Citation2017). Because heatwave events typically lead to drought incidents during wheat growth periods, heatwaves can have significant adverse effects on wheat production and induce serious decreases in output in northern China (Lobell et al. Citation2011; Teixeira et al. Citation2013; Chen et al. Citation2016).
Figure 1. The study area and its location in China. Source: http://nfgis.nsdi.gov.cn, http://nfgis.nsdi.gov.cn/nfgis/chinese/cxz.htm.
2.2. Data source
In this paper, we applied the projected meteorological data of the selected RCP scenario provided by the Inter-Sectoral Impact Model Intercomparison Project (ISI-MIP), funded by the German Federal Ministry of Education and Research. The ISI-MIP provides global daily meteorological data at a spatial resolution of 0.5° × 0.5° from 1971 to 2099 based on five general circulation models (GCMs) (Hempel et al. Citation2013). The data from 1971 to 2004 are historical data based on observations, while the data from 2005 to 2099 are projections under the different RCP scenarios.
To reduce the uncertainty from a single GCM model, we selected one scenario with very high greenhouse gas emissions (RCP8.5) driven by three GCMs, i.e. the GFDL-ESM2M, IPSL-CM5A-LR and NorESM1-M models, to simulate the future heatwave hazard for wheat. These three GCMs are all global models and were developed by the Geophysical Fluid Dynamics Lab in the USA, the French Pierre Simon Laplace Institute and the Norwegian Climate Center, respectively (Yin et al. Citation2015). The projected meteorological data of these three GCMs have been widely acknowledged by researchers to evaluate the impacts of climate change on agriculture (Müller and Robertson Citation2014; Blanc and Sultan Citation2015; Blanc Citation2017), including in China (Yin et al. Citation2015; Yang et al. Citation2018).
Another important datum is the phenological period of wheat in northern China. The mean value of the same reproductive period over multiple years is adopted to reflect the common dates of the local growth period of wheat. Based on the physiological characteristics of wheat in the high-temperature-sensitive period and with reference to the existing research results (Zhao Citation2010a, Citation2010b), the studied phase of the heatwave hazard is determined as the reproduction and growth phases, that is, the heading period to the mature period. Accordingly, based on this criterion combined with the growth period of each wheat-growing region in northern China (Yue et al. Citation2015), the studied phase of the wheat heatwave hazard was determined ().
Table 1. The studied phase of the wheat heatwave hazard in each wheat-planting region in northern China.
2.3. Method of evaluating the heatwave hazard impacts on wheat
Generally, the higher the intensity of the meteorological hazard-inducing factor is and the greater the duration and occurrence frequency are, the higher the hazard degree will be. We argue that the composite indicators (relative to the individual indicator) reflecting the high-temperature intensity and duration can better indicate the danger of heatwaves (Shimono Citation2011).
Therefore, the cumulative temperature of wheat in the growth period with all heatwave events exceeding a temperature threshold is adopted in this paper; that is, the effective cumulative temperature is used as a composite intensity indicator to evaluate the heatwave threat imposed on wheat. Specifically, the effective cumulative temperature refers to the sensitive period when wheat is likely to be impacted by high temperatures, that is, the heading period to the mature period, as well as the cumulative temperature when the maximum temperature of the current day exceeds the temperature threshold for wheat damage (Teixeira et al. Citation2013; Yang et al. Citation2013). Then, the frequency, days, and the cumulative temperature are selected to represent the indicators and evaluate the heatwave hazard impacts on wheat ().
Table 2. Heatwave hazard indicators.
Based on the concept described above and the heat-sensitive period of wheat (), the daily maximum temperature from the GFDL-ESM2M, IPSL-CM5A-LR, and NorESM1-M models under the RCP8.5 scenario from 2011 to 2099 are used to analyse the heatwave hazard impacts on wheat for each 0.5°×0.5° grid. In the present study, the above-mentioned meteorological data are overlaid with known wheat planting data (Yue et al. Citation2015). By removing the area without wheat planting, our results can better reveal the temporal and spatial patterns of heatwave hazards in northern China’s wheat-planting areas. This process is described below.
2.3.1. Detection of heatwave impacts on wheat
A temperature threshold for heatwave impacts on wheat, i.e. 30 °C (Deng et al. Citation2009; Chen et al. Citation2016), is adopted in the present study. A high-temperature day is recorded when the maximum temperature of the current day reaches or exceeds 30 °C, and if this lasts for 3 days or more, it is recorded as a heatwave event. The specific method is as follows: take one day as the step length to determine whether the conditions of a high-temperature day are satisfied beginning with the first day of temperature data. If satisfied, the current day is be recorded as a high-temperature day; otherwise, it is recorded as 0. After this process is finished, continuous high-temperature events that are less than 3 days are recorded as 0, whereas the remaining events are denoted as heatwave events. The cumulative number of heatwave events is recorded as the frequency of heatwave events. Using the above method, the heatwave event impacts on wheat in northern China for each grid from 2011 to 2099 under the RCP8.5 scenario and their frequency (n) are acquired.
2.3.2. Calculation of the heatwave days impact on wheat
The heatwave days (HD) refer to the accumulation of total high-temperature days of heatwave events in each grid. The calculation formula is as follows:
where n refers to the frequency of heatwaves, and Di refers to the days corresponding to the ith heatwave event.
2.3.3. Calculation of the intensity of heatwave event impacts on wheat
The principle of calculating the intensity of the heatwave hazard impacts on wheat involves first calculating the intensity (I), which represents the daily maximum temperature exceeding the temperature threshold (30 °C) of each high-temperature day within heatwave events and for each grid; then, we sum over all I. The details of this calculation are as follows:
where dh and dm represent the heading period and mature period of wheat, respectively, and Tmax represents the daily maximum temperature; I represents the daily temperature (°C) exceeding the temperature threshold during heatwave events; and Th represents the high-temperature threshold.
2.3.4. Analysis of the heatwave hazard impacts on wheat
The above three indicators are classified into five levels, namely, the heatwave frequency (HF) is classified as extremely low, low, medium, high or extremely high; the heatwave days (HD) are classified as extremely few, few, medium, many or extremely many; and the heatwave intensity (HI) is classified as extremely low, low, medium, strong or extremely strong. Within these levels, the discontinuity points of frequency are 1, 2, 3 and 4 times; those of days are 10d, 20d, 30d and 40d; and those of intensity are 40 °C, 80 °C, 120 °C, and 160 °C, respectively. Then, based on the annual values from 2011 to 2099 as well as the annual average values in the near-term (2011–2040), medium-term (2041–2070) and long-term (2071–2099) periods, the spatial-temporal evolution trends of the heatwave hazard impacts on wheat in northern China are revealed.
3. Results and analysis
3.1. Spatial distribution of heatwave hazard impacts on wheat in northern China
3.1.1. Heatwave frequency
The HF impacts on wheat generally show similar spatial distribution patterns in the near-, medium- and long-term periods (). Overall, the HF is highest on the Huang-Huai-Hai Plain, the agro-pastoral ecotone, and Xinjiang; other regions also exhibit relatively low HF. However, over time, the high-frequency areas increase, mainly in Northeast China, the agro-pastoral ecotone and the Huang-Huai-Hai Plain, while the areas with low and extremely low HF decrease significantly (, Figure 1 in Appendix).
Figure 2. Spatial Distribution of the HF in northern China (a. 2011–2040; b. 2041–2070; c. 2071–2099).
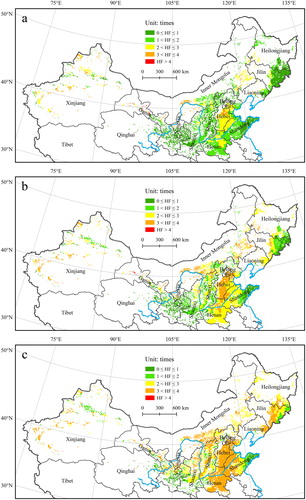
In the near-term period, regions with extremely low HF (0 times ≤ HF ≤ 1 time) and low HF (1 time < HF ≤ 2 times) account for the highest proportion, 38% and 35% of the wheat-planting areas in northern China, respectively ( in Appendix). Among them, the former is mainly distributed in Qinghai, Gansu, Ningxia, Shandong, and Northeast China, and the latter is mainly centralized in Henan, Shandong, Shanxi, Shaanxi, and Inner Mongolia. The areas with very high HF are only distributed in Gansu Province (, Figure 1 in Appendix).
In the medium-term period, regions with medium HF (2 times < HF ≤ 3 times) and those with low HF account for the highest proportion, 41% and 21% of the wheat-planting areas in northern China, respectively (Figure 2 in Appendix). The areas with medium HF increase significantly by 20% compared with the near-term period and are mainly distributed over the Huang-Huai-Hai Plain, Northeast China, Shaanxi, Shanxi, and Ningxia. Meanwhile, the areas with extremely low HF decrease significantly by 20%, mainly in Ningxia, Shanxi, Shaanxi and Northeast China (, Figure 1 in Appendix).
In the long-term period, areas with high HF (3 times ≤ HF ≤ 4 times) comprise 53% of the wheat-planting areas in northern China (Figure 2 in Appendix). The areas with high HF increase significantly by 33% in the long-term period compared with the medium-term and are mainly distributed in Shanxi, Shaanxi, Northeast China, and over the Huang-Huai-Hai Plain. This result means that more than half of the entire study area will experience high-frequency heatwave hazards in the future (, Figure 1 in Appendix).
Based on the above results, we can conclude that HF in most parts of northern China exhibit an increasing trend. The areas with low and extremely low HF are reduced by 25% and 31%, respectively, while the area with high HF is increased by 47%. The heatwave hazard across the Huang-Huai-Hai Plain and Xinjiang is always the highest, and the hazard in northeast China and the agro-pastoral ecotone also show a fast growth rate.
3.1.2. Heatwave days
The impact of HD on wheat generally shows similar spatial distribution patterns in the near-, medium- and long-term periods (). Overall, it is highest in Xinjiang, Inner Mongolia, and Gansu, while the coastal areas of Northeast China as well as Shandong Province exhibit relatively lower hazard levels. However, over time, the areas with HD at medium levels increase significantly, primarily across the Huang-Huai-Hai Plain and Northeast China (, Figure 3 in Appendix). In contrast, the areas with extremely few HD (0 d ≤ HD ≤ 10 d) decrease significantly on the whole (, Figure 3 in Appendix).
Figure 3. Spatial distribution of HD in northern China (a. 2011–2040; b. 2041–2070; c. 2071–2099).
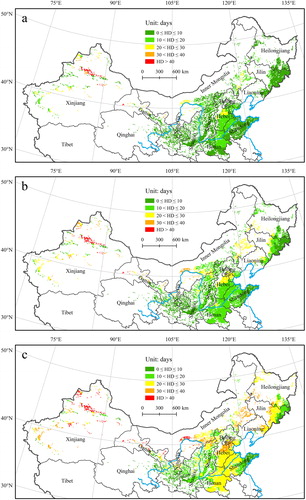
In the near-term period, areas with extremely few HD account for the highest proportion, comprising 70% of the wheat-planting areas in northern China (Figure 4 in Appendix). However, the areas with high and very high HD represent less than 1% of the wheat-planting areas in northern China and are only distributed in Xinjiang and Gansu (, Figure 3 in Appendix).
In the medium-term period, areas with few HD (10 d < HD ≤ 20 d) increase by 22%, accounting for 46% of the wheat-planting areas in northern China (Figure 4 in Appendix); these areas are concentrated over the Huang-Huai-Hai Plain and Northeast China. In contrast, areas with extremely few HD decrease by 34% and are mainly distributed in Shanxi, Inner Mongolia, Northeast China and the Huang-Huai-Hai Plain (, Figure 3 in Appendix).
In the long-term period, areas with medium HD (20 d < HD ≤ 30 d) and those with many HD (30 d < HD ≤ 40 d) increase by 32% and 10%, respectively, accounting for 45% and 13% of the wheat-planting areas in northern China, respectively (Figure 4 in Appendix). In contrast, areas with extremely low HD are located in Northeast China, Shanxi, Shaanxi, Ningxia, and Gansu and decrease by approximately 20%. They also represent areas with obvious increases in hazards during the same period (, Figure 3 in Appendix).
The above results indicate that most of the wheat-planting regions in northern China show a trend of increasing HD. The area with extremely few HD is reduced by 54%, while the area with medium HD is increased by 40%. Wheat heatwave hazard in Xinjiang and Gansu is always the highest, although the hazard in Northeast China, the Huang-Huai-Hai Plain, and Inner Mongolia show a rapid growth rate.
3.1.3. Heatwaves intensity
The impact of the HI on wheat generally shows similar spatial distribution patterns in the near-, medium- and long-term periods (). Overall, the HI is highest across the Huang-Huai-Hai Plain, the agro-pastoral ecotone, north of Gansu and Xinjiang. The coastal area of Northeast China as well as the coastal area of Shandong exhibit relatively lower intensities. Furthermore, over time, the areas of strong and extremely strong HI increase sharply in the near-term period, and they are mainly centralized in Hebei, Henan, Beijing, Tianjin, Inner Mongolia, Gansu, and Xinjiang. At the same time, the areas with extremely low HI decrease significantly (, Figure 5 in Appendix).
Figure 4. Spatial distribution of HI in northern China (a. 2011–2040; b. 2041–2070; c. 2071–2099).
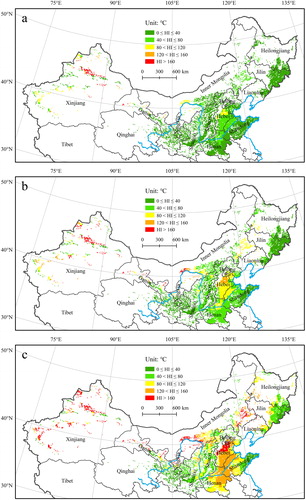
In the near-term period, regions with extremely low HI (0 °C ≤ HI ≤ 40 °C) account for the highest proportion, comprising 75% of the wheat-planting areas in northern China (Figure 6 in Appendix). While the area with medium HI only accounts for 4% and is mainly concentrated in Hebei, Inner Mongolia, and Xinjiang. In this period, Xinjiang and Gansu are the only two regions that experience an extremely strong heatwave hazard (, Figure 5 in Appendix).
In the medium-term period, areas with low HI (40 °C < HI ≤ 80 °C) and those with medium HI (80 °C < HI ≤ 120 °C) increase by 24% and 12%, respectively, comprising 34% and 16% of the wheat-planting areas in northern China, respectively. Within this period, the regions with extremely low HI across the Huang-Huai-Hai Plain, Shanxi, Northeast China and Inner Mongolia are transformed into areas with low HI; whereas the remaining areas with low HI are transformed into areas with medium HI. The regions with low and medium HI are transformed into areas with strong HI in some regions of Hebei and Inner Mongolia, resulting in the area with strong HI increasing from 1% to 4% (, Figure 5 in Appendix).
In the long-term period, areas with strong HI (HI ≥ 120 °C) or more increase by 27%, accounting for 34% of the wheat-planting areas in northern China. Among them, regions with extremely strong HI increase substantially and are mainly centralized across the Huang-Huai-Hai Plain, Inner Mongolia, Ningxia, and Xinjiang. Moreover, the regions with very low HI in Northeast China, Shandong, Gansu, Ningxia, Shaanxi, and Shanxi decrease significantly by 24% in this period, and these regions also exhibit marked increases heatwave hazards during the period (, Figure 5 in Appendix).
The above results indicate that HI in most regions of northern China show an increasing trend. The results show that the area with extremely low HI is reduced by 56%, while the area with strong and extremely strong HI is increased by 32%. The wheat heatwave hazards of northern Gansu and Xinjiang are always the highest, while the hazard across Northeast China, the Huang-Huai-Hai plain and the agro-pastoral ecotone increase rapidly in the future.
3.2. Evolution trends of heatwave hazard impacts on wheat in northern China
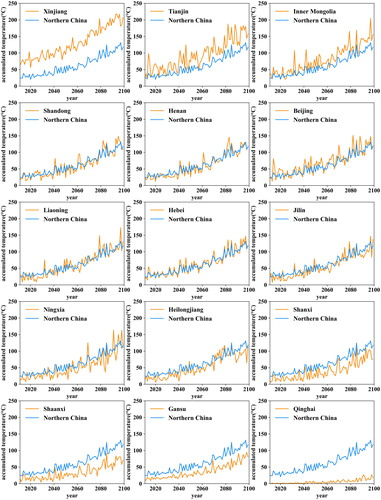
Significant increasing trends with fluctuations in the HF (), HD () and HI () and their impacts on wheat are observed in northern China over time due to climate change from 2011 to 2099. Similarly, in terms of provincial administrative units, the HF (), HD () and HI () all show significant interannually increasing trends. However, the spatial pattern and development trend in the HF, HD, and HI also have regional differences. In terms of the annual HF (), Inner Mongolia, Beijing, and Tianjin always have higher HF than the average level in northern China, while Shanxi, Shaanxi, Hebei, and Henan exhibit a more rapid increase in the rate than the other provinces. From the perspective of the interannual HD (), Inner Mongolia, Liaoning, Jilin, Heilongjiang, and Xinjiang exhibit faster rate increases, while the HD in Tianjin and Xinjiang are always higher than the average level of northern China. As seen from the interannual HI (), Xinjiang always maintains higher HI, and the increasing rates of Tianjin and Inner Mongolia are much faster than those of other provinces.
Figure 5. Temporal variations in heatwave impacts on wheat in northern China.
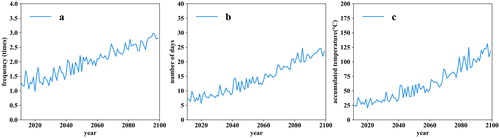
Figure 6. Provincial temporal variation in HF in northern China.
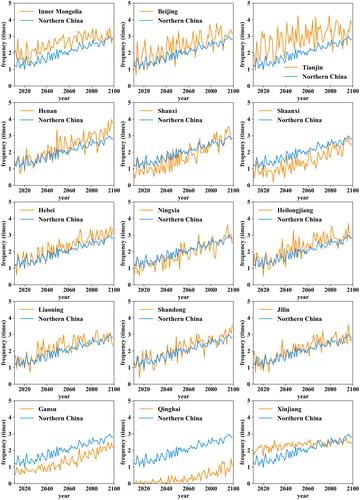
Figure 7. Provincial temporal variation in HD in northern China.
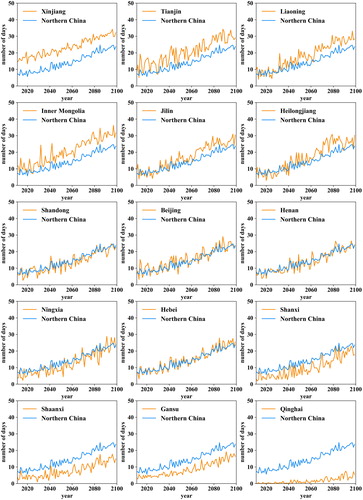
Figure 8. Provincial temporal variation in HI in northern China.
The above results indicate that the heatwave hazard impacts on wheat in northern China in the future show the following remarkable characteristics. Regarding the spatial distribution of heatwave hazards, Xinjiang always exhibits the highest danger level, in addition to the Huang-Huai-Hai Plain. Because the Huang-Huai-Hai Plain and Xinjiang rank 1 and 2 in terms of wheat production areas in China, the prevention of such a natural hazard plays a key role in future wheat production security under a warming climate. In terms of the future trends, areas only slightly affected by heatwaves will decrease; on the contrary, the extent of seriously affected regions will increase. Among them, the former mainly occur in Shanxi, Shaanxi, Ningxia, Northeast China, and Inner Mongolia, while the latter mainly occur across the Huang-Huai-Hai Plain, Northeast China, Inner Mongolia, and Xinjiang. Interannually, Northeast China, Inner Mongolia, and the Huang-Huai-Hai Plain are the regions with rapid increases in heatwave hazards. Moreover, the extent of the heatwave hazard impacts on wheat in Northeast China and Shandong increases in inland areas faster than in coastal regions. We therefore argue that much attention should be paid to the heatwave hazard impacts on wheat across the Huang-Huai-Hai Plain and Xinjiang as well as where heatwaves are predicted to rapidly increase in extent in the future, e.g. Northeast China.
4. Discussion
The research results of this paper indicate that the impact of heatwaves on wheat in northern China will become more frequent and serious as the Earth becomes warmer. This finding coincides with the trend of more serious heatwaves around the world (Meehl and Tebaldi Citation2004; Tebaldi et al. Citation2006), which has been observed in many regions over the past several decades (Schär et al. Citation2004; Peterson et al. Citation2013; Ye et al. Citation2013; Oswald Citation2018). The increase in extreme high-temperature frequencies has been shown to be one of the driving factors for the massive decline in future crop yields (Schlenker and Roberts Citation2009). Based on historical data, it is shown that the threat posed by high temperatures leads to a decrease in the yield of wheat in northern China (Tao et al. Citation2015). Therefore, it can be assumed that China has suffered and will continue to suffer from the threat of heatwaves with higher frequencies and intensities. It is necessary to pay more attention to these heatwaves because they can have direct negative impacts on wheat production or even global food safety (Ainsworth and Ort Citation2010; Chung et al. Citation2014).
For the foreseeable future, heatwaves seem destined to impose a more serious threat to wheat and may occur in regions with high hazards, e.g. the Huang-Huai-Hai Plain and Xinjiang. Moreover, Henan, as one of the regions with the highest heatwave hazard on the Huang-Huai-Hai Plain, has had a growth rate of extreme weather events twice as large as that observed in other regions since the 1990s (Gao et al. Citation2017). The results of this paper demonstrate that Henan will still be one of the warmest regions and thus most profound heatwave hazard impacts on wheat in the future due to its rapid growth in heatwaves ( and ). Thus, advanced management technology is urgently needed for the above regions to cope with the threat posed by heatwaves on wheat (Chen et al. Citation2018).
However, we find that the heatwave frequency in Xinjiang exhibits almost no growth, whereas most provinces in northern China show significant interannual growth. We further find that the annual frequency of heatwaves in Xinjiang in the near-term period is much higher than in other provinces at present. Contrary to the heatwave frequency, the number of heatwave days in Xinjiang shows a significant interannual increasing trend. According to supplementary information (Figure 7 in Appendix), it can be seen that Xinjiang is the only region where the duration of heatwaves is much longer than the average in northern China and also has a faster growth rate. Therefore, we argue that the increase in the duration of heatwaves, such as the combination of two or three short heatwaves into one long-lasting heatwave, hinders the increase in the frequency of heatwaves in Xinjiang.
In addition, despite the relatively lower heatwave hazard level in Northeast China at present, the heatwave hazard in this region, especially Heilongjiang and Jilin Provinces, increases much faster than that of the Huang-Huai-Hai Plain, which exhibits a relatively high heatwave hazard level. Similarly, Leng et al. (Citation2015) also found that the higher the latitude is, the greater the temperature rise in the future in China. Therefore, we conclude that as heatwaves intensify, Northeast China is very likely to experience a greater threat in terms of future wheat production compared with the Huang-Huai-Hai Plain because Northeast China does not have rich experience in dealing with past heatwaves. In addition to Northeast China, a rapid shift from low heatwave hazards to high hazard levels in the agro-pastoral ecotone is also observed (). Considering that the agro-pastoral ecotone is very sensitive to both climate change and human interference (Liu et al. Citation2009; Shi et al. Citation2017), global warming may have a great negative impact on agricultural production in the area. As a result, in regions that currently have relatively low heatwave hazard levels but exhibit rapidly increasing rates of occurrence, corresponding adaptive measures should be implemented as early as possible to avoid the adverse effects of heatwaves on wheat production (Asseng et al. Citation2015).
Furthermore, our results indicate that enhanced heatwave hazard in inland areas is more remarkable than in adjacent coastal areas at the same latitude under extreme climate conditions (). Therefore, we argue that the inland wheat-planting areas in northern China may be more threatened by heatwave hazards, especially in Northeast China and Shandong (). This is partly because significant regional differences exist in extreme temperature changes resulting from the geographical differences between coastal areas and inland (Li et al. Citation2015). Studies of various regions around the world have shown that obvious regional differences exist in extreme temperatures and their variations (Kyselý et al. Citation2000; Nasrallah et al. Citation2004; Vincent et al. Citation2005; Parey et al. Citation2007; You et al. Citation2017). Our findings and the above studies have suggested that countermeasures for mitigating heatwave impacts on wheat (and other crops) must be developed by comprehensively considering the planting distribution of wheat, the actual intensity of heatwaves, their development trends and geographical differences. Such adaptive mitigation measures taken in response to extreme heat events cannot be ignored in heatwave hazard prevention (Chen et al. Citation2016).
There is still room for improvement in the present study. The temperature threshold of 30 °C is selected as a heatwave hazard indicator during the wheat reproductive period, which is consistent with the physiological characteristics of wheat in northern China. However, no consideration has been given to the comprehensive influence of other environmental factors or high temperature on wheat, such as wind speed or atmospheric humidity. In early summer, a dry, hot wind often persists over northern China and has a strong adverse effect on wheat production. Furthermore, from the hazard-affected perspective, not considering the exposure and vulnerability of wheat subjected to heatwaves is clearly insufficient for correctly depicting the heatwave hazard level. In Australia, Wang et al. (Citation2018) showed that changes in the potential distribution of crops can affect final crop yields. Similarly, has been found that climate change may lead to a decline in crop cultivation suitability in many regions, which ultimately leads to a decline in yield (Bunn et al. Citation2015; Yue et al. Citation2019). The above studies show us the importance of calculating the real crop distribution, i.e. the exposure of crops when we evaluate the possible impacts of climate change on crops.
More and more studies have indicated that extreme high temperatures not only result in direct negative impacts on crop yield (Welch et al. Citation2010; Wang et al. Citation2017) but also have indirect negative effects. For example, increased water stress at high temperatures may cause accelerating soil moisture depletion and atmospheric water demand (Schauberger et al. Citation2017). Furthermore, Wang et al. (Citation2018) showed that wheat production is expected to decrease in the future, even after considering the positive impact from CO2 fertilization and adaptation options. In addition, more and more scholars have conducted comparative studies under multiple RCP scenarios, showing that climate change has a significant impact on crops under different scenarios (Cynthia et al. Citation2014; Deryng et al. Citation2014). Therefore, comparisons of different scenarios will deepen our understanding of the mechanisms regarding how climate change affects crops (Iizumi et al. Citation2017) and even affect the degree of adaptive measures taken to address climate change (Martinich and Crimmins Citation2019). Obviously, it is necessary to compare more scenarios to seek a better understanding of the impacts of climate change on crops.
5. Conclusions
Under the background of global warming, quantitatively revealing the evolution trends and variation characteristics of heatwave hazards has great scientific significance for developing countermeasures that are adaptable to address changes in climate. This paper proposes a method that uses heatwave frequency, heatwave days, and the cumulative temperature as indicators of the heatwave hazard impacts on wheat; we also consider the planting distribution and growth period of wheat. With the support of multiple GCMs, quantitative analysis is conducted on the spatial-temporal patterns of the heatwave hazard impacts on wheat in northern China under an extreme climate change scenario, i.e. RCP8.5, from 2011 to 2099. The results are as follows:
The impacts of heatwaves on wheat show an increasing trend in most wheat-planting areas in northern China. The heatwaves across the Huang-Huai-Hai Plain, Xinjiang, western Gansu and the agro-pastoral ecotone are the most profound in the long-term period. The Huang-Huai-Hai Plain, along with regions where heatwave hazard levels are relatively low in the near-term period, such as the agro-pastoral ecotone, Shanxi, Inner Mongolia, and Northeast China, will have a faster increasing rate of heatwaves in the long-term period. Our findings suggest that China's wheat production is expected to be affected by more severe heatwaves in the future because the above areas, especially the Huang-Huai-Hai plain, are the most important wheat production areas in China. Therefore, we argue that special attention and corresponding countermeasures should be given to the above areas for mitigating the negative impacts of heatwaves on wheat by comprehensively considering the planting distribution of wheat, the intensity of heatwaves and geographical differences.
With increasing heatwaves, the effect of heatwaves on wheat yields requires further detailed evaluation by comprehensively considering the exposure and vulnerability of wheat subjected to climate change. Comparing the effects under different climate scenarios as well as corresponding adaptive countermeasures are critical and significant in heatwave hazard prevention.
Supplemental Material
Download MS Word (1.6 MB)Disclosure statement
No potential conflict of interest was reported by the authors.
Additional information
Funding
Related Research Data
References
- Ainsworth EA, Ort DR. 2010. How do we improve crop production in a warming world? Plant Physiol. 154(2):526–530.
- Asseng S, Ewert F, Martre P, Rötter RP, Lobell DB, Cammarano D, Kimball BA, Ottman MJ, Wall GW, White JW, et al. 2015. Rising temperatures reduce global wheat production. Nat Clim Change. 5(2):143–147.
- Bastos A, Gouveia CM, Trigo RM, Running SW. 2014. Analysing the spatio-temporal impacts of the 2003 and 2010 extreme heatwaves on plant productivity in Europe. Biogeosciences. 11(13):3421–3435.
- Blanc É. 2017. Statistical emulators of maize, rice, soybean and wheat yields from global gridded crop models. Agric For Meteorol. 236:145–161.
- Blanc É, Sultan B. 2015. Emulating maize yields from global gridded crop models using statistical estimates. Agric For Meteorol. 214–215:134–147.
- Bunn C, Läderach P, Rivera OO, Kirschke D. 2015. A bitter cup: climate change profile of global production of Arabica and Robusta coffee. Clim Change. 129(1–2):89–101.
- Butler EE, Huybers P. 2013. Adaptation of US maize to temperature variations. Nat Clim Change. 3(1):68–72.
- Cai B, Liu S, Fei Y, Yang Z, Huang H. 2011. The risk grading regionalization of meteorological disaster of facilities agriculture in Jiangsu province. Chin Agric Sci Bull. 27(20):285–291.
- Chen Y, Zhang Z, Tao F, Palosuo T, Rötter RP. 2018. Impacts of heat stress on leaf area index and growth duration of winter wheat in the north China Plain. Field Crops Res. 222:230–237.
- Chen Y, Zhang Z, Wang P, Song X, Wei X, Tao F. 2016. Identifying the impact of multi-hazards on crop yield—A case for heat stress and dry stress on winter wheat yield in northern China. Eur J Agron. 73(73):55–63.
- Chung U, Gbegbelegbe S, Shiferaw B, Robertson R, Yun JI, Tesfaye K, Hoogenboom G, Sonder K. 2014. Modeling the effect of a heat wave on maize production in the USA and its implications on food security in the developing world. Weather Clim Extremes. 5–6:67–77.
- Coumou D, Rahmstorf S. 2012. A decade of weather extremes.Nat Clim Change. 2(7):491–496.
- Cynthia R, Joshua E, Delphine D, Ruane AC, Christoph M, Almut A, … Nikolay K. 2014. Assessing agricultural risks of climate change in the 21st century in a global gridded crop model intercomparison. Proc Natl Acad Sci USA. 111(9):3268–3273.
- Deng Z, Xu J, Huang L, Zhang S. 2009. Research summary of the damagecharacteristics of the wheat dry hot wind in northern China. J Anhui Agric Sci. 37(20):9575–9577 (in Chinese with English abstract).
- Deryng D, Conway D, Ramankutty N, Price J, Warren R. 2014. Global crop yield response to extreme heat stress under multiple climate change futures. Environ Res Lett. 9(3):034011–032053.
- Dong W, Liu Z, Liao H, Tang Q, Li X. e. 2015. New climate and socio-economic scenarios for assessing global human health challenges due to heat risk. Clim Change. 130(4):505–518.
- Gao W, Li K, Cui Y. 2017. Temporal and spatial variation of extreme temperature events in Henan province during 1960–2014. Scientia Geographica Sinica. 37(8):1259–1269 (in Chinese with English abstract).
- Hempel S, Frieler K, Warszawski L, Schewe J, Piontek F. 2013. A trend-preserving bias correction the ISI-MIP approach. Earth Syst Dynam. 4(2):219–236.
- Huynen MM, Martens P, Schram D, Weijenberg MP, Kunst AE. 2001. The impact of heat waves and cold spells on mortality rates in the Dutch population. Environ Health Perspect. 109(5):463–470.
- Iizumi T, Furuya J, Shen Z, Kim W, Okada M, Fujimori S, Hasegawa T, Nishimori M. 2017. Responses of crop yield growth to global temperature and socioeconomic changes. Sci Rep. 7(1):7800.
- IPCC. 2014. Climate Change 2014: Synthesis Report. Contribution of Working Groups I, II and III to the Fifth Assessment Report of the Intergovernmental Panel on Climate Change. Available at: http://epic.awi.de/37530/
- Jia J, Hu Z. 2017. Spatial and temporal features and trend of different level heat waves over China. Adv Earth Sci. 32(5):546–559. (in Chinese with English abstract).
- Kalkstein LS, Jamason PF, Greene JS, Libby J, Robinson L. 1996. The Philadelphia hot weather–health watch/warning system: development and application, Summer 1995. Bull Amer Meteor Soc. 77(7):1519–1528.
- Karl TR, Knight RW. 1997. The 1995 Chicago heat wave: how likely is a recurrence? Bull Amer Meteor Soc. 78(6):1107–1120.
- Kyselý J, Kalvová J, Květoň V. 2000. Heat waves in the south Moravian region during the period 1961–1995. Studia Geophysica Et Geodaetica 44(1):57–72.
- Leng G, Tang Q, Rayburg S. 2015. Climate change impacts on meteorological, agricultural and hydrological droughts in China. Global Planet Change. 126:23–34.
- Li Y, Wang Y, Lv X, Ye Y, Ji Y. 2015. Spatial distribution and temporal change in extreme weather events in three provinces in northeast China. Resour Sci. 37(12):2501–2513. (in Chinese with English abstract).
- Liu B, Asseng S, Liu L, Tang L, Cao W, Zhu Y. 2016. Testing the responses of four wheat crop models to heat stress at anthesis and grain filling. Glob Change Biol. 22(5):1890–1903.
- Liu H, Wang Y, Dou X, Xu M, Wang K. 2009. Progress and perspective of agro-pasturage ecotone. Acta Ecologica. 29(8):4420–4425 (in Chinese with English abstract).
- Lobell DB, Bänziger M, Magorokosho C, Vivek B. 2011. Nonlinear heat effects on African maize as evidenced by historical yield trials. Nat Clim Change. 1(1):42.
- Lobell DB, Sibley A, Ivan Ortiz-Monasterio J. 2012. Extreme heat effects on wheat senescence in India. Nat Clim Change. 2(3):186–189.
- Martinich J, Crimmins A. 2019. Climate damages and adaptation potential across diverse sectors of the United States. Nat Clim Change. 9(5):397–404.
- Meehl GA, Tebaldi C. 2004. More intense, more frequent, and longer lasting heat waves in the 21st century. Science. 305(5686):994–997.
- Meng L, Wang C, Ren Y, Zhang J. 2015. Heat injury hazard characteristic of single cropping rice in middle and low reachers of Yangtze river and its response to climate change. J Nat Disasters. 6:80–89. (in Chinese with English abstract).
- Müller C, Robertson RD. 2014. Projecting future crop productivity for global economic modeling. Agric Econ. 45(1):37–50.
- Nasrallah HA, Nieplova E, Ramadan E. 2004. Warm season extreme temperature events in Kuwait. J Arid Environ. 56(2):357–371.
- NBSC. 2017. China statistical database. Available at: http://www.stats.gov.cn/tjsj/ndsj/2017/indexch.htm.
- Nuttall J. 2012. Heat waves and wheat growth under a future climate. Regional Institute Ltd. Available at: http://agronomyaustraliaproceedings.org/images/sampledata/2012/8085_5_nuttall.pdf.
- Oswald EM. 2018. An analysis of the prevalence of heat waves in the United States between 1948 and 2015. J Appl Meteor Climatol. 57(7):1535–1549.
- Parey S, Malek F, Laurent C, Dacunha-Castelle D. 2007. Trends and climate evolution: statistical approach for very high temperatures in France. Clim Change. 81(3–4):331–352.
- Peterson TC, Heim RR, Hirsch R, Kaiser DP, Brooks H, Diffenbaugh NS, Dole RM, Giovannettone JP, Guirguis K, Karl TR, et al. 2013. Monitoring and understanding changes in heat waves, cold waves, floods, and droughts in the United States: state of knowledge. Bull Amer Meteor Soc. 94(6):821–834.
- Rezaei EE, Siebert S, Ewert F. 2015. Intensity of heat stress in winter wheat—phenology compensates for the adverse effect of global warming. Environ Res Lett. 10(2):024012.
- Schär C, Vidale PL, Lüthi D, Frei C, Häberli C, Liniger MA, Appenzeller C. 2004. The role of increasing temperature variability in European summer heatwaves. Nature. 427(6972):332.
- Schauberger B, Archontoulis S, Arneth A, Balkovic J, Ciais P, Deryng D, Elliott J, Folberth C, Khabarov N, Müller C, et al. 2017. Consistent negative response of US crops to high temperatures in observations and crop models. Nat Commun. 8(1):13931.
- Schlenker W, Roberts MJ. 2009. Nonlinear temperature effects indicate severe damages to U.S. crop yields under climate change. PNAS. 106(37):15594–15598.
- Semenov MA. 2008. Impacts of climate change on wheat in England and Wales.J R Soc Interface. 6(33):343–350.
- Shi W, Liu Y, Shi X. 2017. Quantitative methods for detecting the impacts of climate change on the fluctuation of farming-pastoral ecotone boundaries in northern China. Acta Geographica Sinica. 72(3):407–419 (in Chinese with English abstract).
- Shimono H. 2011. Earlier rice phenology as a result of climate change can increase the risk of cold damage during reproductive growth in northern Japan. Agric Ecosyst Environ. 144(1):201–207.
- Tao F, Zhang Z, Zhang S, Rötter RP. 2015. Heat stress impacts on wheat growth and yield were reduced in the Huang-Huai-Hai plain of China in the past three decades. Eur J Agron. 71:44–52.
- Tebaldi C, Hayhoe K, Arblaster J, Meehl G. 2006. Going to the extremes: An intercomparison of model-simulated historical and future changes in extreme events. Clim Change. 79(3–4):185–234.
- Teixeira EI, Fischer G, van Velthuizen H, Walter C, Ewert F. 2013. Global hot-spots of heat stress on agricultural crops due to climate change. Agric For Meteorol. 170:206–215.
- USDA. 2018. World agricultural production. Circular series WAP 8-18. Available at: https://apps.fas.usda.gov/psdonline/circulars/production.pdf.
- van Vuuren DP, Edmonds J, Kainuma M, Riahi K, Thomson A, Hibbard K, Hurtt GC, Kram T, Krey V, Lamarque J-F, et al. 2011. The representative concentration pathways: an overview. Clim Change. 109(1–2):5.
- Vincent LA, Peterson TC, Barros VR, Marino MB, Rusticucci M, Carrasco G, Ramirez E, Alves LM, Ambrizzi T, Berlato MA, et al. 2005. Observed trends in indices of daily temperature extremes in South America 1960–2000. J Climate. 18(23):5011–5023.
- Wang B, Liu D, Asseng S, Macadam I, Yu Q. 2017. Modelling wheat yield change under CO2 increase, heat and water stress in relation to plant available water capacity in eastern Australia. Eur J Agron. 90:152–161.
- Wang B, Liu D, O'Leary GJ, Asseng S, Macadam I, Lines-Kelly R, Yang X, Clark A, Crean J, Sides T, et al. 2018. Australian wheat production expected to decrease by the late 21st century. Glob Change Biol. 24(6):2403–2415.
- Wang X, Zeng J. 2017. Study on city heatwave hazard planning strategies based on European and North American countries planning experience. Mod Urban Res. 8:84–92 (in Chinese with English abstract).
- Welch JR, Vincent JR, Auffhammer M, Moya PF, Dobermann A, Dawe D. 2010. Rice yields in tropical/subtropical Asia exhibit large but opposing sensitivities to minimum and maximum temperatures. Proc Natl Acad Sci. 107(33):14562–14567.
- Wheeler TR, Craufurd PQ, Ellis RH, Porter JR, Prasad PVV. 2000. Temperature variability and the yield of annual crops. Agric Ecosyst Environ. 82(1–3):159–167.
- Xiong W, Feng L, Ju H, Yang D. 2016. Possible impacts of high temperatures on China’s rice yield under climate change. Adv Earth Sci. 31(5):515–528 (in Chinese with English abstract).
- Xu J, Deng Z, Chen M. 2009. A summary of studying on characteristics of high temperature and heatwave damage in China. J Arid Meteorol. 27(2):163–167. (in Chinese with English abstract).
- Yang M, Xiao W, Zhao Y, Li X, Huang Y, Lu F, Hou B, Li B. 2018. Assessment of potential climate change effects on the rice yield and water footprint in the Nanliujiang catchment, China. Sustainability. 10(2):242.
- Yang X, Tang X, Chen B, Tian Z, Zhong H. 2013. Impacts of heat stress on wheat yield due to climatic warming in China. Prog Geogr. 32(12):1771–1779 (in Chinese with English abstract).
- Ye D, Yin J, Chen Z, Zheng Y, Wu R. 2013. Spatiotemporal change characteristics of summer heatwaves in China in 1961–2010. Progressus Inquisitiones de Mutatione Climatis. 9(1):15–20 (in Chinese with English abstract).
- Yin Y, Tang Q, Liu X. 2015. A multi-model analysis of change in potential yield of major crops in China under climate change. Earth Syst Dynam. 6(1):45–59.
- You Q, Jiang Z, Kong L, Wu Z, Bao Y, Kang S, Pepin N. 2017. A comparison of heat wave climatologies and trends in China based on multiple definitions. Clim Dyn. 48(11–12):3975–3989.
- Yue Y, Li J, Ye X, Wang Z, Zhu A, Wang J. 2015. An EPIC model-based vulnerability assessment of wheat subject to drought. Nat Hazards. 78(3):1629–1652.
- Yue Y, Zhang P, Shang Y. 2019. The potential global distribution and dynamics of wheat under multiple climate change scenarios. Sci Total Environ. 688:1308–1318.
- Zhang P, Huang Z, Zhang W, Wang Q, Liu M. 2015. Effect of high temperature on photosynthetic performance in wheat. J Anhui Agric Univ. 42(1):92–96 (in Chinese with English abstract).
- Zhang Z, Wang P, Chen Y, Zhang S, Tao F, Liu X. 2013. Spatio-temporal changes of agrometrorological disasters for wheat production across China since 1990. Acta Geographica Sinica. 68(11):1453–1460 (in Chinese with English abstract).
- Zhao G. 2010a. Study on Chinese wheat planting regionalization (I). J Triticeae Crops. 30(5):886–895 (in Chinese with English abstract).
- Zhao G. 2010b. Study on Chinese wheat planting regionalization (II). J Triticeae Crops. 30(6):1140–1147 (in Chinese with English abstract).
- Zhao J, Zhang Q, Zhao S. 2013. A preliminary study of integrated assessment of wheat natural disaster risk in China. Scientia Agricultura Sinica. 46(4):705–714 (in Chinese with English abstract).