
 ?Mathematical formulae have been encoded as MathML and are displayed in this HTML version using MathJax in order to improve their display. Uncheck the box to turn MathJax off. This feature requires Javascript. Click on a formula to zoom.
Abstract
A case study using shear wave velocity (Vs) data obtained from seismic multi-channel analysis of surface wave (MASW) studies was used to evaluate site conditions in Phrae City, Northern Thailand. The MASW data was acquired at 40 sites that covered the entire city area. The main goal was to generate seismic microzonation maps for Phrae City. The NEHRP map generated from the Vs data closely matched the surficial geological map. Areas mapped as alluvium soil were assigned to NEHRP soil class D, while areas mapped as colluvium and river terrace soils, in contrast, fell into the NEHRP soil class C. The amplification map indicated a higher amplification in the west and central part of the city, where the soils mostly consisted of soft sediments from alluvial deposits. The eastern study area had a relatively low amplification, because the sediments in this area mostly consisted of coarse grain sediments. The site period map revealed that three- to four-story buildings were likely to be susceptible to ground shaking in most parts of the city, whereas one- to two-story buildings were only vulnerable in the eastern part of the study area.
1. Introduction
One of the properties of unconsolidated sediments is that it amplify earthquake ground motions, and this affects the stability of structures far from the epicenter of the earthquake. Softer sediments will usually amplify the earthquake energy more than stiffer sediments (Maheswari et al. Citation2010). Several studies have investigated the correlation between the shear-wave velocity of soils (Vs) and the ground motion during earthquakes (Park and Elrick Citation1998; Stewart et al. Citation2003; Boore et al. Citation2011). Consequently, the convenient way to estimate soil amplification is by determining the Vs of soils in the area. The average Vs of a 30 m soil column (Vs(30)) is a very important parameter in estimating the site amplification during an earthquake (Borcherdt Citation1994; Dobry et al. Citation2000; Holzer et al. Citation2005; Kanli et al. Citation2006). In areas of low to moderate seismicity, the correlation between soils and their Vs is one of the means to classify the distribution of the earthquake site effect. This approach was used to generate local and regional maps (Wills et al. Citation2000; Tan et al. Citation2014) according to the site categories of the National Earthquake Hazards Reduction Program (NEHRP) and to predict amplification factors as well as the natural site period of soils.
Geophysical methods, such as seismic refraction and downhole seismic techniques, have been used to determine the Vs for earthquake hazard mapping (Imtiaz et al. Citation2018; Sana Citation2018; Pagliaroli et al. Citation2019). However, in recent years the multi-channel analysis of surface wave (MASW) technique was developed by the Kansas Geological Survey to determine the Vs of soils (Park et al. Citation1999). The technique was developed from the spectral analysis of surface wave (SASW) method used in the civil engineering community for many years. In this study, the MASW data were acquired at 40 sites in Phrae City, with the main goal of generating the seismic microzonation maps, including the NEHRP site class, the site amplification and natural site period maps. The resulting maps will help the city assess its earthquake shaking vulnerability and mitigation plans.
2. Geologic setting of the study area
Phrae City is in the northern part of Thailand, approximately 670 km north-northeast from Bangkok and 100 km south-east of Chiang Mai City. The city is situated in the Cenozoic intermontane Phrae basin, which lies between 18° to 18° 35' N latitude and 100° to 100° 20' E longitude. The shape of the basin is an ellipse, in an NNE-SSW direction, approximately 60 km long and 15 km wide and covers an area of about 1,100 km2. Geomorphically, Phrae city is in the intermontane basin, which is found throughout Northern Thailand, where all the major intermontane basins are thought to have developed during the Late Eocene to early Oligocene and are aligned in a nearly N-S trending direction (Charusiri and Somchai Citation2009). These basins were generally formed as a result of the extrusion tectonics of the Southeast Asian block along the major NE-SW trending fault zones.
The study area is 400 km2 and covers the entire city area. The geological map of the study area is shown in . Sedimentary rocks, such as limestone and clastic rocks are found in the western and eastern parts of the study area. The unconsolidated Quaternary age sediments found in the area can be separated into two units, the alluvial plain (Qa) and the terrace (Qt), as shown in . The Qa is found in the western and eastern part of the study area along or near both sides of the Yom River channel and consists mainly of sand and silt with some clay. Due to the limited borehole information in collected in that area, the thickness of the unconsolidated sediments could not be determined, but it is expected that the thickness of this sediment is over 100 m in the central part of the basin. The terrace (Qt) unit consists of mostly gravel and sand and is found at the western and eastern sides of the study area. The thickness of the Qt soil unit is thicker in the eastern side than in the western side. However, the colluvium soil unit can also be found near the foot of hills and mountains.
Figure 1. Geological map of the study area, the MASW test sites (numbered red dots) and locations of the boreholes (numbered blue dots) used in the study.
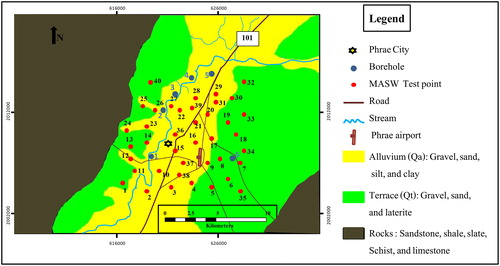
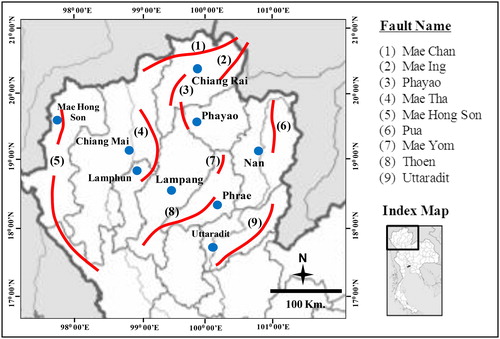
Figure 2. Active faults in Northern Thailand (Thitimakorn Citation2013).
3. Seismicity of Phrae city
In seismic terms, Phrae City is in a low to moderate seismic hazard area; there are historic records of several earthquakes in the area (Nutalaya et al. Citation1985). The most recent earthquake was on May 5, 2014, which was in the Dongmada Subdistrict, Maelao District, Chiang Rai Province, with a magnitude of 6.2 Mw and a depth of 7.4 km below the surface. The epicenter of this earthquake was about 170 km north of Phrae City. The main shock and its aftershocks occurred in the vicinity of several potentially active faults in the Phayao Fault Zone and were felt throughout Northern Thailand. They caused some damage to the nearby cities, including Chiang Rai and Chiang Mai, as well as Phrae. The 2014 Mae Lao earthquake is the largest instrumentally recorded earthquake to occur in Thailand.
Another earthquake of 6.3 Mw occurred on May 16, 2007, with the epicenter located in the northern part of P.D.R. Laos. This earthquake also caused some damage to several buildings in northern cities of Thailand. The active faults in northern Thailand and the vicinity are shown in . The Mae Chan and Phayao fault zones are considered to be the main threat to the northern cities because they can produce an earthquake up to Mw 6 (Hinthong Citation1995), while the soils underneath the major northern cities can amplify the earthquake ground motion up to three-fold (Pattararattanakul Citation2003). Moreover, the unconsolidated sediments in some areas of these cities can be subjected to liquefaction by a nearby earthquake up to Mw 5 (Teachavaorainskul and Nuntasarn 2005).
4. NEHRP site-class, soil amplification and site period
Several methods for classifying soils and rocks based on their site-dependent amplification properties have been proposed (Joyner et al. Citation1981; Tinsley and Fumal Citation1985; Borcherdt et al. Citation1991; Borcherdt Citation1994; Wills et al. Citation2000). For example, the site conditions can be characterized using the average Vs to a depth equal to one quarter of the wavelength of the dominant frequency of interest (Joyner et al. Citation1981). However, this method has not been widely used, probably because it is relatively difficult to apply. Borcherdt et al., (Citation1991) simplified the method by demonstrating a correlation between the ground motion amplification and the average Vs of the upper 30 m of sediments and/or rocks; this approach has since been incorporated into the NEHRP program. The current NEHRP approach categorizes soils into six classes (A–F) based on their vertical Vs profile, thickness and liquefaction potential.
For the purpose of earthquake hazard investigations, according to the NEHRP guidelines, the Vs of the soils must be measured or estimated to a depth of 30 m. The Vs(30) at a specific site is calculated using EquationEq. (1)(1)
(1) ;
(1)
(1)
where Vs(i) is the Vs of any layer in m/s and di is the thickness of any layer (between 0–30 m).
shows the soil profile type classification system used by the NEHRP. Anderson et al. (Citation1986) evaluated the use of the average Vs(30) values and reported that attenuation affects the ground motions as much as the Vs, particularly for deeper geologic deposits. Although attenuation is not directly included in the current NEHRP provisions, it is accounted for in seismic hazard maps.
Table 1. The NEHRP soil profile type classification for seismic amplification (BSSC Citation2003).
When planning the construction of any type of structure, it is very important to determine the potential soil amplifications caused by earthquakes. Soft soils increase the earthquake energy during an earthquake and are responsible for a large share of earthquake damage. In this study, the Vs data obtained by the MASW approach were used to determine the probable soil amplification of the soils in the Phrae City area, since the Vs is known to be an index property used to evaluate soil amplifications. The Vs(30) and soil amplification (A) relationships (Midorikawa Citation1987) are given in EquationEqs. (2)(2)
(2) and Equation(3)
(3)
(3) :
(2)
(2)
(3)
(3)
In fact, soil amplification is dependent on other soil properties such as profile, types (sand/silt/clay), shear modulus and damping ratio. So, in this study this relationship was used only to determine the preliminary soil amplification of the area.
The fundamental site period (Ts) corresponds to the first mode of vibration in the soils, and is used as one of the important parameters for seismic hazard mapping. It is governed by the thickness and Vs of the soil layer and is calculated from EquationEq. (4)(4)
(4) (Kramer Citation1996);
(4)
(4)
where H is the total thickness of the alluvium sediments and Vs is the average shear wave velocity of the overburden soil.
However, the total soil thickness of each MASW test site down to the bedrock is rarely known due to a limited number of boreholes that reach the bedrock. Especially in Phrae city, most geotechnical boreholes were not drilled to deeper than 20 m. Therefore, in this study, the depth (H) in EquationEq. (4)(4)
(4) is assigned to 30 m, which was derived by means of the Quarter-wavelength approximation proposed by Kramer (Citation1996). In addition, the depth from the surface to 30 m is very important for building foundation design and is subject to earthquake ground motion amplification (Boore Citation2003; Boore et al. Citation2011).
5. Materials and methods (MASW technique)
Currently, the most widely used technique to determine the Vs of soils is the surface wave method. The surface wave has generally been viewed as an unwanted signal in seismic surveys, and as such is normally filtered out during data processing. Surface waves propagate along or near the ground surface and are typically characterized by a low velocity, low frequency and high amplitude (Sheriff Citation1991). By inverting the fundamental mode of the surface wave, the Vs profile of the soil can be determined.
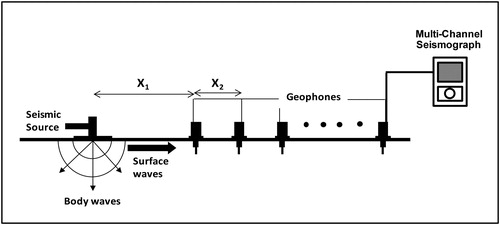
The MASW method generates a one-dimensional (1 D) vertical Vs profile by analyzing the Rayleigh surface waves on a multi-channel record. The method utilizes energy commonly considered to be noise on conventional seismic surveys. The acquisition of 1 D MASW data is similar to conventional seismic data acquisition (). Generally, 12 to 24 low-frequency vertical-component geophones, placed at X2 intervals, are centered on each test location. The source is at X1 and is typically either a sledgehammer or an accelerated-weight drop. The seismic signal is then detected by the geophones and sent to the seismograph for recording and display.
Figure 3. Schematic diagram showing the MASW data acquisition field setup.
In this study, the MASW data were collected at 40 sites throughout the study area () with a 24-channel geode engineering seismograph using 24 individual 4.5 Hz vertical component geophones. The geophones were placed 2 m apart from each other. A 12-lb sledgehammer was used as the source and was struck on a metal plate 10 m away from the first geophone. The acquired MASW data were processed using the Kansas Geological Survey software package SURFSEIS.
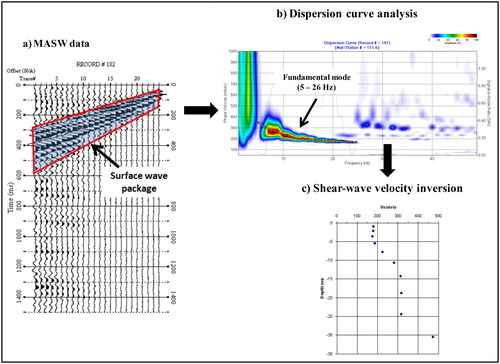
The steps for processing the MASW data are shown in . The field-based seismic data () were used to generate dispersion curves () for each station location. In this example, the fundamental mode of Rayleigh wave ranged from 5 to 26 Hz. Then, the picked dispersion curve from was transformed into vertical 1 D Vs profiles () by the inversion technique (Park et al. Citation1999). The depth of investigation depended on the low frequency content of the data; in this example the depth of investigation was about 30 meters.
Figure 4. Processing steps for MASW data showing the (a) MASW shot gather, (b) corresponding overtone image with picked fundamental-mode of dispersion curve, and (c) Vs profile.
6. Characteristics of the Vs at different soil deposits
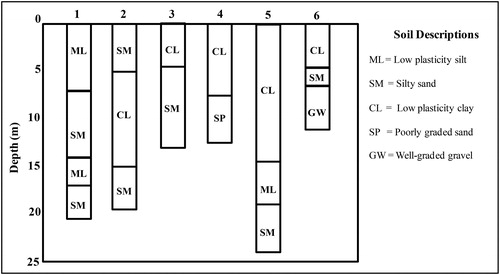
In order to determine the Vs distribution in Phrae City, the results of 40 Vs profiles were gathered and compared. In total 27 and 13 MASW surveys were performed in the Qa and Qt soils, respectively. shows the variations in Vs, in terms of the depth from the surface, for the Qa and Qt soil units. Most of the Vs information for both types of soil unit extended below 30 m. The Vs increased gradually with depth for all soil units. The trend of variation in Vs with depth suggested that the quadratic function could best describe the trends. shows representative soil profiles of the six boreholes in the study area. Boreholes no. 1–5 were drilled in alluvial deposits (Qa) and no. 6 was drilled in a terrace deposit (Qt). Boreholes 1–5 had low Vs values and consisted of thick layers of clay, silt and silty sand of alluvial deposit from the Yom River. In contrast, borehole no. 6 had a high Vs value and was characterized by sand and gravel.
Figure 5. Variation of Vs with depth in (a) alluvium (Qa) and (b) terrace (Qt) soil units.
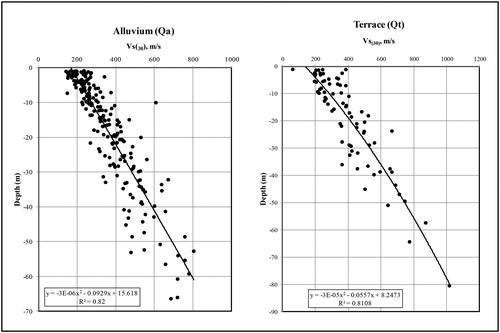
Figure 6. Representative soil profile in the study area from the six boreholes.
7. Vs(30) and NEHRP site classification map
To create the NEHRP map, the Vs(30)of each test site was calculated using EquationEq. (1)(1)
(1) and the obtained Vs(30) values were also used to classify the soil based on the recommendations of the 2003 NEHRP (BSSC Citation2003), as shown in . Finally, the NEHRP site classification map was generated. shows the values of Vs(30), NEHRP site class, amplification and site period of each test site, while shows the plot of Vs(30) for the different soil units. Most of the test sites in the Qa soil units were in the NEHRP class D, but there were some test sites that were along the boundary of soil units and may be class C, such as site no. 30. The test site in the Qt soil unit fell into both class C and D. However, the Vs(30) of this soil unit was neither too high nor too low, suggesting that the soil of this unit is a little bit soft. shows the distribution of Vs(30) in the study area.
Figure 7. Plot of Vs(30) in the (a) alluvium (Qa) and (b) terrace (Qt) soil units at different MASW stations.
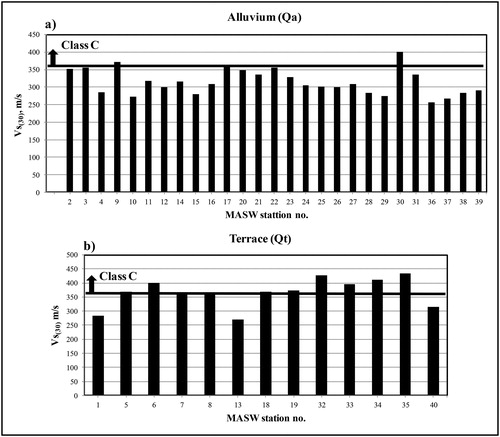
Figure 8. Map showing the Vs(30) around Phrae City and its location within Thailand.
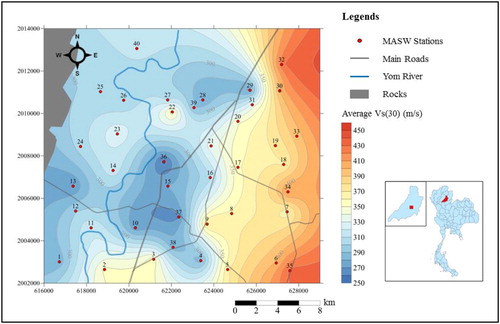
Table 2. NEHRP site classification for each soil unit.
The NEHRP map of Phrae City was generated based on the Vs(30) map and is shown in . The NEHRP map revealed that there were only two soil classes (class C and D) in the study area, which closely matched the surficial geologic map (). Thus, areas mapped on the existing surficial geology map as alluvium soil had average Vs(30) values of 315 m/s, corresponding to NEHRP soil class D. Areas mapped as river terrace and some colluvium soils, in contrast, had average Vs(30) values of 367 m/s and corresponded to NEHRP soil class C. As seen on the map, soil class D was present in the western and central parts of the area, while soil class C was mostly situated in the eastern part. The terrace deposit in the western side of the area had a low Vs(30) and was assigned to site class D. This was probably due either to the terrace soil layer being thin in this area or the alluvial soils underneath consisting of mostly silt sand and clay which generally exhibit low velocity compared to terrace soils.
Figure 9. Map of NEHRP site classifications for Phrae City.
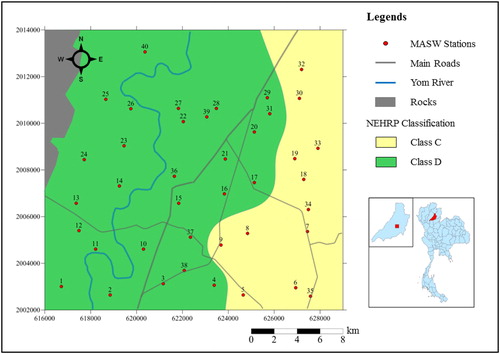
However, the main part of the city is situated on soil class D. From the NEHRP recommendation, soils with lower Vs values will experience more ground shaking than higher Vs, due to the amplifying properties of the soil. This means that most of Phrae City will experience some soil amplification from earthquake ground motion, either from nearby or from larger but distant seismic sources.
8. Preliminary site amplification map
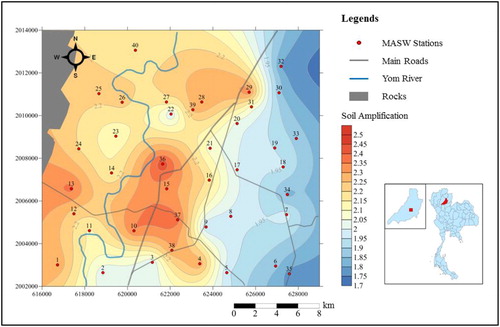
The preliminary site amplification map was also generated based on the Vs(30) values, using the relationship provided by Midorikawa (Citation1987), and is shown in . Since the average Vs(30) values of soils in the study area were less than 1,100 m/s, EquationEq. (2)(2)
(2) was used to calculate the amplification value for the area. The derived soil amplification value ranged from 1.8–2.4, with higher amplification in the west and central part where the soils were mostly soft sediments from the alluvial plain and some river terrace (). In the eastern part of the study area, the amplification was relatively low, presumably because the sediments in this part mostly consisted of sand and gravel from the river terrace and some colluvial deposits. Most parts of Phrae City are in a relatively high amplification area (>2.0), which means that the city will experience some soil amplification from earthquake ground motion.
Figure 10. Preliminary soil amplification map of Phrae city.
9. Natural site period
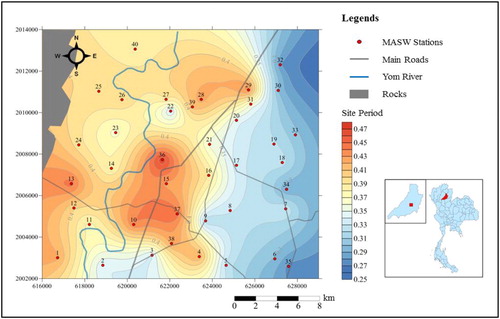
The developed site period map, shown in , was calculated using EquationEq. (4)(4)
(4) and indicated that the western and central part of Phrae city had a high site period ranging from 0.47–0.35 s, due to the low Vs(30) values of the alluvium sediments and some river terraces. Since the clay and clayey-sand were distributed in most parts of the city, the observed natural period is relatively high due to the fact that these deposits are relatively thick and usually had a relatively low Vs(30) value. Whereas, the site period in the eastern part of the city ranged from 0.25–0.35 s, due to the higher Vs(30) values of the terrace and colluvial deposits.
Figure 11. Natural site period map of Phrae City.
Generally, if the fundamental site period of soils approaches the natural period of the building at that location, then the damage to the building will be very severe. The natural period of a building (T) can be calculated using EquationEq. (5)(5)
(5) (Di Julio Citation2001),
(5)
(5)
where N is the number of stories.
The natural periods of buildings with different stories were calculated based on EquationEq. (5)(5)
(5) and are shown in . and show that three- to four-story buildings are more vulnerable in the western and central parts of the city and one- to two-story buildings are vulnerable in the eastern side of the study area due to identical value of the periods between buildings and soil. Therefore, the soil conditions of Phrae City tend to pose a potential risk of damage, especially to three- and four-story buildings during an earthquake.
Table 3. Natural period of buildings with different stories.
10. Conclusion
This study presented the distribution of Vs(30) values in the soils throughout the Phrae City area. The Vs profiles were determined using the MASW method from data collected at 40 sites selected to cover as much of the city as possible. The Vs profiles of each test site were then used to calculate the Vs(30) values and the NEHRP site classification was assigned for each test site. The results revealed that areas mapped on the existing surficial geology map as alluvium soil had average Vs(30) values of 321 m/s (NEHRP soil class D), while areas mapped as river terrace and some colluvium soils had average Vs(30) values of 361 m/s (NEHRP soil class C). Based on the site classification map, we conclude that the Phrae City area that is located on soil class D is under risk of soil amplification.
The Vs data obtained by the MASW method were used to determine the probable soil amplification of soils in the Phrae City area using the Vs(30) and soil amplification (A) relationships (Midorikawa Citation1987), as given in EquationEqs. (2)(2)
(2) and Equation(3)
(3)
(3) . The study revealed that soil amplification in Phrae City is high in the west and central part of the city but low in the eastern part. This is supported by the geological data, as the sediments in the east are mostly young sediments from rivers and hills.
The NEHRP site class and soil amplification maps presented in this study provide preliminary information on the soil conditions of the city that can be used for city planning. Although the map represents the first of its kind in the area, it still has some limitations. The MASW test sites were not distributed uniformly throughout the study area due to budget limitations and the difficulty of acquiring MASW data in highly populated areas. Therefore, great care must be taken when using this map, particularly when dealing with site-specification evaluation in the city area.
The developed site period map reveals that three- to four-story buildings are more susceptible to ground shaking in most parts of the city area, while one- to two-story buildings are vulnerable in the eastern part of the city. Therefore, the soil conditions of Phrae City pose a potential risk during an earthquake to low-rise buildings (less than four-stories).
Disclosure statement
The authors have no conflicts of interest to declare.
Additional information
Funding
References
- Anderson JG, Bodin P, Brune JN, Prince J, Singh SK, Quaas R, Onate M. 1986. Strong ground motion from the Michoacan, Mexico, earthquake. Science. 233(4768):1043–1049.
- Boore DM, Thompson EM, Cadet H. 2011. Regional correlations of VS30 and velocities averaged over depths less than and greater than 30 meters. Bull Seismol Soc Am. 101(6):3046–3059.
- Boore DM. 2003. A compendium of P- and S-wave velocities from surface-to-borehole logging: summary and reanalysis of previously published data and analysis of unpublished data. U.S. Geological Survey, Open-File Report 03-191, 13pp. Virginia: Reston.
- Borcherdt RD, Wentworth CM, Janssen A, Fumal TE, Gibbs JF. 1991. Methodology of predictive GIS mapping for special study zones for strong ground shaking in the San Francisco Bay Region, CA. Proceedings of the 4th International Conference on Seismic Zonation, vol. 3; p. 545–552. California: Stanford.
- Borcherdt RD. 1994. New developments in estimating site effects on ground motion. Proceedings of Seminar on New Developments in Earthquake Ground Motion Estimation and Implications for Engineering Design Practice, Applied Technology Council, vol. 35-1; p. 101–1–10-44. California: Redwood City.
- BSSC. 2003. NEHRP recommended provisions for seismic regulations for new buildings and other structures, part 1: provisions. Washington (DC): Federal Emergency Management Agency. FEMA 368.
- Charusiri P, Somchai P. 2009. Cenozoic tectonic evolution of major sedimentary basins in Central, Northern, and the Gulf of Thailand. BEST. 2(1&2):40–62.
- Di Julio RM. 2001. Linear static seismic lateral force procedures. In: Naiem, F. editor. The seismic design handbook, 2nd ed. Boston (MA): Kluwer Academic Publishers, p. 247–274.
- Dobry R, Borcherdt RD, Crouse CB, Idriss IM, Joyner WB, Martin GR, Power MS, Rinne EE, Seed RB. 2000. New site coefficients and site classification system used in recent building seismic code provisions. Earthquake Spectra. 16(1):41–67.
- Hinthong C. 1995. The study of active faults in Thailand. Proceedings of the Technical Conference on the Progression and Vision of Mineral Resources Development, Bangkok (Thailand): Department of Mineral Resources, p. 129–140.
- Holzer TL, Padovani AC, Bennett MJ, Noce TE, Tinsley IIJ. 2005. Mapping NEHRP VS30 site classes. Earthquake Spectra. 21(1):161–177.
- Imtiaz A, Barua A, Sakib M, Ansary MA. 2018. Seismic microzonation of Cox’s Bazar municipal area Bangladesh. Geotech Eng. 49(3):11–17.
- Joyner WB, Warrick RE, Fumal T. 1981. The effect of quaternary alluvium on strong motion in the Coyote Lake, California, Earthquake of 1979. Bull Seismol Soc Am. 71:1333–1349.
- Kanli AI, Tildy P, Pronay Z, Pinar A, Hemann L. 2006. Vs30 mapping and soil classification for seismic site effect evaluation in Dinar region, SW Turkey. Int J Geophys. 165(1):223–235.
- Kramer SL. 1996. Geotechnical earthquake engineering. Upper Saddle River (NJ): Prentice-Hall International Series in Civil Engineering and Engineering Mechanics, Prentice-Hall.
- Maheswari RU, Boominathan A, Dodagoudar GR. 2010. Seismic site classification and site period mapping of Chennai City using geophysical and geotechnical data. J Appl Geophys. 72(3):152–168.
- Midorikawa S. 1987. Prediction of seismal map in Kanto plain due to hypothetical earthquake. J Struct Dyn. 33:43–48.
- Nutalaya P, Sodsri S, Arnold EP. 1985. Southeast Asia Association of seismology and earthquake engineering. Series on seismology. Bangkok (Thailand).
- Pagliaroli A, Gaudiosi I, Razzano R, Giallini S, De Siva F, Chiaradonna A, Ciancimino A, Foti S. 2019. Site response analyses for seismic microzonation: Case-histories, results and applications in Central Italy. Proceedings of the International Conference on Earthquake Geotechnical Engineering for Protection and Development of Environment and Construction, Rome, Italy.
- Park CB, Miller RD, Xia J. 1999. Multi-channel analysis of surface waves. Geophysics. 64(3):800–808.
- Park S, Elrick S. 1998. Predictions of shear wave velocities in southern California using surface geology. Bull Seismol Soc Am. 88(3):677–685.
- Pattararattanakul P. 2003. Liquefaction resistance of sands in the Northern Part of Thailand [Dissertation]. Bangkok (Thailand): Chulalongkorn University.
- Sana H. 2018. Seismic microzonation of Srinagar city, Jammu and Kashmir. Soil Dyn Earthquake Eng. 115:578–588.
- Sheriff RE. 1991. Encyclopedic dictionary of exploration geophysics. 3rd ed. Tulsa (Oklahoma): Society of Exploration Geophysicists.
- Stewart JP, Liu AH, Choi Y. 2003. Amplification factors for spectral acceleration in tectonically active regions. B Seismol Soc Am. 93(1):332–352.
- Taechavaorainskun S, Nuntasarn R. 2005. Study of site amplification due to earthquakes in Bangkok and Chiang Rai provinces. Bangkok (Thailand): Faculty of Engineering, Chulalongkorn University.
- Tan CH, Majid TA, Ariffin KS, Bunnori NM. 2014. Seismic microzonation for Penang using geospatial contour mapping. Nat Hazards. 73(2):657–670.
- Thitimakorn T. 2013. Development of a NEHRP site classification map of Chiang Mai city, Thailand based on shear-wave velocity using the MASW technique. J Geophys Eng. 10(4):045007.
- Tinsley JC, Fumal TE. 1985. Mapping quaternary sedimentary deposits for areal variations in shaking response. In: Ziony, JI, editor. Evaluating earthquake hazards in the Los Angeles region – an earth science perspective, USGS Prof. Pap. 1360; p. 101–126. Washington: United States Government Printing Office.
- Wills CJ, Peterson M, Bryant WA, Reichle M, Saucedo GJ, Tan S, Taylor G, Treiman J. 2000. A site-conditions map for California based on geology and shear-wave velocity. Bull Seismol Soc Am. 90:187–S208.