
 ?Mathematical formulae have been encoded as MathML and are displayed in this HTML version using MathJax in order to improve their display. Uncheck the box to turn MathJax off. This feature requires Javascript. Click on a formula to zoom.
Abstract
Landslide susceptibility is an important topic mainly because its geo-spatial analysis provides a useful tool for planning, disaster management and hazard mitigation. In this study, the aim is to identify and analyze landslide susceptibility at a local spatial scale, which is represented by the town of Handlová, using the multi-criteria evaluation (i.e., the analytical hierarchy process technique – AHP) and geographic information systems (GIS). The following landslide conditioning factors were selected representing the local terrain predispositions: slope angle, geology, slope aspect, elevation, distance from rivers, distance from faults and land use. The raster-based analysis was performed using the spatial resolution of 10 × 10 m. The weights for each factor were determined by the AHP technique where slope angle had the highest relative importance. Based on the resulting susceptibility map, 51.98% out of the total study area is characterized by high and very high susceptibility class. The Atlas of Slope Stability of the Slovak Republic, which contains past landslides until 2006, was used for verification of the results. The verification confirmed a moderate accuracy between the landslide susceptibility map and landslide inventory from the atlas since 60.8% of all landslide areas from the atlas corresponded with high and very high susceptibility class.
1. Introduction
Landslides belong to the most distributed natural disasters in the world with the potential to cause loss of human lives as well as severely damage the infrastructure.
In Slovakia, landslide areas occupy about 4% of the total country area (Vlcko et al. Citation2009). In particular, landslides represent a constant hazard in the areas where buildings are located on slope deformations. The result of active slope deformations is a repeated damage to ground and underground structures, engineering networks or agricultural and forest land. Currently, the increased landslide risk can be seen in some regions of Slovakia due to the intensified direction of construction activity from flat and slightly inclined areas to sloping and more exposed areas. The reasons for such construction is mainly the lack of suitable construction parcels in flat lands as well as construction of buildings on slopes with attractive surrounding environment (Vlcko et al. Citation2009).
Therefore, a detailed mapping and analysis of areas which are prone to landslide occurrence is of great importance, especially, for the purposes of disaster management, spatial planning and related decision-making processes. To be more specific, the research oriented on landslide susceptibility mapping aims at identifying areas which are the most vulnerable to future landslides based on local physical conditions (predispositions) that determine the propensity for landslide activity (Fell et al. Citation2008).
Landslide, which can be defined as a downward movement of material on a slope (Westen et al. Citation2008), represents a complex process which is influenced by various conditioning factors. Based on the literature review, the most recurring factors include morphometric properties such as slope angle/aspect or elevation, hydrography factors such as river network density or distance from rivers, geology/lithology, soils, land use/land cover, distance from faults and the like (Westen et al. Citation2008).
Furthermore, the choice of landslide conditioning factors depends on the spatial scale for which the susceptibility analysis is performed. As for the local spatial scale studies (Zêzere et al. Citation2017), more accurate input data, in terms of map scale or spatial resolution, can be used for defining landslide predispositions as compared, for example, to the national spatial scale, where the input data for computing landslide susceptibility map are usually more generalized (Holec et al. Citation2013).
The development of geospatial technologies, i.e. geographic information systems (GIS), remote sensing (RS) and global navigation satellite systems (GNSS), have enabled researchers to map, analyze and synthetize different input data more effectively and produce landslide susceptibility maps which may support the decision makers in planning and mitigating the potential landslide impacts (Fell et al. Citation2008; Konečný and Reinhardt Citation2010; Konečný et al. Citation2010).
Regarding the landslide susceptibility mapping, various methods have been developed and adopted in different geographic regions as well as across different spatial scales, such as local (Kouli et al. Citation2010; Guillard and Zêzere Citation2012), regional (Komac Citation2006), national or global (Hong et al. Citation2007; Stanley and Kirschbaum Citation2017). Basically, they can be grouped into the following groups: qualitative (also referred to as subjective) and quantitative (also referred to as objective) (Guzzetti et al. Citation1999).
One of the approaches used for assessing landslide susceptibility is the multi-criteria decision analysis (MCDA) (Ahmed Citation2015). Generally, MCDA represents a weighted evaluation process which uses qualitative as well as quantitative parameters resulting in alternative solutions to a particular problem with the possibility to choose the best one (Saaty Citation1980). One of the most used techniques for defining weights is the analytical hierarchy process (AHP) (Kayastha et al. Citation2013; Feizizadeh et al. Citation2014; Kumar et al. Citation2018; Mallick et al. Citation2018; Bera et al. Citation2019). The AHP technique focuses on the pairwise comparisons which aim at finding the degree to which one alternative outranks the other alternatives based on the defined criteria (Saaty Citation1980). Some other MCDA techniques have been used in recent landslide susceptibility studies, for example, weight linear combination (Ayalew et al. Citation2004; Chen et al. Citation2017), ordered weighted average (Feizizadeh and Blaschke Citation2013) or analytical network process (Neaupane and Piantanakulchai Citation2006).
The group of the quantitative methods includes statistical methods such as frequency ratio or logistic regression (Lee and Pradhan Citation2007; Vakhshoori and Pourghasemi Citation2019), machine learning methods, e.g. random forest (Zhang et al. Citation2017), artificial neural networks (Dou et al. Citation2015) or support vector machines (Hong et al. Citation2015; Zhang et al. Citation2018). Many landslide susceptibility studies aimed at comparing these methods and finding the most suitable alternative (Abedini and Tulabi Citation2018). For example, comparison of artificial neural network, frequency ratio and bivariate logistic regression (Pradhan and Lee Citation2010), comparison between bivariate analysis and multivariate statistical methods (Wang et al. Citation2015), comparison of logistic regression, AHP and statistical index (Pourghasemi et al. Citation2013) or comparison of five methods including AHP, information value, fractal theory, back propagation neural network and support vector machine (Ge et al. Citation2018). Nevertheless, each of the mentioned methods and techniques has certain weaknesses in terms of landslide susceptibility mapping which usually results in various uncertainties.
The aim of this study is to define a methodology for identifying and assessing landslide susceptible areas at a local spatial scale based on the MCDA, particularly analytical hierarchy process, and GIS. The local spatial scale allows using more accurate input data in defining the landslide susceptibility zones. In this study, landslide susceptibility is understood as the predispositions of a certain area which are given by its physical configuration (excluding rainfall as a triggering factor) that determines its propensity to landslides (Jacinto et al. Citation2015). The aggregation method was applied in order to combine the weighted factors into the final landslide susceptibility map. Furthermore, the resulting landslide susceptibility map was verified based on the Atlas of Slope Stability of the Slovak Republic (Šimeková et al. Citation2006) which contains past landslide occurrences until the year 2006.
2. Study area
The study area, represented by the town of Handlová, has a total size of 85.7 km2 and it includes two local parts called Morovno and Nová Lehota. As for the administrative division, the town of Handlová is located in the following administrative units: Western Slovakia (NUTS II), Trenčín Region (NUTS III) and Prievidza District (NUTS IV).
The study area is included in the following geomorphologic units (Mazúr and Lukniš Citation1986): Kremnické vrchy (mountain), Žiar (mountain), Hornonitrianska kotlina (basin) and Vtáčnik (mountain). The highest point (Jarabá skala peak: 1168 m) is located in the southern part of the town. The lowest point (366 m) is located in the place where the Handlovka River leaves the boundary of the town.
Average annual rainfall ranges from 600 to 700 mm/year. The Handlovka River drains most of the waters from the study area. The left-sided tributaries of the Handlovka River are, for example, Račí potok stream or Morovniansky potok stream. The right-sided tributaries are represented, for example, by the Mlynský potok stream, Struhár stream and Hraničný potok stream ().
Figure 1. Study area – the town of Handlová. Source: SVM50 – Spojitá vektorová mapa 1:50,000, Rights holder: Geodetic and Cartographic Institute, Bratislava.
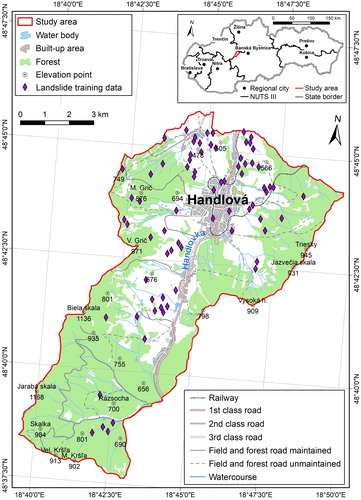
Landslides represent a serious problem in the whole study area (Vojteková and Vojtek Citation2019). The most damaging landslides include the Handlová landslide, Morovno landslide and Kunešovská Street landslide.
Kunešovská Street landslide is located in south-eastern edge of the town´s built-up area. In 1961, 1966, 1969 and 1992, this landslide area was activated endangering family houses, engineering networks, local roads as well as railway. Based on the results of geological surveys in 1998 and 1999, the proposal for restoration of the area was elaborated and subsequently implemented in 1999. The restoration was focused on the creation of an efficient drainage system and drainage of the bedrock by sub-horizontal descents. Furthermore, a network of facilities was built to enable its monitoring (Wagner et al. Citation2008; Vojteková et al. Citation2018).
Morovno landslide is located in the north-western part of the town´s boundary. Between 1974 and 1977, the Morovno housing estate was the first housing estate in Slovakia which was constructed on slope deformations. The construction itself was conditioned by the long-term slope drainage with permanent maintenance of drainage facilities. Moreover, the control monitoring descents were realized in order to ensure the stability of residential buildings and railway as well as a set of monitoring piezometers for observing changes in the groundwater level was built (Vojteková et al. Citation2018; Nemčok Citation1982).
Handlová landslide from 1961 hit the south-eastern part of the town. It belongs to the largest landslides in Slovakia which destroyed the local infrastructure, electric lines and roads. The total length of the main current was 1.8 km (mass of about 14.5 million m3). However, the current at the eastern edge of the main landslide (mass of about 5.7 million m3) started to move approximately 14 days later reaching the length of 1 km (Nemčok Citation1982). A set of restoration works was carried out focusing mainly on slope drainage and building a network of monitoring facilities. Moreover, the stabilization embankment was built in 1980 while the mullock from the underground coal mine began to be deposited in 1983. Moreover, some other activities of this landslide were recorded in 1967, 1970, 1977, 1992, 2008, 2009 or 2010 (Wagner et al. Citation2008; Vojteková et al. Citation2018).
3. Data and methods
3.1. Landslide conditioning factors
The original input data for the creation of maps of conditioning factors were collected from different sources (see ) and subsequently processed and analyzed in GIS.
Table 1. Input data for processing of landslide conditioning factors and their sources.
Based on similar studies (Nicu Citation2018; Skilodimou et al. Citation2019) and relevance to landslide susceptibility, seven conditioning factors were selected representing mainly the primary local terrain conditions. shows the slope angle, slope aspect and elevation maps. The maps of distance from rivers and distance from faults are shown in . Geology and land use maps are shown in . Furthermore, the classes of individual conditioning factors are reported in .
Figure 2. Landslide conditioning factors: (a) elevation, (b) slope angle and (c) slope aspect. Source: Basic map of the Slovak Republic 1:10,000, Rights holder: Geodetic and Cartographic Institute, Bratislava
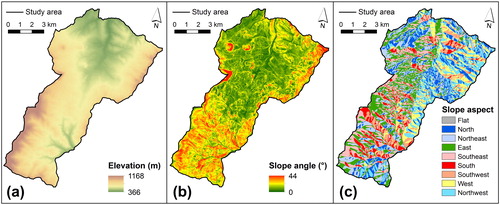
Figure 3. Landslide conditioning factors: (a) distance from rivers and (b) distance from faults. Source: Basic map of the Slovak Republic 1:10,000, Rights holder: Geodetic and Cartographic Institute, Bratislava

Figure 4. Landslide conditioning factors: (a) geology and (b) land use. (a) Source: Geological map 1:50,000, Rights holder: State Geological Institute of Dionýz Štúr, Bratislava, (b) Source: Orthophotos 2018 (WMS Service), Rights holder: Geodetic and Cartographic Institute, Bratislava; National Forest Centre, Zvolen
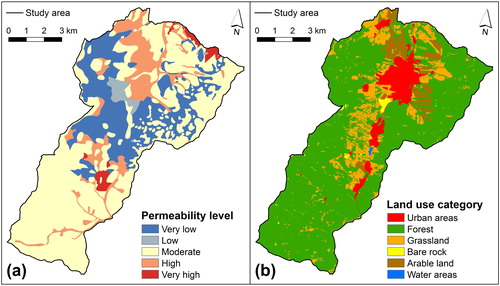
Table 2. Classes of landslide conditioning factors, ratings and relative importance.
Since the computation of landslide susceptibility map is raster-based, all vector conditioning factors (e.g. geology or land use) were converted to rasters with pixel size of 10 × 10 m. Moreover, the classes of conditioning factors were standardized to a uniform rating scale from 1 to 5 which reflects the following susceptibility to landslides (): 5 – very high, 4 – high, 3 – moderate, 2 – low and 1 – very low.
Geology is an important landslide conditioning factor mainly because of rock permeability which is different for different rock types. The vector format of the geological map of the study area at a scale of 1:50,000 was used for classifying the groups of rock types according to their permeability, as defined by Hrnčiarová (Citation1993). The groups of rock types and their corresponding permeability level is shown in .
Table 3. Groups of rock types and their corresponding permeability level.
Elevation factor affects the landslide susceptibility in the way that higher elevations are generally more susceptible to landslides. The primary input data for the creation of a digital elevation model (DEM) were contour lines and elevation points, which were digitized from the topographic map at a scale of 1:10,000, and the interpolation method for creating hydrologically correct DEMs was used, as described by Hutchinson (Citation1988). The hypsometric intervals were reclassified to five classes.
Generally speaking, steeper slopes are more susceptible to landslide occurrence. The slope angle map was created based on the DEM using the ArcGIS tools. Moreover, the slopes were reclassified into five classes using the work of Demek (Citation1972).
Slope aspect is also an important parameter for landslide susceptibility mapping. Generally, the slope aspect map refers to the direction to which a slope faces. In this respect, nine direction classes were used.
Distance from rivers is another conditioning factor which was used. The distance from rivers was calculated in ArcGIS software using the Euclidean distance tool. The vector layer of a river network at a scale of 1:10,000 was used for the computation.
Furthermore, distance from faults was used as another conditioning factor. Faults were digitized based on the geological map 1:50,000 and subsequently classified in ArcGIS software with the use of Euclidean distance tool.
In the study, land use was identified using the orthophotos from 2018 with the pixel size 25 cm/pixel. Altogether six land use categories were interpreted, manually digitized and reclassified based on their potential contributions to landslide susceptibility.
3.2. Multi-criteria analysis – analytical hierarchy process
The first step was to define the relative importance for the chosen conditioning factors for which the empirical knowledge and findings of recent studies (Kumar et al. Citation2018; Nicu Citation2018; Bera et al. Citation2019; Skilodimou et al. Citation2019) were used. The relative importance of the selected factors ranges from 7 (highest importance) to 1 (lowest importance), as shown in . In the AHP technique, the weights for each factor were determined by using the principal eigenvector of a 7 × 7 square reciprocal matrix of pairwise comparison () between the factors, which reflects the relative significance of one factor compared to the others (Saaty Citation1980). Furthermore, ratings of factors were estimated by expert judgement and the literature review using the nine-point continuous scale, as suggested by Saaty (Citation1980). The normalized pairwise comparison matrix and final weights (wi) are reported in .
Table 4. Pair-wise comparison matrix.
Table 5. Normalized factor weights and final weights (wi).
In order to avoid possible inconsistencies in the judgment matrix, the degree of consistency, which was used in developing the ratings, is needed to be calculated. For this purpose, the consistency ratio (CR), as suggested by Saaty (Citation1980), was calculated using EquationEquation (1)(1)
(1) :
(1)
(1)
where CR = consistency ratio, CI = consistency index and RI = random index which value depends on the number of factors used in the pairwise matrix (Saaty Citation1980). For calculating the consistency index (CI), the following EquationEquation (2)
(2)
(2) was used:
(2)
(2)
where n = number of factors and λ = average value of the consistency vector. According to Saaty (Citation1980), if the value of CR is not greater than 0.1, the weighting coefficients were suitable. In this case, the resulting value of CR is 0.02 which fulfils the mentioned condition and the developed ratings are consistent and the weights are appropriate for further susceptibility analysis.
Finally, the aggregation method (i.e. weighted sum) was used to multiply the reclassified factor maps by their corresponding weights and their summation produced the final landslide susceptibility map (EquationEquation (3)(3)
(3) ):
(3)
(3)
where LS = landslide susceptibility, wi = weight of factor i and xi = classes of landslide susceptibility for each factor i.
The calibration of the model (i.e. factor weights) was based on the comparison of different weighting results with 74 point locations of smaller landslide occurrences (see ) in the study area, which were digitized using the Atlas of Slope Stability of the Slovak Republic (Šimeková et al. Citation2006). Different alternatives of factor weights were tested to find the best correspondence with these training data.
4. Results
The resulting map of landslide susceptibility was developed using the weighted sum of the seven conditioning factors (). To classify the resulting landslide susceptibility map in ArcGIS software, the natural breaks (Jenks) grading method was selected. Moreover, an area coverage of the computed landslide susceptibility classes and their shares on total area are shown in .
Figure 5. Landslide susceptibility zones (a) and landslide areas from the atlas (Šimeková et al. Citation2006) used for validation (b). (b) Source: Šimeková et al. (2006)
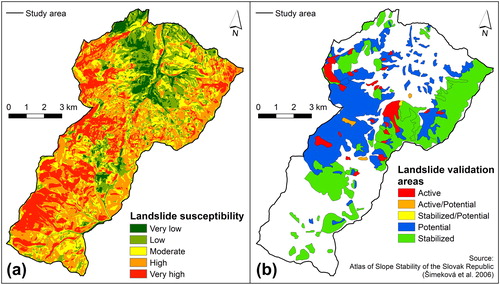
Table 6. Area coverage of landslide susceptibility zones and their share on all landslide areas from the atlas.
Based on , the very low landslide susceptibility class recorded the lowest share (6.82%) on the total area followed by the low landslide susceptibility class which share is 18.10%. As for the moderate landslide susceptibility class, its share (23.10%) is higher than the previous classes, however, the highest share (31.39%) was recorded by the high landslide susceptibility class. Moreover, the share of very high landslide susceptibility class is 20.59%. Altogether, 51.98% of the study area falls within the high and very high landslide susceptibility class.
This finding corresponds with the share of all landslide areas on the total area (49.6% or 42.48 km2), which are shown in the Atlas of Slope Stability of the Slovak Republic (Šimeková et al. Citation2006). In this atlas, the landslides are divided into the following types: active, active/potential, potential, stabilized and stabilized/potential, as shown in and .
Table 7. Share of landslide susceptibility zones on different types of landslide areas from the atlas.
Based on , the results point to a moderate accuracy (Choubin et al. Citation2019) between the computed landslide susceptibility map and all types of landslide areas from the atlas since 60.8% of all landslide areas is coincident with high and very high susceptibility class. Furthermore, 21.5% of all landslide areas corresponds with the moderate landslide susceptibility while the low landslide susceptibility class is represented by 14.0% of all landslide areas. Finally, only 3.7% of all landslide areas corresponds with the very low landslide susceptibility class.
As for the share of individual types of landslide areas defined by the atlas (), some differences can be seen in comparison with the share of landslide susceptibility classes on all landslides areas (). The active landslides cover 2.98 km2, which is 7.0% of the total landslide area. Only 2.7% of active landslides correspond with the very low landslide susceptibility class while the share of low susceptibility class on the active landslides is 12.6%. The moderate landslide susceptibility class corresponds with the active landslides on 26.3% of their area. As for the high and very high susceptibility classes, their share on the active landslide areas is 37.5% and 20.9% respectively.
The active/potential landslides, which were mapped in the atlas, cover 0.28 km2, which is only 0.7% of the total landslide area. The very low susceptibility class corresponds with 4.3% of active/potential landslides, low susceptibility class is coincident with 6.6% of active/potential landslides and in case of moderate landslide susceptibility class, it is 5.1%. On the other hand, 84% of active/potential landslides correspond with the high and very high landslide susceptibility classes (29.2% – high susceptibility; 54.8% – very high susceptibility).
The least share of mapped landslides in the atlas is represented by the stabilized/potential landslides (0.1% of the total landslide area). The very low susceptibility class is represented by 2.1% of stabilized/potential landslides, low susceptibility class corresponds with 40.0% of stabilized/potential landslides and moderate landslide susceptibility class is represented by 37.9% of stabilized/potential landslides. The high susceptibility class corresponds with 19.9% of stabilized/potential landslides while no stabilized/potential landslide was recorded in the very high susceptibility class.
Regarding potential landslides, their area coverage is 19.12 km2, which is 45% of the total landslide area. Only 4.0% of potential landslides correspond with the very low landslide susceptibility class. This class is followed by the low susceptibility class, which share on the potential landslides is 15.1%. The moderate landslide susceptibility class corresponds with the potential landslides on 20.2% of their area. As for the high and very high susceptibility classes, their share on the potential landslide areas is 34.2% and 26.5% respectively. When the sum of these two susceptibility classes (60.7%) is compared with the same classes for all landslides areas from the atlas (60.8%) (), their difference is only 0.1%.
In case of stabilized landslides, the situation is similar to the potential landslides. The stabilized landslides cover 20.05 km2, which is 47.2% of the total landslide area. The very low susceptibility class is represented by 3.2% of stabilized landslides, low susceptibility class corresponds with 12.3% of stabilized landslides and moderate landslide susceptibility class is represented by 23.6% of stabilized landslides. The high susceptibility class is coincident with 39.3% of stabilized landslides while 21.6% of stabilized landslides was recorded in the very high susceptibility class. The difference in the sum of these two classes between the stabilized landslides (60.9%) and all landslides areas from the atlas (60.8%) is again only 0.1%.
Overall, when comparing the resulting map of landslide susceptibility () and landslide validation map (), it can be seen that the main difference is in the south and south-west part of the study area. Based on the past landslides from the atlas, only very few landslides or no landslides occurred in these parts of the study area. However, the resulting landslide susceptibility map shows mostly high and very high susceptibility for these areas, which is mainly caused by higher elevations and slope angles. On the other hand, these areas are covered predominantly by forests as well as the level of lithological permeability is mostly moderate, which probably lower the real risk of landslide occurrence.
5. Discussion
In case of multi-criteria landslide susceptibility assessment, there are different sources of uncertainty which need to be discussed. It is generally valid that the quality of landslide susceptibility models depends mainly on the relevance, quality and reliability of the selected conditioning factors and their input data as well as on the method (model) used (Zêzere et al. Citation2017).
First of all, the selection of conditioning factors and their relevance are of crucial importance for the correct outcome of multi-criteria susceptibility analysis and, at the same time, can be considered a limitation of each landslide susceptibility work. In this sense, the number of conditioning factors varies while usually more than six factors are used, as evidenced by many previous studies mentioned also in Section 1. Generally speaking, if less than five conditioning factors is used, then the analysis may be dominated by a single weight which means over-rating of some of the contributing factors used.
As evidenced by similar previous studies (see Section 1), some other factors could have been used for the landslide susceptibility analysis. However, the intention of this study was to focus mainly on primary physical (terrain) predispositions (factors) (Zêzere et al. Citation2017), such as elevation or slope angle. The other terrain factors, such as stream power index (SPI), topographic wetness index (TWI), topographic position index (TPI), topographic roughness index (TRI) or erosion factor of sediment transport index (STI), are considered secondary derivates of elevation and slope angle. As for excluding the rainfall factor from the analysis, we adhere to the concept of the term “susceptibility” as presented in the work of Jacinto et al. (Citation2015) who state that “susceptibility is a characteristic of an area given by its natural terrain configuration and occupation and that determines its propensity to flooding” (in our case landslide occurrence), which is the “propensity associated with terrain characteristics and excludes flow or precipitation quantitative information.” Based on this definition, we adhere to the fact that rainfall triggers a landslide while terrain factors, geology, land use and the like are preliminary factors conveying the predispositions of an area for landslide occurrence, for example, after local heavy rainfall. In addition, using the rainfall map which is represented, for example, by mean annual precipitation total (mm) would cause that this map would be too much generalized and schematic for the study area. As a result, we think that such a generalized map is not suitable for local spatial scale susceptibility mapping.
Furthermore, the choice of conditioning factors is also caused by the availability of input data. In this sense, for example, the normalized difference vegetation index (NDVI) factor could not be derived since the orthophotos used were only available in the form of web map service (WMS) and not as individual files. On the other hand, the selection of conditioning factors depends on the spatial scale for which the landslide susceptibility analysis is intended to be performed. This study is focused on the local spatial scale which allowed using more accurate input data in terms of the original map scale, i.e. topographic map 1:10,000 for DEM creation and geological map 1:50,000 or high-resolution (25 cm/pixel) orthophotos for digitization of land use categories. This fact was also confirmed in other studies such as Zêzere et al. (Citation2017), Kouli et al. (Citation2010), or Kumar et al. (Citation2018). Increasing the spatial scale usually means generalization of the input data which are used for preparing the maps of conditioning factors thus affecting the quality of the landslide susceptibility model.
In terms of the MCDA, another source of uncertainty arises from assigning the relative importance for the chosen conditioning factors. In this case, slope angle was the most important conditioning factor while the importance of the other conditioning factors decreases. Similarly, the slope angle was prioritized in other recent studies, for example, Kumar et al. (Citation2018), Nicu (Citation2018), Bera et al. (Citation2019), or Skilodimou et al. (Citation2019) which confirm that slope is the most influencing parameter in terms of physical predispositions of an area to landslides. Moreover, geology, elevation, distance from rivers, land use or distance from faults can be considered another standard conditioning factors since they recur in most of the landslide susceptibility studies, which are also mentioned in Section 1.
The uncertainty in assigning the relative importance for the conditioning factors can be overcome, to a certain extent, by the calibration of the model. This can be done, for example, by alternating different combinations of factor weights in order to find the best coincidence with the available training landslide data. Furthermore, the validation of the results is an important step in landslide susceptibility studies since it provides useful information on the effectiveness of the model based on its comparison with testing landslide inventory for the study area. In this study, however, the verification (accuracy) of the landslide susceptibility map confirmed the effectiveness and suitability of the methodology adopted only partly.
On the other hand, the general applicability of multi-criteria-based methodologies (particularly the AHP technique) has been proved in a number of landslide studies, for example, Ayalew et al. (Citation2004), Kouli et al. (Citation2010), Kayastha et al. (Citation2013), Feizizadeh et al. (Citation2014), Ahmed (Citation2015), Chen et al. (Citation2017), Kumar et al. (Citation2018), Mallick et al. (Citation2018), Nicu (Citation2018), Bera et al. (Citation2019), but also in studies which focused on other types of natural hazards (Skilodimou et al. Citation2019; Santos et al. Citation2019; Costache et al. Citation2020). In addition, application of MCDA across different spatial scales (from local to global) is also appropriate, as evidenced by these studies.
6. Conclusions
In this study, the aim was to determine the landslide susceptibility at a local spatial scale, which was represented by the town of Handlová. The methodology applied was based on the multi-criteria evaluation – the AHP technique which was performed with the support of GIS. Altogether, seven landslide conditioning factors (slope angle, geology, slope aspect, elevation, distance from rivers, distance from faults, land use), representing the local terrain conditions, were selected for the computation of landslide susceptibility map. The chosen conditioning factors were processed as rasters with the pixel size of 10 × 10 m and their classes standardized to a uniform rating scale from 1 to 5 reflecting the susceptibility to landslides from 5 – very high to 1 – very low.
The slope angle had the highest relative importance among the selected conditioning factors followed by geology, slope aspect, elevation, distance from rivers, distance from faults and land use in this order. The weights for each factor were determined by the pairwise comparison technique reflecting the relative significance of one factor over the others. Moreover, the ratings of factors were estimated by expert judgement and the literature review using the Saatýs (1980) nine-point continuous scale. Eventually, the aggregation method (i.e. weighted sum in GIS) was used to compute the final landslide susceptibility map which was classified into the following classes: very low, low, moderate, high and very high susceptibility.
Based on the computed landslide susceptibility map, 51.98% of the total study area falls within the high and very high landslide susceptibility class. In order to validate the resulting landslide susceptibility map, the Atlas of Slope Stability of the Slovak Republic (Šimeková et al. Citation2006), containing a database of past landslides until the year 2006, was used. The validation confirmed a moderate accuracy (Choubin et al. Citation2019) between the computed landslide susceptibility map and landslide areas from the atlas since 60.8% of the landslide areas corresponded with high and very high landslide susceptibility class. Based on this fact, the future research will be directed towards improving the accuracy of the model performance by employing more advanced data-driven methods or their combination with multi-criteria techniques.
Disclosure statement
No potential conflict of interest was reported by the authors.
Additional information
Funding
References
- Abedini M, Tulabi S. 2018. Assessing LNRF, FR, and AHP models in landslide susceptibility mapping index: a comparative study of Nojian watershed in Lorestan province. Iran Environ Earth Sci. 77:405.
- Ahmed B. 2015. Landslide susceptibility mapping using multi-criteria evaluation techniques in Chittagong Metropolitan Area, Bangladesh. Landslides. 12(6):1077–1095.
- Ayalew L, Yamagishi H, Ugawa N. 2004. Landslide susceptibility mapping using GIS-based weighted linear combination, the case in Tsugawa area of Agano River, Niigata Prefecture, Japan. Landslides. 1(1):73–81.
- Bera A, Mukhopadhyay BP, Das D. 2019. Landslide hazard zonation mapping using multi-criteria analysis with the help of GIS techniques: a case study from Eastern Himalayas, Namchi, South Sikkim. Nat Hazards. 96(2):935–959. 10.1007/s11069-019-03580-w.
- Chen W, Han H, Huang B, Huang Q, Fu X. 2017. Variable-Weighted Linear Combination Model for Landslide Susceptibility Mapping: Case Study in the Shennongjia Forestry District, China. ISPRS Int J Geo-Inf. 6(11):347.
- Choubin B, Rahmati O, Tahmasebipour N, Feizizadeh B, Pourghasemi HR. 2019. Application of Fuzzy Analytical Network Process Model for Analyzing the Gully Erosion Susceptibility. In: Pourghasemi HR, Rossi, M, editors. Natural hazards GIS-based spatial modeling using data mining techniques. Berlin: Springer; p. 105–125.
- Costache R, Pham QB, Sharifi E, Linh NTT, Abba SI, Vojtek M, Vojteková J, Nhi PTT, Khoi DN. 2020. Flash-Flood Susceptibility Assessment Using Multi-Criteria Decision Making and Machine Learning Supported by Remote Sensing and GIS Techniques. Remote Sens. 12(1):106.
- Demek J. 1972. Manual of detailed geomorphological mapping. Prague, Czechia: Academia.
- Dou J, Yamagishi H, Pourghasemi HR, Yunus AP, Song X, Xu Y, Zhu Z. 2015. An integrated artificial neural network model for the landslide susceptibility assessment of Osado Island, Japan. Nat Hazards. 78(3):1749–1776.
- Feizizadeh B, Blaschke T. 2013. GIS-multicriteria decision analysis for landslide susceptibility mapping: comparing three methods for the Urmia lake basin, Iran. Nat Hazards. 65(3):2105–2128.
- Feizizadeh B, Roodposhti MS, Jankowski P, Blaschke T. 2014. A GIS-based extended fuzzy multi-criteria evaluation for landslide susceptibility mapping. Comput Geosci. 73:208–221.
- Fell R, Corominas J, Bonnard C, Cascini L, Leroi E, Savage WZ. 2008. Guidelines for landslide susceptibility, hazard and risk zoning for land use planning. Eng Geol. 102(3-4):85–98.
- Ge Y, Chen H, Zhao B, Tang H, Lin Z, Xie Z, Lv L, Zhong P. 2018. A comparison of five methods in landslide susceptibility assessment: a case study from the 330-kV transmission line in Gansu Region, China. Environ Earth Sci. 77:662.
- Guillard C, Zêzere JL. 2012. Landslide susceptibility assessment and validation in the framework of municipal planning in Portugal: the case of Loures municipality. Environ Manag. 50(4):721–735.
- Guzzetti F, Carrara A, Cardinali M, Reichenbach P. 1999. Landslide hazard evaluation: a review of current techniques and their application in a multi-scale study, Central Italy. Geomorphology. 31(1-4):181–216.
- Holec J, Bednarik M, Šabo M, Minár J, Yilmaz I, Marschalko M. 2013. A small-scale landslide susceptibility assessment for the territory of Western Carpathians. Nat Hazards. 69(1):1081–1107.
- Hong H, Pradhan B, Xu C, Bui DT. 2015. Spatial prediction of landslide hazard at the Yihuang area (China) using two-class kernel logistic regression, alternating decision tree and support vector machines. Catena. 133:266–281.
- Hong Y, Adler R, Huffman G. 2007. Use of satellite remote sensing data in the mapping of global landslide susceptibility. Nat Hazards. 43(2):245–256.
- Hrnčiarová T. 1993. Assessing the potential vulnerability of groundwater resources for ecological landscape planning. Životné prostr. 27:311–314. (In Slovak)
- Hutchinson MF. 1988. Calculation of hydrologically sound digital elevation models. In Proceedings of the Third International Symposium on Spatial Data Handling, Sydney, Australia, p. 17–19. August 1988; International Geographical Union: Sydney, Australia,
- Jacinto R, Grosso N, Reis E, Dias L, Santos FD, Garrett P. 2015. Continental Portuguese Territory Flood Susceptibility Index—Contribution to a vulnerability index. Nat Hazards Earth Syst Sci. 15(8):1907–1919.
- Kayastha P, Dhital MR, De Smedt F. 2013. Application of the analytical hierarchy process (AHP) for landslide susceptibility mapping: A case study from the Tinau watershed, west Nepal. Comput Geosci. 52:398–408.
- Komac M. 2006. A landslide susceptibility model using the analytical hierarchy process method and multivariate statistics in perialpine Slovenia. Geomorphology. 74(1-4):17–28.
- Konečný M, Reinhardt W. 2010. Early warning and disaster management: the importance of geographic information (Part A). Int J Digit Earth. 3(4):313–315.
- Konečný M, Zlatanova S, Bandrova T. 2010. Geographic Information and Cartography for Risk and Crisis Management. In: Towards better solutions, Berlin, Germany: Springer-Verlag.
- Kouli M, Loupasakis C, Soupios P, Vallianatos F. 2010. Landslide hazard zonation in high risk areas of Rethymno Prefecture, Crete Island, Greece. Nat Hazards. 52(3):599–621.
- Kumar A, Sharma RK, Bansal VK. 2018. Landslide hazard zonation using analytical hierarchy process along National Highway-3 in mid Himalayas of Himachal Pradesh. India Environ Earth Sci. 77:719.
- Lee S, Pradhan B. 2007. Landslide hazard mapping at Selangor, Malaysia using frequency ratio and logistic regression models. Landslides. 4(1):33–41.
- Mallick J, Singh RK, AlAwadh MA, Islam S, Khan RA, Qureshi MN. 2018. GIS-based landslide susceptibility evaluation using fuzzy-AHP multi-criteria decision-making techniques in the Abha Watershed, Saudi Arabia. Environ Earth Sci. 77:276.
- Mazúr E, Lukniš M. 1986. Geomorphological division of SSR and ČSSR. Slovakian part, Slovenská kartografia, Bratislava, Slovakia: SUGK. (In Slovak)
- Neaupane KM, Piantanakulchai M. 2006. Analytic network process model for landslide hazard zonation. Eng Geol. 85(3-4):281–294.
- Nemčok A. 1982. Landslides in the Slovak Carpathians. Bratislava, Slovakia: Veda. (In Slovak)
- Nicu IC. 2018. Application of analytic hierarchy process, frequency ratio, and statistical index to landslide susceptibility: an approach to endangered cultural heritage. Environ Earth Sci. 77:79.
- Pourghasemi HR, Moradi HR, Aghda SF. 2013. Landslide susceptibility mapping by binary logistic regression, analytical hierarchy process, and statistical index models and assessment of their performances. Nat Hazards. 69(1):749–779.
- Pradhan B, Lee S. 2010. Landslide susceptibility assessment and factor effect analysis: backpropagation artificial neural networks and comparison with frequency ratio and bivariate logistic regression modelling. Environ Model Softw. 25(6):747–759.
- Saaty TL. 1980. The analytic hierarchy process. New York (NY): Mc Graw Hill Company.
- Santos PP, Reis E, Pereira S, Santos M. 2019. A flood susceptibility model at the national scale based on multicriteria analysis. Sci Total Environ. 667:325–337.
- Šimeková J, Martinčeková T, Abrahám P, Gejdoš T, Grencíková A, Grman D, Hrašna M, Jadroň D, Záthurecký A, Kotrčková E, et al. 2006. Atlas of slope stability maps of the Slovak Republic 1:50,000, Ingeo s.r.o.: Žilina, Slovakia.
- Skilodimou HD, Bathrellos GD, Chousianitis K, Youssef AM, Pradhan B. 2019. Multi-hazard assessment modeling via multi-criteria analysis and GIS: a case study. Environ Earth Sci. 77:47.
- Stanley T, Kirschbaum DB. 2017. A heuristic approach to global landslide susceptibility mapping. Nat Hazards. 87(1):145–164.
- Vakhshoori V, Pourghasemi HR. 2019. A novel hybrid bivariate statistical method entitled FROC for landslide susceptibility assessment. Environ Earth Sci. 77:686.
- Vlcko J, Wagner P, Ondrasik R, Jansky L. 2009. Landslide Hazard Strategies in Slovakia. In: Sassa K, Canuti P, editors. Landslides – disaster risk reduction. 1st ed. Berlin, Germany: Springer-Verlag; p. 490–492.
- Vojteková J, Vojtek M, Boltižiar M. 2018. Impact of Mining Activities and Natural Hazards on Land Use: A Case Study from Slovakia. In SGEM 2018, Proceedings of the 5th International Multidisciplinary Scientific Conference on Social Sciences and Arts, Albena, Bulgaria, 24 August-2 September 2018; STEF92 Technology Ltd.: Sofia, Bulgaria, p. 423–430.
- Vojteková J, Vojtek M. 2019. GIS-based landscape stability analysis: a comparison of overlay method and fuzzy model for the case study in Slovakia. Prof Geog. 71(4):631–644.
- Wagner P, Ondrejka P, Iglárová Ľ, Petro Ľ, Liščák P, Jelínek R. 2008. Landslides and other slope deformations. Available online: http://dionysos.gssr.sk/cmsgf/files/Hodn_monitor_2008/01_Zosuvy_2008/01_Zosuvy_2008.pdf (accessed on 2 April 2019). (In Slovak)
- Wang L, Guo M, Sawada K, Lin J, Zhang J. 2015. Landslide susceptibility mapping in Mizunami city, Japan: a comparison between logistic regression, bivariate statistical analysis and multivariate adaptive regression spline models. Geomorphology. 135:271–282.
- Westen CJ, Castellanos E, Kuriakose SL. 2008. Spatial data for landslide susceptibility, hazard, and vulnerability assessment: an overview. Eng Geol. 102:112–131.
- Zêzere JL, Pereira S, Melo R, Oliveira SC, Garcia RAC. 2017. Mapping landslide susceptibility using data-driven methods. Sci Total Environ. 589:250–267.
- Zhang K, Wu X, Niu R, Yang K, Zhao L. 2017. The assessment of landslide susceptibility mapping using random forest and decision tree methods in the three Gorges reservoir area, China. Environ Earth Sci. 76:405.
- Zhang T, Han L, Chen W, Shahabi H. 2018. Hybrid Integration Approach of Entropy with Logistic Regression and Support Vector Machine for Landslide Susceptibility Modeling. Entropy. 20(11):884.