
Planet Earth is a dynamic body, which is home to 7.8 billion people, and strong interactions exist between the human population and the Earth’s different components (land, ocean, biosphere, cryosphere and atmosphere). The impacts of such interactions are observed from the day-to-day changes in weather, solar radiation, cloudy conditions, poor visibility, rainfall and frequency of natural hazards around the globe. The dynamic nature of the Earth is evident at the ocean coast through the ocean waves, the nature of these waves varies from day-to-day and also morning to evening. For example, the heights of waves can now be predicted through ocean modelling studies, which requires input from ground and satellite data. The Earth’s components, the lithosphere, hydrosphere, cryosphere and biosphere, interact closely with the human population (). As a result, changes may not be visualized on a day-to-day basis; however, short- and long-term changes can be observed by using various Earth-observation systems. Over the years, the Earth has become more complex, due to strong interactions between the various components of the Earth’s systems and the influence of population living and interacting closely. Such interactions lead to degradation of the environment and to the depletion of resources, raise question of sustainability and pose a threat for our survival on Earth. This calls for the attention of all section of scientists to understand interaction, which is a challenging job in this complex system of systems. This also calls the attention of everyone on this Earth planet.
Figure 1. Interaction of population with lithosphere, biosphere, hydrosphere and atmosphere. Understanding of this interaction is important to make the Earth, its environment and resources sustainable.
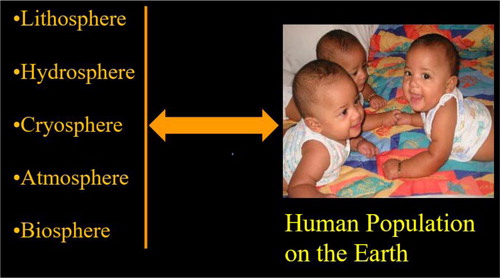
The population is increasing, and the projection is that in the next three decades, the carrying capacity of the Earth will become saturated. We all learn how to take care of our babies, how to monitor their growth. We learn ‘remote sensing’ using ‘cameras’, to take daily, weekly, monthly and yearly photos and compare the changes of the baby. Similarly, scientists, use observations at different platforms to monitor various components of the Earth at spatial and temporal scales. Over the last three decades, different types of observing systems have been placed on the land and ocean around the globe; multi-sensor satellites orbit the globe. The observing systems provide real-time data, which are being used to forecast extreme weather events, cyclones/typhoons/hurricanes and other kinds of natural disaster that help to provide an alert to people who will be affected by an event. In the year 1900, the Galveston hurricane took lives of 10,000 people because there was no observing system (Singh, 2017). Now, the use of real-time data from observing system allow for people are evacuated, and lives are saved. Every year, many parts of the world suffer with extreme precipitation causing floods. People in the affected areas are trapped for few weeks and suffer with hunger and poor sanitation which is a threat to human health. Satellite and ground observations provide early information to displace people at safe places (De Grove Citation2010; Franci et al. Citation2015).
Scientists have deployed global positioning systems (GPS) on land to monitor the Earth’s motion in vulnerable areas in the world. A dense network of GPS has been deployed in most of the seismically vulnerable areas-the western parts of California (USA) and almost the whole of Japan, which are seismically very active regions-to monitor the stress levels of the Earth to understand the mechanisms and processes behind earthquakes. The stress measurements from GPS, combined with many ground parameters, are useful to understand the crustal motion to estimate the change in stress at local and regional scale in seismically active regions. A dense network of automatic weather stations exists on the land globally which are being used to monitor meteorological parameters and to forecast weather. This information is valuable and needed at different elevations and different flight routes by the civil aviation sector for the smooth operation of flights. Meteorological parameters from a dense network are needed to forecast weather and to understand future scenarios about climate change at local, regional and global scales. In recent decades, many developing and developed countries have either launched or are in the process of launching satellites to monitor and map resources of their own countries. Over the last two decades, satellites have provided data on many parameters of our land, ocean, biosphere, cryosphere and atmosphere, and are widely used to study both short- and long-term changes. This information is valuable in getting early information about some of natural hazards. Satellite data also provide information about the atmospheric and meteorological parameters at different heights (at different pressure levels). These parameters provide an additional dimension to study the influence of meteorological parameters on land, ocean and atmosphere. Changes in the Earth, ocean, biosphere, cryosphere and atmosphere are associated with different kinds of natural hazards, associated with ocean, land and atmosphere. Some of these natural hazards associated with short-term changes in weather conditions, climate change (long-term changes) and global warming. Following natural hazards are associated with land, ocean, biosphere, snow/glaciers and atmosphere.
Land: earthquakes, volcanoes, landslides, floods and flash floods, extreme temperature, snow avalanches, pandemic, subsidence, desertification and forest fires.
Ocean: tsunami, volcano, landslides, oil spills, hurricanes/cyclones/typhoons, sea-level rise and ocean blooms.
Atmosphere: Dust storms, thunderstorm, hurricanes/cyclones/typhoons, extreme precipitations and tornadoes.
Optical and microwave satellite sensors help to monitor land, ocean, biosphere, cryosphere and atmospheric parameters, which are associated with all kinds of natural hazard. All of these parameters are severely influenced by meteorological parameters, which affect the coupling and, in some cases, enhance the frequency of natural hazards. A strong coupling has been observed with natural hazards (Chauhan et al. Citation2018; Feng et al. Citation2019), which affects the people living in the area where the hazards take place and, in some cases, severely impacts the Earth’s systems. Monitoring all of the components of the Earth is important for understanding this coupling between the Earth’s systems to forecast or provide an early warning of these natural hazards and also to mitigate their impacts.
Raj (Citation2010) has used satellite remote sensing data for a hazard assessment of glacial lakes in the Zanskar basin, Jammu and Kashmir, India. Using multi-temporal satellite data, Bhatt et al. (Citation2017) performed an assessment of one of the worst floods in the past 60 years in the state of Jammu and Kashmir in North India, which occurred in the first week of September 2014. The flood disaster footprints were extracted by using Indian Remote Sensing (IRS) satellite RISAT-1 and Canadian satellite Radarsat-2. The spatial and temporal dynamics of flood inundation and an evaluation of impacts were undertaken. Aggarwal et al. (Citation2016) used multispectral satellite images of Landsat and IRS satellites and have mapped glacial lake outburst flood (GLOF) and evaluated risk assessment in the Teesta river basin in the Sikkim state of India. They have utilized normalized difference snow index and slope map of the area for risk evaluation from the GLOF in 140 lakes in Sikkim area.
Ashraf et al. (Citation2012) used remote sensing and geographical information systems (GIS) to study atmospheric warming and melting of glaciers. They found that climate change is the major cause of GLOFs, which impacts large population living in the Himalayan region. The GLOFs impact social and economic damage in the affected region of the Himalaya. Thirty-five destructive outburst floods have been recorded for the Karakoram Range in the past 200 years. The detailed analysis of satellite and ground data using GIS has detected formation of about 2420 glacial lakes in the Hindukush–Karakoram–Himalaya (HKH) Region of Pakistan.
The multi-temporal ENVISAT Advanced Synthetic Aperture Radar Wide Swath Medium Resolution images have provided oil-spill frequencies and approximate oil-leak sources around the Oil Rocks Settlement around Chilov and Pirallahi Islands in the Caspian Sea (Bayramov and Buchroithner Citation2016). Detailed image analysis revealed that the spatiotemporal patterns of the currents in the Caspian Sea depend on the wind control and the multi-directional spatial distribution of oil spills around the Oil Rocks Settlement in the Islands. Satellite images must be used for continuous monitoring of environmental pollution due to oil spills, which are common at oil-drilling sites and also along the ship tracks in the ocean. Tang et al. (Citation2019) used remote sensing data to study the effect of the Penglai oil spills of 4 June 2011 on ocean ecology through the chlorophyll concentration in Bohai Sea, China.
Landslides are one of the common natural disasters around the world. The triggering of landslides occurs in the mountainous areas depending upon the slope and rocks types. The frequency of landslides is enhanced due to intense precipitation; earthquakes also induce landslides. The multi-satellite data are now being used to monitor soil moisture, slope in the mountain and vegetation cover, these parameters are being used to get an early warning of landslides. The earthquakes occurring in the mountainous regions trigger widespread landslides, causing blockage of flow of river that lead to flooding in the surrounding areas. Multi satellites are now capable in measuring and monitoring slow-moving surface deformation phenomena with millimetric precision which provide early warning in potential landslides areas (Bianchini et al. Citation2017; Kalantar et al. Citation2018)
Land degradation is a growing problem and has been enhanced by climate change, extreme precipitation and global warming. About 45% of the global land surface is covered by dry lands, which needs close monitoring so that land degradation may be stopped or overcome. Efforts have been made by agricultural and soil scientists to understand the causes of degradation, impact, degree and acquaintance with climate, soil, water, land cover and socioeconomic factors. In this regard, hyperspectral satellite sensing has emerged as an important technique for the assessment of soil properties (Sur and Chauhan Citation2019) and further multi-satellite sensors can provide information about atmospheric and meteorological parameters (Bhattacharjee et al. Citation2007, Sarkar et al. Citation2019), which can be used to get information and forecast of extreme events affecting the land degradation. The dust events have long-range transport, the movement of dust blankets ocean water and snow/glaciers (Singh et al. Citation2008; Kaskaoutis et al. Citation2012). This severely affects the ocean ecology and also accelerates melting of snow/glaciers, that raises question of sustainability of ground water.
The multi-sensor satellites have now provided long-term data of Earth components and vegetation to monitor the agricultural crops and to forecast crop yields. Furthermore, the meteorological parameters from ground and satellite data are used for long-term projection of crop yields and to monitor drought conditions (Kogan et al. 2015, Citation2016, Citation2020; Chen et al. Citation2017), which are important for food security and sustain the life of people on the planet. Long-term data from ground and satellite sensors are now available, but these observations need to be improved at high spatial and temporal resolution to save green forest on the planet which is the major sink of the increasing carbon dioxide, due to growing anthropogenic activities and forest fires (Lim et al. Citation2019) on every continent. Satellite data is successfully being used to monitor the forest fires and how ground and satellite observations help to protect these fires is a challenge before us.
The Intergovernmental Panel on Climate Change (IPCC) has identified three broad categories of extreme events, or disasters, with the potential to be altered by climate change. Hay and Mimura (Citation2010) discussed this categorization in the inaugural issue of this Journal where they stated that the extreme weather and climate events are major challenge. This Journal has published many papers related to all kinds of natural hazards occurring globally. The long-term ground and satellite data were used to study the qualitative and quantitative change in all components of Earth. Greenhouse emissions were identified as a major source which has increased in the last three decades, due to human activities that have impacted resources, ocean ecology, biodiversity, snow cover, glaciers, ground water resources and accelerated the extreme weather and climate events. Reducing the consequences of the impact of climate changes is a real challenge.
Ibrahim et al. (2016) discussed efforts in Malaysia at the Copenhagen COP-13 to reduce its carbon emission affecting climate change and interaction among various components of Earth systems, health, infrastructure at the national and global scale in the context of broader societal goals for sustainable development. The climate plays a very important role in the frequency, intensity and magnitude of all kinds of natural disasters affecting the global economics.
The satellite observations have been used widely to monitor snow/glaciers. The sea-level rise is the consequence of melting of snow/glaciers due to increasing anthropogenic activities and long-range transport of pollutants (dust and smoke plumes). Al-Nasrawai et al. (Citation2018) have used remote sensing observations to study the dynamic of coastline, ocean ecology, geomorphological changes and wetlands ecosystem. Kumar et al. (Citation2018) discussed the susceptibility of island and coastal erosion to climate change.
The Group of Earth Observations is making efforts to coordinate activities related to disaster and mitigations around the globe to educate people to use ground and satellite data so that people, wherever they live, can be safe, healthy and have enough resources for new generation. Geomatics, Natural Hazards and Risk invites contributions based on ground and satellite observations to understand the dynamics of earth’s components, interactions and forecast, all kinds of natural hazards so that the Earth’s environment could be sustained. The Journal promotes studies across all continents at both national and global scales to sustain, ground water—one of the important resources for the survival of humankinds, animal life and ocean resources, ecological balance and pollution free environment that may be more vulnerable due to changing climate. Maintaining healthy life on planet Earth is one of the main goals of Geomatics, Natural Hazards and Risk, which is only possible if we meet the challenge of the UN Sustainable Goals to sustain resources, protect the environment, and address climatic conditions and natural hazards associated with all components (lithosphere, hydrosphere, biosphere, cryosphere and atmosphere) of the Earth systems. For the qualitative and quantitative changes and future projections, ongoing and future observations and modelling will bring new challenges to explore and follow to achieve the goal of sustainability for our survival.
References
- Aggarwal A, Jain SK, Lohani AK, Jain N. 2016. Glacial lake outburst flood risk assessment using combined approaches of remote sensing, GIS and dam break modelling. Geomatics Nat Hazards Risk. 7(1):18–36.
- Al-Nasrawi AKM, Hamylton SM, Jones BG, Hopley CA, Al Yazichi YM.2018. Geoinformatics vulnerability predictions of coastal ecosystems to sea-level rise in southeastern Australia. Geomatics Nat Hazards Risk. 9(1):645–661.
- Ashraf A, Naz R, Roohi R. 2012. Glacial lake outburst flood hazards in Hindukush, Karakoram and Himalayan Ranges of Pakistan: implications and risk analysis. Geomatics Nat Hazards Risk. 3(2):113–132.
- Bayramov E, Buchroithner M. 2016. Modelling of oil spill frequency, leak sources and contamination probability in the Caspian Sea using multi-temporal SAR images 2006-2010 and stochastic modelling. Geomatics Nat Hazards Risk. 7(3):1175–1197.
- Bhatt CM, Rao GS, Farooq M, Manjusree P, Shukla A, Sharma SVSP, Kulkarni SS, Begum A, Bhanumurthy V, Diwakar PG, et al. 2017. Satellite-based assessment of the catastrophic Jhelum floods of September 2014, Jammu & Kashmir, India. Geomatics Nat Hazards Risk. 8(2):309–327.
- Bhattacharjee PS, Prasad AK, Kafatos M, Singh RP. 2007. Influence of a dust storm on carbon monoxide and water vapor over the Indo-Gangetic Plains. J Geophys Res. 112(D18):D18203.
- Bianchini S, Raspini F, Ciampalini A, Lagomarsino D, Bianchi M, Bellotti F, Casagli N. 2017. Mapping landslide phenomena in landlocked developing countries by means of satellite remote sensing data: the case of Dilijan (Armenia) area. Geomatics Nat Hazards Risk. 8(2):225–241.
- Chauhan A, Kumar R, Singh RP. 2018. Coupling between land–ocean–atmosphere and pronounced changes in atmospheric/meteorological parameters associated with the Hudhud Cyclone of October 2014. IJERPH. 15(12):2759..
- Chen CF, Son NT, Chen CR, Chiang SH, Chang LY, Valdez M. 2017. Drought monitoring in cultivated areas of Central America using multi-temporal MODIS data. Geomatics Nat Hazards Risk. 8(2):402–417.
- De Grove T. 2010. Flood monitoring and mapping using passive microwave remote sensing in Namibia. Geomatics Nat Hazards Risk. 1(1):19–35.
- Feng J, Singh RP, Shen X. 2019. Land–atmosphere–meteorological coupling associated with the 2015 Gorkha (M 7.8) and Dolakha (M 7.3) Nepal earthquakes. Geomatics Nat Hazards Risk. 10(1):1267–1284.
- Franci F, Mandanici E, Bitelli G. 2015. Remote Sensing analysis for flood risk management in urban sprawl contexts. Geomatics Nat Hazards Risk. 6(5–7):583–599.
- Hay J, Mimura N. 2010. The changing nature of extreme weather and climate events: risks to sustainable development. Geomatics Nat Hazards Risk. 1(1):3–18.
- Ibrahim K, Shabudin AFA, Chacko Koshy K, Asrar GR. 2016. A new framework for integrated climate finance and inclusive responses to sustainable development in Malaysia. Geomatics Nat Hazards Risk. 7(6):1754–1768.
- Kalantar B, Pradhan B, Naghibi SA, Motevalli A, Mansor S. 2018. Assessment of the effects of training data selection on the landslide susceptibility mapping: a comparison between support vector machine (SVM), logistic regression (LR) and artificial neural networks (ANN). Geomatics Nat Hazards Risk. 9(1):49–69.
- Kaskaoutis DG, Kosmopoulos PG, Nastos PT, Kambezidis HD, Sharma M, Mehdi W. 2012. Transport pathways of Sahara dust over Athens, Greece as detected by MODIS and TOMS. Geomatics Nat Hazards Risk. 3(1):35–54.
- Kogan F, Guo W. 2015. 2006–2015 mega-drought in the western USA and its monitoring from space data. Geomatics Nat Hazards Risk. 6(8):651–668.
- Kogan F, Guo W, Strashnaia A, Kleshenko A, Chub O, Virchenko O. 2016. Modelling and prediction of crop losses from NOAA polar-orbiting operational satellites. Geomatics Nat Hazards Risk. 7(3):886–900.
- Kogan F, Guo W, Yang W. 2020. Near 40-year drought trend during 1981-2019 Earth warming and food security. Geomatics Nat Hazards Risk. 11(1):469–490.
- Kumar L, Eliot I, Nunn PD, Stul T, McLean R. 2018. An indicative index of physical susceptibility of small islands to coastal erosion induced by climate change: an application to the Pacific islands. Geomatics Nat Hazards Risk. 9(1):691–702.
- Lim C-H, Kim YS, Won M, Kim SJ, Lee W-K. 2019. Can satellite-based data substitute for surveyed data to predict the spatial probability of forest fire? A geostatistical approach to forest fire in the Republic of Korea. Geomatics Nat Hazards Risk. 10(1):719–739.
- Raj KBG. 2010. Remote sensing based hazard assessment of glacial lakes: a case study in Zanskar basin, Jammu. and Kashmir, India. Geomatics Nat Hazards Risk. 1(4):339–347.
- Sarkar S, Chauhan A, Kumar R, Singh RP. 2019. Impact of Deadly Dust Storms (May 2018) on Air Quality, Meteorological, and Atmospheric Parameters Over the Northern Parts of India. Geohealth. 3(3):67–80.
- Singh RP. 2017. Reflections On the 1900 Galveston Hurricane, Hurricane Harvey, and the Increase in Extreme Weather Events https://fromtheprow.agu.org/reflections-1900-galveston-hurricane-hurricane-harvey-increase-extreme-weather-events/.
- Singh RP, Prasad AK, Kayetha VK, Kafatos M. 2008. Enhancement of oceanic parameters associated with dust storms using satellite data. J Geophys Res. 113(C11): C11008.
- Sur K, Chauhan P. 2019. Imaging spectroscopic approach for land degradation studies: a case study from the arid land of India. Geomatics Nat Hazards Risk. 10(1):898–911.
- Tang DL, Sun J, Zhou L, Wang SF, Singh RP, Pan G. 2019. Ecological response of phytoplankton to the oil spills in the oceans. Geomatics Nat Hazards Risk. 10(1):853–872.