
 ?Mathematical formulae have been encoded as MathML and are displayed in this HTML version using MathJax in order to improve their display. Uncheck the box to turn MathJax off. This feature requires Javascript. Click on a formula to zoom.
Abstract
In order to evaluate the risk level of water inrush caused by karst cave accurately and effectively, a novel quantitative assessment model was established based on the reliability theory and genetic algorithm-back propagation (GA-BP) neural network. First, the reliability theory and the calculation formula of the minimum safe thickness were used to calculate the water inrush probability. Second, the GA-BP neural network was applied to predict the disaster consequence caused by water inrush. Six factors, including water pressure, hydraulic supply, type of gap, filling situation, degree of water enrichment and reserves of cave, were selected as the input layer of the neural network. The disaster consequence was selected as the output layer. Similar projects were screened to obtain statistical information for indices, and the Normand function in MATLAB was used to transform the information into quantitative data. Finally, the model was established by combining the probability and disaster consequence of water inrush. The 602cave in Yesanguan tunnel was taken as an engineering sample to verify the feasibility of the novel model. The obtained results showed that the proposed model is comprehensive and accurate in quantitative assessment, which has good application prospects in engineering.
1. Introduction
With the rapid development of infrastructure construction in China, more and more high-risk long tunnels are waiting to be built. And most of them are in the karst mountains in western China (Li et al. Citation2017). Typical karst structures are mainly divided into three types, large karst cave, karst fault and dissolution fissure, which are the main difficulties in tunnel construction (Bukowski Citation2011). Once large-scale water and mud inrush is triggered, it will lead to delayed construction period, increased cost, casualties and other incalculable disaster consequences (Li et al. Citation2015; Shi et al. Citation2017). According to the previous engineering cases, the water inrush disaster caused by karst cave accounted for the largest proportion. And it has the characteristics of strong explosive force and large water irruption quantity (Li et al. Citation2020a, Citation2020b). Therefore, it is necessary to predict the risk level of water inrush caused by karst cave in advance to prepare for subsequent construction and risk management.
In recent years, the research on water inrush caused by karst cave was mainly the derivation of the minimum safe thickness. Many mature theories, including strength theory (Chu Citation2017), catastrophe theory (Li Citation2009), etc. have been used to calculate the minimum safe thickness between karst cave and tunnel. Among them, the improved calculation formula based on the principles of structural mechanics and fracture mechanics has also been proved to be effective. The application of catastrophe theory further enriched the applicable range of the minimum safe thickness calculation formula. It can be used to analyze the instability process of water-resistant rock strata from two aspects of static failure and dynamic failure. When the distance between the tunnel and the karst cave is less than the minimum safe thickness, the probability of water inrush disaster will increase significantly. In general, such studies provided an effective criterion to analyze whether water inrush will occur in tunnels. But in the calculation process, there are still some defects that cannot be ignored. For example, the uncertainty of the parameters has not been taken seriously. For parameters like rock strength and Poisson ratio (Wang et al. Citation2017a, Citation2019d), fixed values cannot represent their true changeable state.
The research on the prediction model of disaster consequences in the field of water inrush is relatively mature. Xu et al. (Citation2011) proposed the dynamic evaluation model of water inrush in karst tunnels based on the analytic hierarchy process. On this basis, Li et al. (Citation2019) improved the method of determining indices weights in the evaluation process based on variable weight theory and established the relationship between index weight and index value. The application of the ideal point method (Wang et al. Citation2019e) and attribute interval theory (Wang et al. Citation2019b) proved the feasibility of the multi-objective optimization evaluation method. Wang et al. (Citation2017b, Citation2017c, Citation2019c) applied the set pair analysis method, efficiency coefficient method and intuitionistic fuzzy theory in karst tunnels water inrush risk assessment to achieve the quantitative assessment of karst tunnels water inrush disaster consequences. However, the probability of water inrush disasters was not considered in the above methods. And the ideal risk assessment result is composed of the probability and consequence of water inrush disaster. In addition, the above research methods are not accurate enough to predict the consequences of water inrush disasters caused by karst cave. Their research object is karst tunnel in a broad sense, without distinguishing different disaster sources. And it is unreasonable that indices such as interlayer fissures and formation lithology are used to represent the characteristics of karst caves.
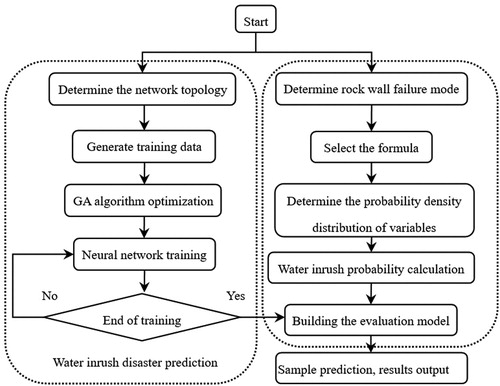
The article aims to introduce a new risk assessment model for water inrush disaster caused by karst cave. Based on the complexity and randomness of the underground environment, the prediction of water inrush probability and disaster consequence would be performed independently. The first step was to calculate the probability of water inrush based on the reliability theory and the minimum safe thickness formula. The entire calculation process would be implemented in MATLAB. And considering the uncertainty of the geological environment, the probability density distribution of random variables would be applied in the calculation rather than fixed values. The second step was to predict water inrush disaster consequence based on the genetic algorithm-back propagation (GA-BP) neural network. The input indicators and training data of the neural network were derived from the actual cases of water inrush disasters caused by karst caves. The output of the neural network was an ideal quantified result instead of a level, for example, I, II, III, IV, et.al. The third step was to determine the final risk level by combining disaster probability and disaster consequences. The risk grading standard in the current Chinese current norm ‘Interim Provisions for Risk Assessment and Management of Railway Tunnels’ was selected the judgment criterion. Finally, the 602cave in Yesanguan tunnel was analyzed as an engineering application case to verify the feasibility and effectiveness of the proposed model.
2. Methodology
2.1. Calculation principle of reliability method
Reliability is the ability of a product to perform a predetermined function under specified conditions, measured in probability (Zhang Citation2015). It is mainly accomplished by selecting the performance function, writing the calculation program with MATLAB software and repeating the calculation. The performance functions are often divided into dominant functions and recessive functions. Here, the formula of minimum safe thickness of karst tunnels was used as the dominant performance function. When the resistance capacity of against-inrush rock strata is greater than the disaster-causing force, the rock strata can effectively prevent the occurrence of water inrush. With the value range and distribution state of independent variables, the Monte Carlo method in reliability theory is adopted for multiple calculations. The higher the frequency that the resistance is less than the disaster force is, the higher the possibility of water inrush is.
2.1.1. The calculation formula of the minimum safe thickness
When the reliability theory is used to calculate the probability of water inrush, the key lies in the selection of the formula of the minimum safe thickness. The relevant calculation formula is shown in EquationEquation (1)(1)
(1) .
(1)
(1)
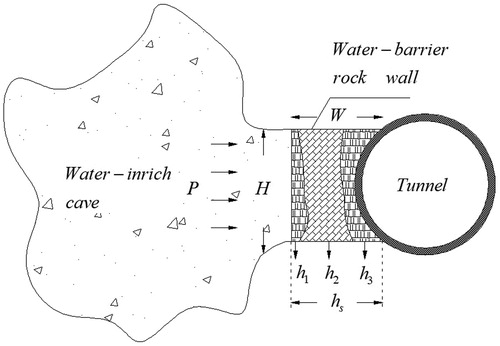
Where, hs is the distance between the tunnel and karst cave. h1 is the thickness of karst fracture zone. Both are determined by geophysical prospecting or drilling. h2 is the effective against-inrush thickness, which needs to be determined by further calculation. h3 is the influence thickness under blasting disturbance and excavation unloading, which is generally 1.5 m based on experience (Meng et al. Citation2020). When hs is equal to the sum of h1, h2 and h3, the rock strata between tunnel and cave is in a critical state, as shown in . According to the comparison between the sum of h1, h2, h3 and hs, whether water inrush occurs can be judged. When hs is larger, the rock strata can effectively prevent water inrush. When the sum of h1, h2 and h3 is larger, water inrush disaster will occur. Among them, h1 and h3 represent the thickness of the rock strata that cannot effectively resist water inrush.
Figure 1. Schematic diagram of EquationEquation (1)(1)
(1) .
The calculation of effective against-inrush thickness is mainly divided into relatively intact rock mass and non-intact rock mass for analysis. They correspond to the two main failure modes of the water-barrier rock strata, the whole instability failure and hydraulic fracturing failure. The judgment criterion of the failure mode is the classification criterion of rock mass integrity, as shown in . Jv is the number of joints contained in each cubic meter of rock.
Table 1. Classification standards for rock mass integrity (Ministry of Railways Citation2008).
When Jv is less than 10, the integrity of rock strata is better, and its failure mode is the whole failure instability. The rock strata can be simplified into an elastic thick plate model, and the theory of Reissner thick plate is adopted to calculate the effective against-inrush thickness. When shear stress or tensile stress of the dangerous section exceeds its shear or tensile strength, the rock strata loses its ability to resist water inrush. Unlike reinforced concrete members, there is a significant uncertainty in the parameter values of rock strata, which makes it impossible to determine the most dangerous cross section. Therefore, the final water inrush probability should be the sum of probability caused by tensile failure and shear failure. This makes the calculation results more conservative and safer. When tensile failure is used as the control condition, EquationEquation (2)(2)
(2) is the formula for calculating the effective against-inrush thickness. EquationEquations (3)
(3)
(3) and Equation(4)
(4)
(4) are the calculation formulas under shear failure (Guo et al. Citation2018).
(2)
(2)
(3)
(3)
(4)
(4)
Where, R is the equivalent radius of the rock wall. When the rock wall is a rectangle, H is the height of the rock wall and W is the span of the rock wall. σt is rock mass tensile strength. μ is Poisson ratio of rock mass. P is the water pressure inside the cave. γ is the weight of rock mass. φ is internal friction angle of rock mass. c is rock mass cohesion.
When Jv is greater than or equal to 10, the integrity of rock strata is poor, and its failure mode is hydraulic fracturing failure. According to the type of crack, it can be divided into two cases to consider. When there are many non-penetrating cracks in the against-inrush rock wall and the crack tip is prone to splitting failure under the action of high pressure. Based on the fracture mechanics, the formula of the effective against-inrush thickness can be derived according to the critical internal water pressure of the rock mass, as shown in EquationEquation (5)(5)
(5) .
(5)
(5)
Where, H1 is the buried depth of the tunnel. λ is the lateral pressure coefficient. a is half of the main crack length of the rock mass. f is the friction coefficient of the intermittent crack surface. lc is half of the rock bridge’s length. The more detailed derivation process can be found in reference (Guo Citation2011).
When there are penetrating cracks in the against-inrush rock wall, the effective against-inrush thickness can be calculated based on the slice method. The water-blocking rock plate is simplified to a statically determinate beam. The stability of rock wall is calculated according to the method of calculating the retaining wall. The detailed calculation steps have been listed in reference (Xu et al. Citation2020).
2.1.2. The calculation principles of Monte Carlo method
After the calculation formula of minimum safe thickness is determined, the dominant performance function could be constructed. The EquationEquation (6)(6)
(6) represents the limit state of the rock wall, and the EquationEquation (7)
(7)
(7) is a performance function with the essential random variables. Then, the Monte Carlo method is applied to calculate the probability of water inrush. Based on the enough random numbers, N calculations can be carried out by the MATLAB software. When the random event, g < 0, occurs m times, according to Bernoulli theorem of the law of large numbers, the frequency of random event in N independent tests is m/N. In other words, the probability of water inrush is m/N.
(6)
(6)
(7)
(7)
The method (Li et al. Citation2018) for calculating the water inrush probability of the rock wall is shown in EquationEquation (8)(8)
(8) .
(8)
(8)
Where, f x (x)= f x (x1, x2, …, xn) is the probability density function of basic random variables X= (X1, X2, …, Xn). EquationEquation (8)(8)
(8) represents the failure probability of the against-inrush rock wall under many failure modes. i = 1∼n represents the multiple failure modes.
According to the previous description, there are multiple failure modes that can trigger water inrush. The two major types of failure modes, the whole instability failure and hydraulic fracturing failure, can be judged based on jv. But the tensile failure and shear failure under the whole instability failure cannot be distinguished. When the failure mode of rock wall cannot be determined accurately, it should be treated as a series system to calculate the probability of water inrush. For example, when it is uncertain whether the water inrush is caused by tensile failure or shear failure, the final probability should be the sum of the probabilities in the two cases. Similarly, when the integrity of the rock mass is poor and the detection equipment cannot determine whether the crack is penetrating, both must be considered. However, based on the aforementioned classification of rock failure modes, the hydraulic fracturing failure caused by the nonpenetrating crack and the tensile failure under the whole instability failure will not occur at the same time.
2.2. Concept of GA-BP neural network
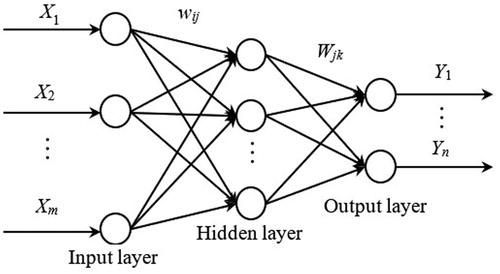
BP neural network is a kind of multilayer feedforward neural network which is trained according to the error reverse propagation algorithm. By training itself, the network learns certain rules to predict results (Yu et al. Citation2017). It can be regarded as a nonlinear function. The input value and output value of the network are independent variables and dependent variables of the function, respectively. Its topology is shown in . When the numbers of input and output nodes are m and n, the BP neural network expresses the function mapping relationship between m independent variables and n dependent variables (Wang Citation2013).
Figure 2. BP neural network topology.
Essentially, the BP algorithm is a gradient algorithm for nonlinear optimization, which is prone to fall into a local optimal solution. GA, also known as genetic algorithm, is based on the evolutionary principle of ‘survival of the fittest’ in biological world. Individuals are screened through selection, crossover and variation in heredity according to the selected fitness function. Individuals with good fitness value will be left. This cycle will be repeated until the termination conditions are met. The Genetic algorithm can make up for the defect that the neural network is prone to fall into the local optimal solution by optimizing the initial weight and threshold of the network. Therefore, the GA-BP neural network will be used to predict disaster consequences of water inrush in the proposed model.
2.3. Criterion of risk grading
After the calculation of the probability of water inrush and the prediction of disaster consequences are completed, the risk level can be evaluated according to . In general, the probability of acceptable risk in engineering cannot be higher than the probability of social disasters that people face in their daily lives, such as traffic accidents, lightning strikes and nuclear power plant leaks, etc. Therefore, the acceptable probability of water inrush disaster in karst tunnels must be less than 0.0003. In order to ensure that the boundaries between the probability levels are clear, the probability value of the higher level in the adjacent levels is usually ten times the probability value of the lower level. Evaluation factors, including deaths, economic losses and construction delay, will be considered in the assessment of the consequences of water inrush disasters, as shown in . Disaster consequences are determined according to the highest level to which these three factors belong. When all three factors belong to the same level, the level of disaster consequences is classified according to a higher level.
Table 2. Risk grading standards (Ministry of Railways Citation2008).
Table 3. Disaster consequences grading standards (Wang Citation2010; Wang et al. Citation2019a).
The acceptance criteria for different risk levels are as follows. When the risk level is low, it is negligible and does not require any treatment measures and monitoring. When the risk level is moderate, it is acceptable. No action is required beyond monitoring. When the risk level is high, it is not expected. Risk treatment measures must be taken to reduce risk and strengthen monitoring. And the cost of reducing risk cannot be higher than the losses caused by the risk. When the risk level is very high, it is unacceptable. That is necessary for engineers to reduce the risk level to the high level at all costs (Ministry of Railways Citation2008).
3. Establishment and validation of the evaluation model
3.1. Engineering background
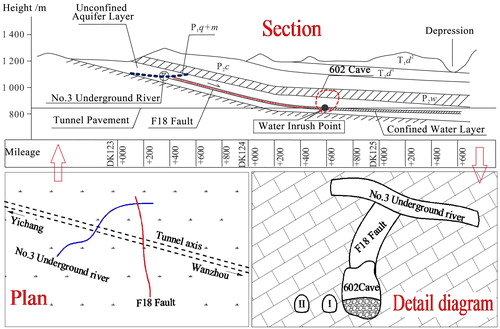
Yesanguan tunnel is located at Hubei Province in China, with a total length of 1.38 km. Karst is developed in the tunnel excavation area, with faults, karst pipes and underground rivers. And the maximum depth is 695 m (Ma Citation2012). The 602cave is located outside the sidewall of the DK124 + 602–625 exit section in the tunnel I line and mainly filled with mud, water, limestone rock. The surrounding rock grade of this section is Grade II, and the rock mass is relatively integral. According to the analysis of on-site exploration data, the development range of the 602cave is about 40 m on the left side of DK124 + 600∼+875, and about 100–150 m on the top. And the cave is connected to the No. 3 underground river through the F18 fault with a good hydraulic supply. The elevation of the underground river exit is 1050 m, which is 250 m higher than the tunnel. The engineering geological profile of Yesanguan tunnel is shown in .
Figure 3. Engineering geological profile of Yesanguan tunnel (Wu et al. Citation2009; Ma Citation2012).
3.2. Calculation of water inrush probability
According to the on-site exploration data, the distance between the 602cave and the tunnel sidewall, hs, is 7.5 m (Huang et al. Citation2018). The effective against-inrush area of the rock wall is 8 m high and 23 m long. The thickness of the karst fracture zone, h1, is 1.2–1.9 m. The impact thickness under blasting disturbance and excavation unloading, h3, is 1.5 m. Since the integrity of the rock wall is good, the effective against-inrush thickness, h2, will be calculated according to the whole instability failure mode. And both tensile failure and shear failure are considered.
The probability density distribution of the random variables is shown in , in which the tensile strength, Poisson ratio and gravity of the rock were considered according to the normal distribution. Among them, the tensile strength value was the test result in the saturated state. Due to the lack of on-site data, the water pressure, internal friction angle and cohesion were considered in accordance with the uniform distribution (Guo Citation2011). The detailed operation code is shown in the Appendix A.
Table 4. Distribution of values of random variables (Guo Citation2011).
3.3. Construction of GA-BP neural network
3.3.1. Acquisition of training data
To better describe the characteristics of the high-pressure water-rich cave, six indices including water pressure, hydraulic supply, type of gap, filling situation, degree of water enrichment and reserves of cave were selected as the input layer of the neural network. Among them, water pressure and type of gap have a great relationship with the amount of inrush in the early stage of water inrush. Hydraulic supply, degree of water enrichment and reserves of cave are related to the possible duration of the water inrush disaster and the later hazard intensity. When there is a lot of fillings in caves, the probability of mud inrush will greatly increase. In the case of mud inrush, the disaster consequences are often more serious. Disaster consequence was taken as the output layer of the neural network, and the number of neurons in the hidden layer was 10.
In order to facilitate the data learning in the neural network, each input index was graded and quantified based on the ability to induce disaster. The situation that four of six input indices are qualitative descriptions is no stranger because of the uncertain karst geological environment. The quantization process is to convert the qualitative information of each index into a quantitative range between 0 and 100. Classification standards based on previous research are shown in . According to the grading standards for disaster consequences in , the output index will be quantified and graded in the range of 0–100. 80–100 corresponds to catastrophic consequence, 60–80 corresponds to very serious consequence, 40–60 corresponds to serious consequence, 20–40 corresponds to large consequence and 0–20 corresponds to slight consequence. Based on the same quantitative value range, the connection between the input indices and the output index in the neural network is easier to be constructed.
Table 5. Input layer indicators grading standards and quantitative processing (Xu et al. Citation2011; Wang et al. Citation2017b, Citation2017c).
The 990cave in Dazhiping tunnel, the 978cave in Malujing tunnel, the YDK24 + 158cave in Xiangshan tunnel and the DK406 + 422cave in Bieyancao tunnel (denoted as Samples 1, 2, 3 and 4, respectively) were selected to generate network training data. By consulting a lot of literature, a qualitative description of each indicator of each sample could be found, such as the water pressure of Sample 1. Then according to the grading standards of each index in , the qualitative description could be transformed into the quantitative range. Based on these ranges, the probability density distribution of each index could be obtained. Here, it was assumed that each input index is normally distributed, and the standard deviation is estimated according to the 3σ criterion. That is, the average value of the index in the quantitative value range is three times its standard deviation value (Li et al. Citation2018). The disaster consequence of each sample would also be transformed into a random variable with a normal distribution determined by the mean and standard deviation in the same way. For those samples without specific disaster losses, some experts needed to be invited to give the specific quantitative ranges. The data statistics and value ranges of each sample are shown in and . After determining the mean and standard deviation, 2000 sets of random arrays were generated through the Normand function in MATLAB. Each sample contained 500 groups, 400 of which were for neural network learning and 100 were for the test. Meanwhile, the same method was used to quantify the input index of the 602cave in Yesanguan tunnel, and 100 sets of data were generated for the result prediction.
Table 6. Data statistics of each cave sample (Wang Citation2010; Huang Citation2011; Lei Citation2011; Ma Citation2012; Zhong Citation2012).
Table 7. Range and distribution of each input indicator.
3.3.2. Determination of network structure
The BP neural network structure is 6-10-1, with six independent variables, ten hidden neurons and one dependent variable. The calculation formula of the coding length of the genetic algorithm is shown in EquationEquations (9)–(11).
(9)
(9)
(10)
(10)
(11)
(11)
Where, A, B and C are the number of neurons in the input layer, hidden layer and output layer in the neural network. S1 is the weight length of the neural network. S2 is the threshold length of the neural network. S3 is the coding length of the Genetic algorithm. So, the coding length of the genetic algorithm is 81.
According to the description of samples, 2000 sets of random arrays were generated 1600 sets of data were randomly selected for network training, and the remaining 400 sets of data were used for network testing. Sum of the error absolute values of training data was taken as the individual fitness value. And the smaller the individual fitness value is, the better the individual is. The GA-BP neural network elements mainly include population initialization, fitness function, selection operation, cross operation and mutation operation (Wang Citation2013).
The parameter settings of the genetic algorithm and BP algorithm are shown in . Each evolution makes the individual more adapted to the training environment. So, the larger the evolution number is, the better the training effect is. But in practical applications, scholars often find a balance between the accuracy of the results and the efficiency of execution. Population size refers to the total number of individuals in any generation and is generally set artificially. The key to genetic algorithm is cross probability and mutation probability. Cross probability is used to determine the degree to which two individuals are crossed. And mutation probability is used to determine how many individuals will mutate during training. The operation flow chart of GA-BP neural network is shown in .
Figure 4. Operation flow chart of GA-BP neural network (Wang Citation2013).
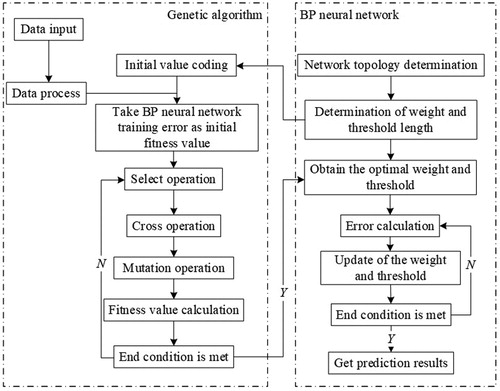
Table 8. The parameter settings of Genetic algorithm and BP algorithm.
Although the learning goal set in this article is not high. Considering that the training data was generated by MATLAB software and the final prediction result is a range rather than a fixed value, 0.003 is acceptable as the learning goal. The required running code of the GA-BP neural network is shown in the Appendix B.
3.4. Calculation process
The central idea of the proposed model is to predict the disaster probability and disaster consequence, respectively, and then the risk level is judged based on both. The calculation flow chart is shown in .
Figure 5. Calculation flow chart.
4. Analysis of calculation results
4.1. The probability of water inrush
According to the dominant performance function and probability density distribution of each random variable, the MATLAB software was used to estimate the water inrush probability of the 602cave. The result is 0.3266.
4.2. Analysis of GA-BP neural network results
During the training process of GA-BP neural network, the changes of optimal individual fitness value, the predicted output of BP neural network, prediction error and prediction error percentage are shown in . It could be found that the established network has high accuracy. The error percentage of the results ranges from 0.001% to 8.04%. The average value is 1.1%, and the standard deviation is 0.01. Except for the extremely large data error, the others satisfy the requirements. The prediction results of water inrush disaster caused by the 602cave are shown in .
Figure 6. Results analysis of GA-BP neural network (a) Optimal individual fitness, (b) Network predictive output, (c) Network prediction error, (d) Network prediction error percentage.
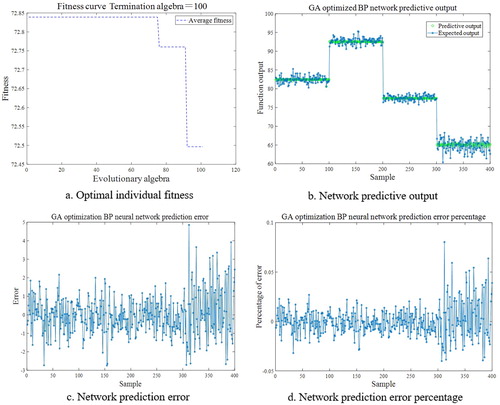
Table 9. The result of water inrush disaster prediction of the 602cave.
4.3. Risk assessment result of the 602cave
As can be seen from , 91 of the 100 prediction results are subordinate to the catastrophic category in which the quantitative range is 83.66–92.55. According to the principle of maximum membership degree, the prediction result of the 602cave water inrush disaster is catastrophic. Combined with the 32.66% water inrush probability calculated in the previous section, the final risk level is very high according to the risk grading standards in . Based on the acceptance criteria mentioned earlier, this risk level is unacceptable and must be reduced at all costs.
5. Results verification and analysis of disaster causes
On 5 August 2007, the Yesanguan Tunnel was excavated to DK124 + 602. At about 1:00 in the morning, the water inrush disaster occurred, accompanied by a large amount of sediment and stones. The peak water inrush lasted for nearly half an hour. The situation of water inrush is shown in . The total volume of water inrush was 150,000 cubic meters, and the mud volume was 50,000 cubic meters. The water inrush disaster caused the 200 m tunnel to be filled with sediment and killed ten people, and the maximum drowning height was 7 m. The construction team took 17 months to complete the treatment of 602cave (Shi Citation2014). Moreover, due to the long-term water inrush from the tunnel, the water level of the No. 3 underground river dropped and eventually dried up. The water inrush disaster not only changed the geographical and hydrological environment in the area but also affected the lives and production of local inhabitants (Ma Citation2012). From the perspective of disaster consequences, the actual situation fully met the definition of very high risk, which proved the accuracy of the evaluation model established.
Figure 7. Situation of water and mud inrush in Yesangaun Tunnel (Lei Citation2011).
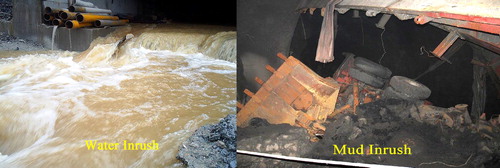
The reason for the large-scale water inrush is that under the action of high-pressure water, the groundwater was filled with the 602cave above the tunnel through the F18 fault zone and inter-layer fissures. Then, under the effect of water level difference, the intact rock strata between the tunnel and the 602cave was fractured by high water pressure transmitted from the No. 3 underground river through the fractured rock mass. Eventually, the against-inrush rock strata were crushed, causing large-scale water and mud inrush, which is a typical compound geological disaster (Wu et al. Citation2009).
Scholars of Shandong University (Huang et al. Citation2018) used the karst tunnel water inrush and mud evaluation method (PSAM method) to evaluate water inrush of the 602cave in Yesanguan tunnel. And they concluded that the 602cave would cause a delayed water inrush disaster. The evaluation indices in the PSAM method are mostly at the micro level. And based on this method, it can be determined whether the against-inrush structure is directly damaged or lagging. However, the evaluation results are relatively simple. It can only illustrate the disaster occurrence mode, and cannot show the probability of disaster occurrence and possible consequences. This is obviously insufficient for a reasonable risk assessment. The comparison between the PSAM method and the method proposed in this article are shown in .
Table 10. Comparison between PSAM method and the method proposed in this article.
The advantage of the proposed model in this article is that specific results of water inrush probability and water inrush consequence can be obtained separately to evaluate the risk level. In addition, both probability calculation and disaster consequence prediction methods can also be applied to the risk assessment of tunnel water inrush caused by other disaster sources, such as karst pipelines. It only needs to change the performance function, neural network structure and training samples in the application process.
6. Conclusions
For the water inrush disaster caused by the high-pressure water-rich karst cave, a novel risk assessment model based on reliability theory and GA-BP neural network was constructed. Based on the reliability theory, the new model provides a quantitative calculation program for water inrush probability, which greatly compensates for the shortcomings of the previous evaluation models. And according to the characteristics of high-pressure water-rich karst cave, the corresponding neural network was established. In the complex geological environment, the data learning from similar samples ensures the accuracy of disaster assessment.
The suitable minimum safe thickness calculation formula was used as the performance function to calculate the probability of water inrush. The probability density distributions of various calculation parameters were used to replace fixed values, which is consistent with the randomness of the parameters. At the same time, the GA-BP neural network was used to predict the consequences of water inrush disaster. Six indices, including water pressure, hydraulic supply, type of gap, filling situation, degree of water enrichment and reserves of cave, were selected to construct a disaster consequence evaluation system for water inrush caused by karst caves. Based on the normrnd function, 4 sets of similar cases were selected to generate training data, test data and prediction data of the network. Then, the established model was applied to the 602cave in Yesanguan Tunnel. The evaluation results were in good agreement with the actual results and the prediction results of the PSAM method, which proves the effectiveness and superiority of the new model.
The novel model compensated for the inadequacy of some statistical data by qualitative description, quantitative processing and the method of generating random arrays. But it should still be improved in the future. Reducing the subjective intent in the data processing process and enriching the calculation formula of the minimum safe thickness are problems that need to be solved.
Supplemental Material
Download MS Word (28.5 KB)Disclosure statement
No potential conflict of interest was reported by the authors.
Additional information
Funding
References
- Bukowski P. 2011. Water hazard assessment in active shafts in upper Silesian coal basin mines. Mine Water Environ. 30(4):302–311.
- Chu HD. 2017. Study on mechanism of water inrush and safety thickness of against-inrush layer in Kast tunnel. Wuhan: China University of Geosciences.
- Guo JQ. 2011. Study on against-inrush thickness and water burst mechanism of karst tunnel. Beijing: Beijing Jiaotong University.
- Guo JQ, Chen JX, Chen F, Huang SX, Wang HY. 2018. Using the schwarz alternating Method to identify critical water-resistant thickness between tunnel and concealed cavity. Adv Civ Eng. 2018:1–14.
- Huang X, Lin P, Xu ZH, Li SC, Pan DD, Gao B, Li ZF. 2018. Prevention structure assessment method against water and mud inrush in karst tunnels and its application. J Cent South Univ. 49(10):2533–2544.
- Huang XJ. 2011. Geological forecast for cavity at +978 of malujing tunnel on Yichang-Wanzhou railway. Mod Tunn Technol. 48(1):128–132.
- Lei J. 2011. Study on the forming regular pattern and risk assessing method of karst water inrush disaster during tunnel construction in Yi-Wan railway. Beijing: Beijing Jiaotong University.
- Li L, Lei T, Li S, Zhang Q, Xu Z, Shi S, Zhou Z. 2015. Risk assessment of water inrush in karst tunnels and software development. Arab J Geosci. 8(4):1843–1854.
- Li LP. 2009. Study on catastrophe evolution mechanism of karst inrush and engineering application of high-risk karst tunnel. Jinan: Shandong University.
- Li LP, Sun SQ, Wang J, Song SG, Fang ZD, Zhang MG. 2020a. Development of compound EPB shield model test system for studying the water inrushes in karst regions. Tunnelling Underground Space Technol. 101:103404.
- Li LP, Sun SQ, Wang J, Yang WM, Song SG, Fang ZD. 2020b. Experimental study of the precursor information of the water inrush in shield tunnels due to the proximity of a water-filled cave. Int J Rock Mech Min Sci. 130:104320.
- Li SC, He P, Li LP, Zhang QQ, Shi SS, Xu F, Liu HL. 2018. Reliability analysis method of sub-classification of tunnel rock mass and its engineering application. Rock Soil Mech. 39(3):967–976.
- Li SC, Wu J, Xu ZH, Li LP. 2017. Unascertained measure model of water and mud inrush risk evaluation in karst tunnels and its engineering application. KSCE J Civ Eng. 21(4):1170–1182.
- Li Z Y, Wang Y C, Liu Y, Jiao Q L, Wang M T, Zhang Y. 2019. Model on variable weight-target approaching for risk assessment of water and mud inrush in intrusive contact tunnels. J Cent South Univ. 50(11):2773–2782.
- Ma D. 2012. Study on impact mechanism of deep buried Karst to tunnel safety and the treatment technique. Beijing: Beijing Jiaotong University.
- Meng FS, Wang YC, Jiao QL, Wang YM, Li ZY. 2020. Analysis of the minimum safe thickness of water inrush in fault fracture zone based on the silo theory. J Harbin Inst Technol. 52(02):89–95.
- Ministry of Railways. 2008. Interim provisions on risk assessment and management of railway tunnels. Beijing: China Railway Press.
- Shi SS. 2014. Study on seepage failure mechanism and risk control of water inrush induced by filled disaster structure in deep-long tunnel and engineering applications. Jinan: Shandong University.
- Shi SS, Bu L, Li SC, Xiong ZM, Xie XK, Li LP, Zhou ZQ, Xu ZH, Ma D. 2017. Application of comprehensive prediction method of water inrush hazards induced by unfavorable geological body in high risk karst tunnel: a case study. Geomat Nat Haz Risk. 8(2):1407–1423.
- Wang XS. 2013. 43 case studies of MATLAB neural network. Beijing: Beijing University of Aeronautics and Astronautics Press.
- Wang XT, Li SC, Xu ZH, Hu J, Pan DD, Xue YG. 2019a. Risk assessment of water inrush in karst tunnels excavation based on normal cloud model. Bull Eng Geol Environ. 78(5):3783–3798.
- Wang XT, Li SC, Xu ZH, Li XZ, Lin P, Lin CJ. 2019b. An interval risk assessment method and management of water inflow and inrush in course of karst tunnel excavation. Tunnelling Underground Space Technol. 92:103033.
- Wang YC, Chen F, Yin X, Geng F. 2019c. Study on the risk assessment of water inrush in karst tunnels based on intuitionistic fuzzy theory. Geomatics Nat Hazards Risk. 10(1):1070–1083.
- Wang YC, Geng F, Yang SQ, Jing HW, Meng B. 2019d. Numerical simulation of particle migration from crushed sandstones during groundwater inrush. J Hazard Mater. 362:327–335.
- Wang YC, Jing HW, Su HJ, Xie JY. 2017a. Effect of a fault fracture zone on the stability of tunnel-surrounding rock. Int J Geomech. 17(6):04016135–04016120.
- Wang YC, Jing HW, Yu LY, Su HJ, Luo N. 2017b. Set pair analysis for risk assessment of water inrush in karst tunnels. Bull Eng Geol Environ. 76(3):1199–1207.
- Wang YC, Olgun CG, Wang LB, Meng B. 2019e. Risk assessment of water inrush in Karst tunnels based on the ideal point method. Pol J Environ Stud. 28(2):901–911.
- Wang YC, Yin X, Geng F, Jing HW, Su HJ, Liu RC. 2017c. Risk assessment of water inrush in karst tunnels based on the efficacy coefficient method. Pol J Environ Stud. 26(4):1765–1775.
- Wang YG. 2010. Study on scourge and prevention of karst tunnel water inrush. Beijing: China academy of railway sciences.
- Wu L, Wan JW, Chen G, Zhao L. 2009. Cause of the “8.5” water burst incident at Yesanguan tunnel along the Yi-Wan railway. Carsologica Sinica. 28(2):212–218.
- Xu ZH, Huang X, Li SC, Lin P, Shi XS, Wu J. 2020. A new slice-based method for calculating the minimum safe thickness for a filled-type karst cave. Bull Eng Geol Environ. 79(2):1097–1111.
- Xu ZH, Li SC, Li LP, Hou JG, Sui B, Shi SS. 2011. Risk assessment of water or mud inrush of karst tunnels based on analytic hierarchy process. China J Rock Soil Mech. 32(6):1757–1766.
- Yu XG, Han J, Shi LQ, Wang Y, Zhao YP. 2017. Application of a bp neural network in predicting destroyed floor depth caused by underground pressure. Environ Earth Sci. 76(15):535.
- Zhang M. 2015. Structural reliability computations. Beijing: Science Press.
- Zhong YX. 2012. Key risks assessment and control in tunneling of Xiangshan super-long railway tunnel. Railway Invest Surv. 38(04):37–41.
Appendix A
≫ muX = [0.2255,3.515,1.55,26.22];sigmaX = [0.0233,0.4626,0.117,0.672];
nS = 1e6;
x = [normrnd(muX(1),sigmaX(1),nS,1),normrnd(muX(2),sigmaX(2),nS,1),normrnd(muX(3),sigmaX(3),nS,1),normrnd(muX(4),sigmaX(4),nS,1)];
g = [6-x(:,3)-sqrt((15.*60.0625.*(1-x(:,1).^2))./(40.*x(:,2).*(1-x(:,1))-48.*(1 + x(:,1)))),6-x(:,3)-(3.2645./(5.6853*x(:,4)+26.88))];
≫ nF = length(find(g < 0));
pF = nF/nS
pF =
0.3266
Appendix B
≫ num = xlsread('1232.xlsx','sheet2','A1:G2000');
inputnum = 6;
hiddennum = 10;
outputnum = 1;
input_train = num(1:1600,1:6)';
output_train = num(1:1600,7)';
input_test = num(1601:2000,1:6)';
output_test = num(1601:2000,7)';
Note: Since the characters of most codes are the same, the rest of the codes can be queried through the URL http://ilovematlab.cn/thread-178840-1-1.html. And the above code can run normally on MATLAB 2018a version software.