
Abstract
The ground deformation phenomena are the result of the application of natural stress (tectonic) or anthropogenic stress (overexploitation of groundwater, embankment) on the soil. The land deformation may cause several impacts on the environment and human life. A good understanding of the deformation behaviour of the soil is essential to mitigate risks on the infrastructure and environment. In this study, a radar interferometry is carried out to analyse the mobility of an urban and suburban area of Greater Tunis region. The interferometric synthetic aperture radar (SAR) technique has been proven to be an effective methodology for detecting and monitoring soil displacement with millimetre accuracy and also, improving our understanding of the current deformations in the study area. Indeed, the application of differential SAR interferometry made it possible to determine the origin of the surface deformations related to natural or anthropic phenomena. In this paper, the interferometric method of small baseline subset (SBAS) developed by Berardino et al. 2002has been chosen, in order to monitor the spatial and temporal pattern of the deformation phenomena in Greater Tunis region. The analysis of Envisat ASAR (2003–2007, descending satellite orbit) and Sentinel 1B (2016–2018, ascending satellite orbit) SAR data allowed us to create deformation velocity maps associated with line of sight displacement time series. The results obtained by this method showed the existence of subsidence phenomenon in the urban areas (Tunis City) as well as in the rural areas (Mornag plain). In the first site (Tunis City), the subsidence rate reaches up to 13.98 mm/year and 19 mm/year during 2003–2007 and 2016–2018, respectively. The ground deformation that is detected around the region of Tunis Lake and Sebkhet Essijoumi, is probably due to the nature of the highly compressible and thickness alluvial deposits and whose substratum depth sometimes reaches more than 60 m. In the second studied site, ground subsidence was identified in the whole plain of Mornag. Indeed, the comparison between piezometric data and time series deformations shows that the trend of soil subsidence is coherent with the dynamic change in groundwater levels. Furthermore, the analysis of velocity deformation, geological data and hydrogeological information allows us to associate all the detected settlement patterns to groundwater overexploitation and compressible alluvium all over the plain. This overexploitation of groundwater in Mornag plain is mainly caused by the expansion of agricultural and industrial activities and the decrease in annual rainfall in recent years (from 2003 to 2018).
1. Introduction
Ground subsidence is generally the sudden sinking or gradual settling of the earth’s surface (Galloway et al. Citation1999). This phenomenon may be due to natural effects such as tectonic and compaction of sediments and/or human activities (anthropogenic processes), such as excessive exploitation of groundwater, natural gas, oil, etc. Land subsidence may lead to dangerous consequences that gravely impact human life. It represents a major risk for natural environment and country’s national economy. Indeed, in urban areas, continuous ground lowering for a long time may cause serious problems to linear infrastructures, buildings and underground facilities. Several studies have focused on serious damages caused by subsidence in urban or rural areas, in order to reduce the adverse impact of land subsidence on the environment and infrastructures (Hu et al. Citation2004; Cascini et al. Citation2006; Castellazzi et al. Citation2016). In this work, we performed an investigation of the surface deformation phenomena and its mechanism occurring in Greater Tunis area (Grand Tunis). This study area represents the main socio-economic centre of Tunisia. Under strong demographic pressure, many new constructions and highways were built on the edge of marshy zones and in unstable wet areas. Rapidly, land subsidence appeared in this area newly invested by project partners. On the other hand, in the peri-urban area of Mornag plain, drinking water resources have come under heavy pressure, especially due to agricultural and industrial activities. As a result, the aquifers of this region are more and more solicited by pumping. This excessive groundwater extraction has led to a deficit in groundwater recharge, which has sometimes reached an alarming level. Indeed, the overexploitation of Mornag aquifer has triggered a reduction of water storage, which has been resulted in significant regional subsidence and the symptoms are expressed by superficial soil deformation. Many methods are used to monitor land subsidence such as global positioning system (GPS), extensometer and traditional levelling (Diao et al. Citation2018). Generally, these conventional techniques allow us to perform precise and reliable measurements but they are very time consuming and have a high cost for installation and maintenance (Ferretti et al. Citation2007). In order to address the limitations of classical methods, the differential interferometric synthetic aperture radar (DInSAR) has proved their capabilities to measure subsidence deformation with a relative low cost and a precise ground deformation monitoring. The monitoring of land deformation using DInSAR technique is measured by calculating the phase difference between two synthetic aperture radar (SAR) images captured at different times (Rosen et al. Citation2000). In addition, in the last 20 years, this valuable approach has demonstrated its ability to detect anthropogenic or/and natural subsidence phenomena (Deffontaines et al. Citation2017, Citation2018), with high spatial resolution and high density of surface measurements, over a wide area and several durations. Nevertheless, the measuring of ground movements using DInSAR technology may be affected by many factors such as atmospheric problems and temporal and spatial decorrelation. To overcome these imperfections, the small baseline subset (SBAS) technique (Berardino et al. 2002) was used to improve the accuracy of the subsidence monitoring in Greater Tunis area.
For this purpose, in this study, we tried to detect and monitor ground deformation affecting the study area through the generation of deformation rate maps and displacement time series. In fact, during this research, we aimed to explore risk areas in the city of Tunis and its surroundings, particularly the areas located near the Lake of Tunis and Sebkhet Essijoumi whose soil is being compacted on the one hand, and in Mornag plain, whose phreatic system has been overexploited over the past two decades.
2. Study area
Two case studies in Greater Tunis region that monitor ground movement were presented.
2.1. Tunis City
The city of Tunis covers an area of almost 220 km2 (). It is characterized by high population density which is greater than 4000 persons/km2. The city has been developed on a series of hills with approximate direction N-S forming a bead corresponding to the places known as Montfleury, Kasbah, Ras Tabia, Notre Dame de Tunis, Saida Manoubia and La Rabta. This zone is limited to the East and West by two large depressions corresponding respectively to:
Figure 1. The geographic location of the region of Tunis. Source: Author
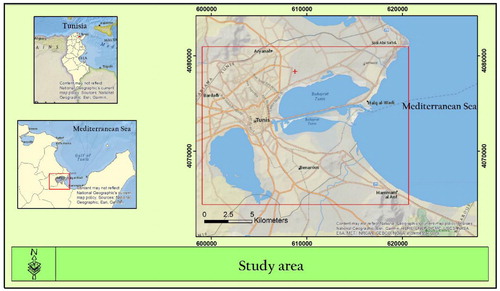
Tunis Lake spreads out along the depression of Ariana, part of which is occupied by Sebkhet of Ariana;
Sebkhet Essijoumi is spread out over the plain of Mannouba-Oued Ellil.
2.1.1. Geotechnics, geology and seismic context
The geotechnical work describes the filling of the depressions of Tunis Lake and Sebkhet Essijoumi. It is generally a filling of Pliocene and Quaternary clay and sand, containing a metric level of limestone (El May et al. 2010). The urbanization spreads across the side of the medina quarter that is located on the shores of Tunis Lake. This is an old marshy area that experienced in recent years, many disorders on some buildings. Similarly, on the eastern side of the medina, shanty towns developed and invaded a large part of the Essijoumi depression.
As regards tectonics, Sebkhet Essijoumi and Tunis Lake correspond to the graben bordered by faults. The tectonic control would be responsible for the thickening of the Mio-Plio-Quaternary series belonging to these two depressions. The assembly of
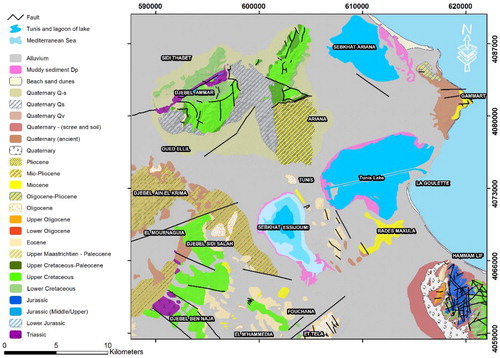
1:50.000 scale geological maps of Ariana, La Marsa, La Goulette and Tunis () shows that the outcrops of the Cretaceous, Jurassic and Eocene carbonate formations constitute the mountainous areas and the Quaternary alluvial deposits constitute the most extensive outcrops of the city of Tunis. These cover all the plains and a significant part of the reliefs located in the study area.
Figure 2. Assembly of the geological maps (1:50.000) of Ariana, Marsa, Tunis and La Goulette (Source: modified from ONM, Ferchichi et al. 2017).
Tunisia’s seismicity is moderated compared with other Mediterranean regions such as Algeria and Morocco (Kacem Citation2004; Mansour et al. Citation2013). On 1 December 1970, a largest earthquake occurred in Tunis City with a magnitude of Richter Scale 5.1 and caused severe damage to some buildings without causing civilian casualties (Ambraseys Citation1962; Mellouli Citation1984; Vogt 1993). However, before the twentieth century, the region of Tunis was affected by two major earthquakes that were considered destructive. The first event occurred in December 856, with a magnitude of 6.2 and an intensity of IX, causing the death of 45,000 victims (Mansour et al. Citation2013). The second earthquake hit the region in 1758 with an intensity of IX destroying a large number of houses and leadi (Ferchichi, Ben Hamouda and Ben Mammou Citation2017)ng to several deaths (Ambraseys Citation1962; Mansour et al. Citation2013).
2.2. The Mornag plain
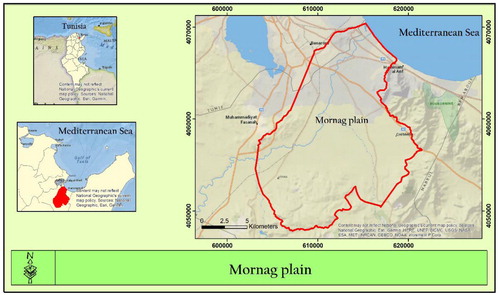
The plain of Mornag is located 20 km to the south of Tunis City, which represents the future extension of the city (). It is a coastal zone of the Mediterranean basin, which is bounded in the South-East by tectonic alignment formed by the Zaghouan thrust which corresponds to the alignment of the Boukornine, Ressas and Zaghouan massifs, and in the N-W by the hills of Megrine, Radès, Bir El Kassa and J. Tella. The plain is mainly drained by the streams of Meliane and El Hma and it extends from the hills of Khledia upstream to the Gulf of Tunis downstream. This area is an alluvial plain filled with quaternary deposits whose thickness is variable. The area of the plain is about 250 km2 and its altitude varies from 0 to 310 m above sea level. This zone has a very important socio-economic role because it is located in the vicinity of the capital Tunis. The Mornag region has an arid to semi-arid climate with an annual average rainfall of 450 mm.
Figure 3. Study area (Mornag plain). Source: Author.
2.2.1. Geology and hydrogeology context
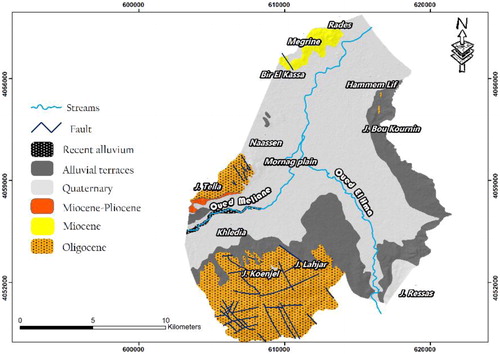
Mornag plain appears as a large basin corresponding to the graben controlled by tectonic events according to N-S and NW-SE to N160 directions, which affected the filling of the Mio-Plio-Quaternary (Farhat Citation2011). The centre of the plain is covered by recent Quaternary sediments (). Despite the density of the surveys carried out in this area, we deduced that:
Figure 4. Geological map (1:50.000) showing the main outcrops of the Oligo-Quaternary in Mornag plain (Source: La Goulette and Tunis).
The Quaternary is dominated by clays, silty clays and sands;
The cumulative power of the plastic components exceeds 50%;
The thickest series are located in the centre of the basin and more precisely in the valley of the Wadi Hma whose thickness reaches 600 m at Sidi Saad ();
Figure 5. Variation of thicknesses of the Quaternary sediments (compressible layers) in Mornag plain (Farhat 2011). Source: Author
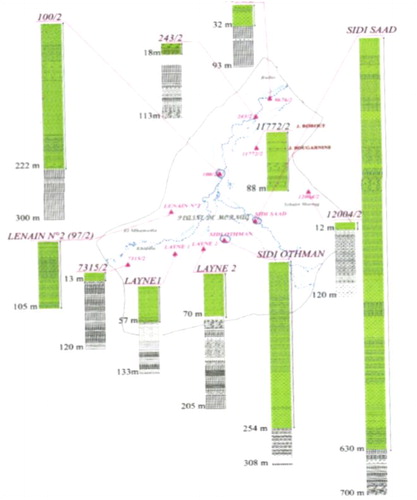
At the confluence (O. Meliane-O. Hma), the thickness of Quaternary sediments is 220 m ();
Quaternary is reduced to 13 m upstream (well 7315/2) and 32 m downstream (well 9676/2).
According to the studies established by Ennabli (Citation1977, Citation1980), the plain of Mornag is constituted by an aquifer system. This system is formed by two partially superimposed aquifer levels:
The Oligo-Miocene syncline of Khelidia is composed of three confined sandstone aquifers: the lower Oligocene, the Numidian and the Vindobonian. They are fed mainly by infiltration of water in the detrital outcrops: Rades, Rarouf, Tella and Khélidia. These aquifers constitute the deepest reservoir under all the plain.
A significant portion of the groundwater flows downstream into the alluvial deposits of Mornag plain (Jarraya-Horriche 2004);
The alluvial Mornag plain is an unconfined aquifer, whose groundwater is stored in recent quaternary series includes a clay-detritic complex and sand with coarser materials. The detrital sediments of Mornag plain are essentially formed by impermeable to semi-permeable soils, leaving the possibility of communication between the different layers of the Oligo-Mio-Pliocene and Quaternary.
This plain is fed by direct infiltration of the rain during periods of flooding from the runoff coming from Miliane and El Hma rivers.
3. Materials and methods
Remote sensing techniques make it possible to carry out deformation analyses over large areas by exploiting a large number of radar data. In this context, the DInSAR has established itself as an effective methodology for detecting the small displacements of the ground. This technique exploits the phase difference between two SAR images acquired under similar geometric conditions but at different dates, to measure and quantify the movement of soil. Indeed, many DInSAR studies demonstrated the interest of such an approach in particular to study the oil subsidence (Fielding et al. Citation1998), the subsidence of urban works, the variations of the piezometric levels of groundwater (Deffontaines et al. Citation2004; Fruneau et al. Citation2005). This technique has also been used for the study of the surface displacements induced by the ex-mining of Montceau-les-Mines (Carnec et al. Citation2001).
Recent work on the interferometric SAR technique aims to study not only single event deformation phenomena, but also the temporal evolution of identified displacements through the generation of time series of the deformations (Deffontaines et al. Citation2016; Qiu et al. Citation2019). These approaches benefit from the availability of extensive SAR data archives, including those acquired over the past 20 years by SAR sensors such as Envisat ASAR data provided by the European Space Agency (ESA) (Zhang et al. Citation2014). Among these advanced interferometric approaches, we focused on the SBAS method developed by Berardino et al. (2002). The algorithm of this technique allows us to obtain extensive, accurate and dense measurements of ground surface deformation maps (Casu Citation2009). It also makes it possible to use a large number of images while avoiding some problems of noise decorrelation (Calamita et al. Citation2019; Vicari et al. Citation2019). Therefore, this method is a tool of high accuracy in the analysis of surface deformation along the line of sight (LOS), and it can allow a better understanding of the mechanisms generating these displacements.
Indeed, the SBAS approach makes it possible to identify and follow the temporal evolution of the earth deformation with a high degree of spatial and temporal coverage. In particular, this technique is based on the utilization of a large number of SLC (single look complex) radar images based on the principle of SAR aperture synthesis and implements an easy combination of differential interferograms. This process makes it possible to obtain from multiple unwrapped interferograms, displacement time series and velocity maps.
3.1. SAR data
To study soil deformations in the Greater Tunis area, we used two types of SAR images. First, we exploited the Envisat ASAR radar images that were provided by the ESA in 2002. The sensor of this radar is characterized by an advanced synthetic aperture to detect surface area variations (ASAR). In this section, we used 17 images in descending acquires in band in C-band and covering the period from 24 September 2003 to 31 January 2007 (). The orbital cycle of Envisat ASAR data is 35 days. The data archives acquired by the Envisat satellite help scientific research on Earth and enable long-term monitoring of environmental and climatic changes.
Table 1. Characteristics of Envisat ASAR and Sentinel 1B SAR data used for the analysed periods (2003–2007) and (2016–2018).
As part of the Copernicus programme, the ESA launched on 25 April 2016 the satellite Sentinel 1B (). The sensor of this satellite proposes acquisitions by SAR over large areas (Swath = 250 km) with high temporal and spatial resolution. This new generation of satellites provides open data products to enable scientists to study changes on the surface of the Earth. In this study, we used 14 Sentinel 1B (C-band) images in ascending orbit, acquired with the TOPSAR technique and covering the period from 6 October 2016 to 8 October 2018. They are characterized by a spatial resolution of 20 m × 5 m and with a temporal resolution of 6 days. The interferometric acquisition mode for this type of image is (IW). The general characteristics of this radar data are presented in .
3.2. SBAS processing
The processing of SAR data was performed using the SARscape software (version 5.2), which runs on the ENVI platform, as an additional module.
The SARscape software was developed and produced by Sarmap AG, Switzerland, which was founded in 1988.The interferometric analysis of the Envisat ASAR and
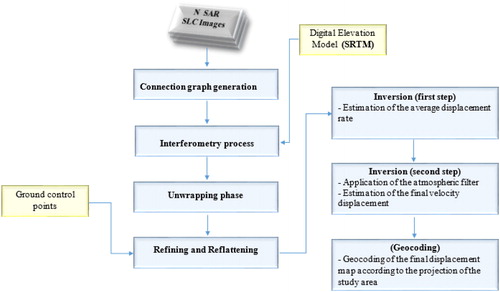
Sentinel 1B sensors were carried out through the SBAS module which is already integrated in the SARscape software package (Loesch and Vasit Sagan 2018). All necessary steps to measure displacement rates affecting the study area are shown in the order below ().
Figure 6. SBAS workflow. Source: Author.
3.2.1. Creation of connection graph
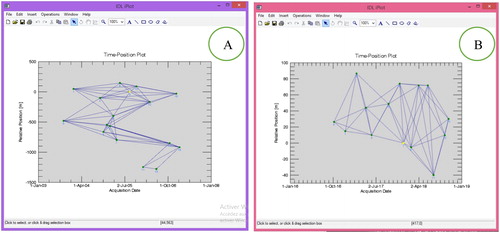
At the beginning of this step, a comparison between the spatial and temporal baselines of the radar images was performed. Subsequently, the programme constructs connections between radar images whose baselines are small enough to be comparable (Diao et al. Citation2018). During this step, pairs of images were created and used later to create interferograms ( SBAS Tutorial 2013; Hu et al. Citation2014). The result is a network of connections, represented by a connection graph (). For this study, a 1000-day time base was used for Envisat ASAR data (2003–2007) and 250 days for Sentinel 1B data (2016–2018). shows the distance between the different images as a function of the acquisition date (time plot). These graphs make it possible to perform a quick visual evaluation of the connections established between the images and the temporal distribution of the data used.
Figure 7. Connection graph showing perpendicular and temporal baselines of SLC pairs relative to the master image: (A) Envisat ASAR (master: 24 May 2005); (B) Sentinel 1B (master: 24 December 2017). Source: Author.
3.2.2. Interferometry process
During this step, each pair of compatible radar images, identified in the previous step, is used to create an interferogram. In addition to the radar images and the connection graph, this step requires the use of a good digital terrain model (Hu Citation2014). In this study, the digital terrain model SRTM 1-arcsecond provided by NASA with a resolution of 30 metres was used. In the first step of ‘co-registration’, the SAR images used in radar interferometry are in Slant Range format, which means that their geometry corresponds to the moment of their capture by the satellite instrument (De Agostini Citation2014; Liosis et al. Citation2018). Indeed, the geometry of the radar image is distorted because it does not represent its actual size. To solve this problem, the images will undergo a geometric correction. In fact, this co-registration process resamples each image with the master image, chosen during the connection graph step, to give them the same geometry ( SBAS Tutorial 2013). During the second step, a stack of interferograms was created, followed by the process of flattening the interferograms according to a DTM or control points with a known elevation. Then a Goldstein adaptive filter was applied into the flattened interferograms to reduce the phase noise (Goldstein and Werner Citation1998). The Delaunay MCF method was selected to unwrap interferograms (Costantini Citation1998; Costantini and Rosen Citation1999; Pepe and Lanari Citation2006). This method is suitable for green and wet areas due to its capacity to connect isolated groups of high coherence pixel (Hu et al. Citation2014; Castellazzi et al. Citation2016). In this context, to get rid signals from low coherence areas, a value of 0.35 is recommended when using the Delaunay method for unwrapping step ( SBAS Tutorial 2013). Indeed, all the areas having a coherence lower than the value of the threshold chosen during this treatment, will be eliminated. The low values can produce particularly noisy areas in the analysis, which decreases the reliability of the results.
3.2.3. Refining and re-flattening
In this step, ground control points (GCP) with reliable altitude values are required at the input for the flattening of the interferograms. These GCP must be placed in flat and supposedly in stable zones, while distributing them homogeneously over the entire interferogram ( SBAS Tutorial 2013; Gama et al. 2017). In the next operation, the software corrects for any inaccuracies affected by the orbital data and reflattens the interferograms to make the phase data more reliable (Zhang et al. 2018). This step is carried out on the basis of the GCP already created during the previous step and the DTM digital terrain model (Loesch and Vasit Sagan 2018). Due to the large number of GCP available for this study, we have chosen the orbital configuration to refine the interferograms ( GCP Manual 2015).
3.2.4. Inversion first step
During this step, the programme uses the interferogram stack created during the ‘interferometry process’ step to calculate the residual topography and displacement time series first estimation as a function of the interferograms (Halldén Citation2017). For the estimation of the variation of the displacement rate, we choose the linear model ( SBAS Tutorial 2013; Loesch and Vasit Sagan 2018). In the same context, the programme also performs a second unwrapping process to improve SAR data for the next step.
3.2.5. Inversion second step
During this step, atmospheric filtering is performed on the interferometric phase to provide a more accurate estimation of the final velocity displacement and ameliorate displacement time series (Gaber et al. Citation2017). Atmospheric signals have been removed through temporal and spatial filtering operations (Ferretti et al. Citation2000 Charef et al., Citation2012). Indeed, the algorithm uses two atmospheric filters, high-pass and low-pass, to correct atmospheric effects and to smooth the temporal signature of the displacement by respecting certain physical properties of the atmosphere (Kim et al. Citation2014; Loesch and Vasit Sagan 2018). The low-pass atmospheric filter eliminates atmospheric effects that are spatially distributed while the high-pass atmospheric filter suppresses atmospheric effects that are temporally distributed. For this study, the default parameters proposed by programme is used.
3.2.6. Geocoding
Geocoding occurs when the different results of the previous steps are transformed from the format (slant range) into geocoded images whose distances will be converted in terms of distance to the ground. These images will have the same pixel size and correspond to the same coordinate system. In this study, the result is a geocoded image according to the UTM (Universal Transverse Mercator) cylindrical map projection Zone 32 N, showing the velocity displacement in the study area, measured in mm/year.
4. Results and discussion
4.1. Tunis City
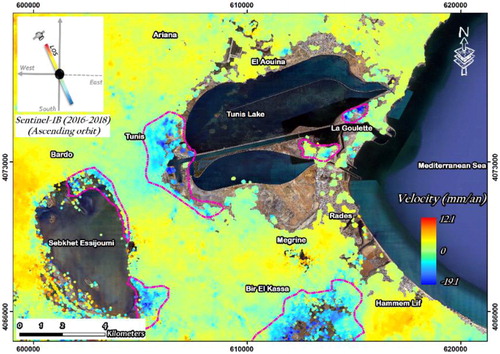
The processing of data acquired from multiple satellite sensors (SAR) in descending and ascending orbits has made it possible to distinguish differential movements affecting several areas in the Tunis City. By visualizing the displacement maps ( and ), we notice that the results obtained by the interferometric method SBAS of the Envisat data (2003–2007) and those of the Sentinel 1B method (2016–2018) generally show a perfect coherence. Indeed, the zones identified by subsidence phenomenon in the first period will continue to move during the second period but with a different velocity. Several areas affected by surface deformations in the Greater Tunis area during both periods, revealed the permanence of the subsidence zones. Surface deformations are identified mainly in the northern and northeastern part of Sebkhet Essijoumi and in the western part of Tunis Lake ( and ). The distribution of measuring points within the study area is not homogeneous. The density of these points is excellent in the city of Tunis and gradually decreases towards the southern and northern parts of the study area which corresponds to the presence of very dense vegetation (high vegetation density) such as rural or agricultural areas and also following the loss of coherence between interferograms in these areas. This analysis of and demonstrates a subsidence affecting the south and north-east of Sebkhet Essijoumi, as well as the western part of Tunis Lake. For Envisat ASAR data (descending orbit), a negative value of LOS velocity (−13.98 mm/year) is observed, and −19 mm/year (Blue) detected for Sentinel 1B (ascending orbit). In the eastern part of Sebkhet Essijoumi, −9.91 mm/year is detected for Envisat ASAR data, and the second analysis of Sentinel 1B indicates a maximum deformation rate of −14 mm/year. For the other areas around the two previous sites, the map of LOS velocity shows a dominance of the yellow-green colour which means that the variation of velocity is weak in these sectors, therefore, they represent the most stable zones. To determine the origin of these differential movements, it is necessary to examine the various parameters such as geological and geotechnical factors and human activities related to recent urban development.
Figure 8. Spatial distribution of surface deformations (LOS) in Tunis City (mm/year) obtained from Envisat SBAS analysis (2003–2007). Source: Author.
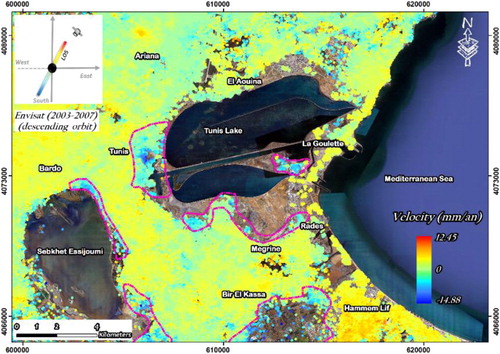
Figure 9. Spatial distribution of surface deformations (LOS) in Tunis City (mm/year) obtained from Sentinel 1B SBAS analysis (2016–2018). Source: Author.
4.1.1. Geotechnical characterization in Tunis City
In order to define the displacement problems that occurred on both sites, we compared the results obtained from the SBAS interferometry method with geotechnical and geological studies performed in the city of Tunis. The results of these various research projects, which are mainly related to the geotechnical characterization of the subsoil.
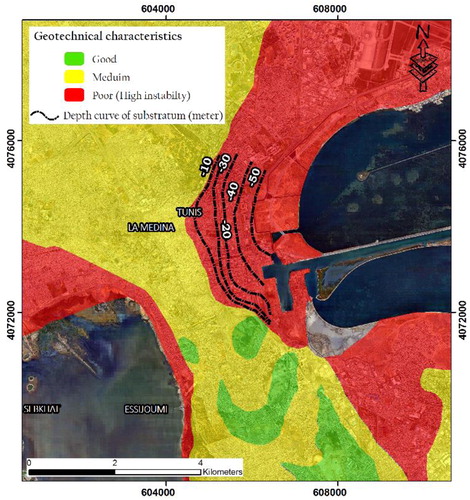
The first geotechnical map in Tunis City was prepared by Guilloux and Nakkouri (Citation1976) (). This study made possible to evaluate and characterize the plain of study area, by showing that it is constituted by quaternary alluvial deposits. Indeed, these sediments are formed of mud, clay and sand. According to this work, these alluviums are considered as compressive soil (Guilloux and Nakkouri Citation1976). The geotechnical map shows the subdivision of Tunis City into three zones based on the properties of the lithological formations, the geological profiles and the geotechnical characteristics. According to the interferometric results, the areas affected by subsidence in Tunis plain (south and north-east of Sebkhet Essijoumi and the western part of Tunis Lake) coincide with the red zone whose the substratum is characterized by a mediocre geotechnical properties ().
Figure 10. Geotechnical map of Tunis City (Source: Guilloux and Nakkouri 1976), modified.
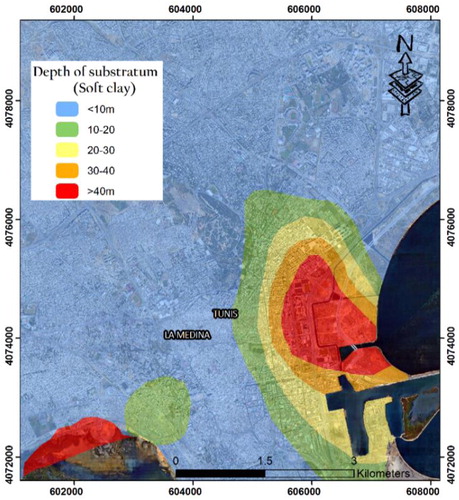
In the same context, the research conducted by Kaaniche (Citation1989) revealed that the sediments of the plain of Tunis City (near Tunis Lake and Sebkhet Essijoumi) have rather poor geotechnical characteristics. The soil and the subsoil of this sector are constituted by embankments, muddy ground and sandy clay complex. This study shows that the deposits of this zone are characterized by the presence of sandy bodies in a deep mud complex whose geometry is in the form of lenses, and it is characterized by tuffy limestones, embankments and complex of sandy clay. The sandy bodies are distributed randomly in the area and they disappear laterally. This disappearance is responsible for the appearance of the differential settlements in the study area (Kaaniche Citation1989). The heterogeneity of the lithology described would have favoured the differential settlement which causes serious geotechnical disturbances in the region by affecting the constructions by serious cracks. A geotechnical map was developed by Kaaniche in the same study area showing the thickness of the muddy soil in unstable areas (). According to the in-situ tests carried out in the laboratory, the mud complex in the plain of Tunis corresponds to a poor geotechnical quality characterized by a weak resistance. The depth of this formation gradually increases towards Tunis Lake from which it can reach 40 metres. This muddy field is characterized by significant settlements.
Figure 11. Spatial distribution of thicknesses of the muddy soil in the region of Tunis (Source: Kaaniche 1989), modified.
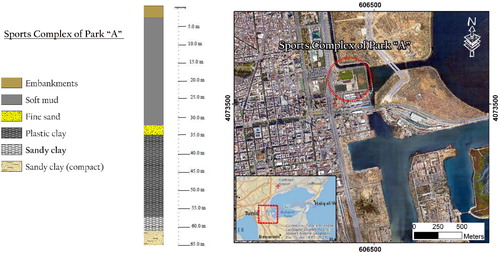
The research work carried out by Klai and Bouassida (Citation2016) also addresses the problems and risks of differential settlements caused by the poor geotechnical quality of the muddy ground in Tunis region. shows the lithology of the soil in Tunis City (Sports Complex Park ‘A’ of Mounir Kebaili). This geotechnical section (reconstituted from core holes) indicates a thin layer of the embankment that overcomes the soft mud of Tunis City whose depth is of the order of 65 m. This type of saturated soil represents a very low permeability, high compressibility and low resistance characteristics. The weak mechanical characteristics of this muddy soil on the first 20 metres (depth) caused differential settlements for several constructions in Tunis. Several degradations of construction works built on the mud of Tunis are due to the bad quality of subsoil. Indeed, this type of compressible soil causes stability problems for the foundations of the structures and can also damage the constructions. For example, the damage caused to the construction of Hotel Africa, which is located in Avenue of Habib Bourguiba, led to the bankruptcy of the two civil engineering companies (These companies were responsible for the construction of this hotel). In fact, the bad choice of the execution technique of the pile foundation is one of the problems associated with pile driving into the muddy soil under the effect of their own weight. Some constructions based on the mud of Tunis City, undergone a geotechnical problems related to excessive settlement.
Figure 12. Lithological column (reconstituted from core holes) located in instable area of Tunis City (Source: Klai and Bouassida 2016, modified).
In fact, shows the settlement of a newly built building (left). The sinking of this construction caused cracks in the old building (right) (Klai and Bouassida Citation2016). Another example of disorder observed in this study area. shows a building located in Tunis City, which began to sink in a compressible ground a few years after its construction.
Figure 13. Example of structural damage identified in downtown Tunis (Klai and Bouassida 2016).
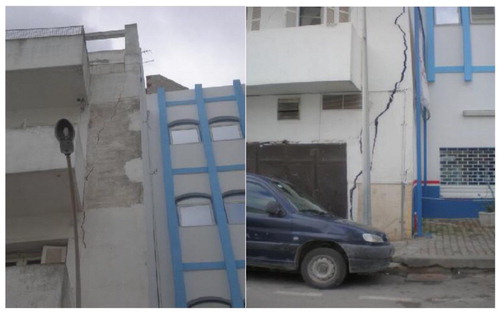
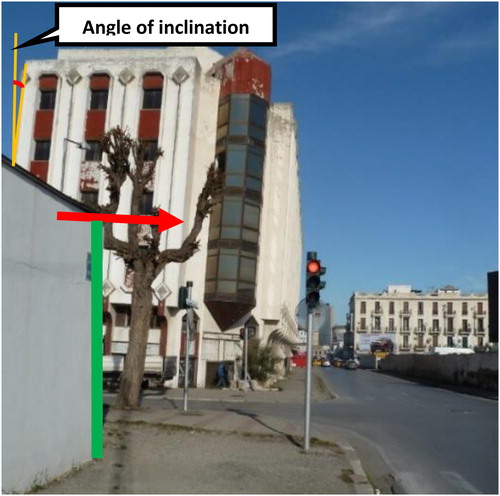
Figure 14. Photo example of a building (currently abandoned) was built in the late 80s, located in front of the old port of Tunis, showing the inclination of this building a few degrees to the East, (Saad Zaghloul Street). Source: Author.
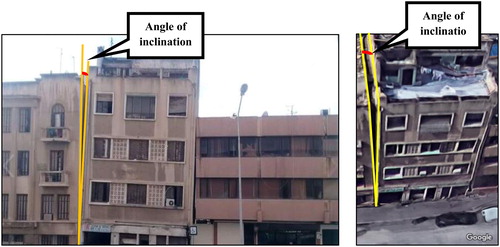
demonstrates an old building located in Avenue Hedi Nouira, showing the inclination of this building a few degrees due to the instability of the ground. The results achieved from research carried out in Tunis City and from field observations have revealed the existence of differential movements that have been validated by the SBAS interferometric method. The joint exploitation of the Envisat (2003–2007) and Sentinel 1B (2016/2018) datasets, geological and geotechnical information, allowed the validation of the spatial distribution of differential settlements in the study area. The settlement phenomena observed coincide with large areas that have relatively thick alluvium in the study area. These compressive deposits have a potential risk to subside progressively due to a compaction and under the effect of various loads related to urbanization, such as artificial embankments and infrastructure. In fact, these differential movements are the origin of the instability of the soil in the region of Tunis and thus cause significant damages to buildings.
Figure 15. Photo example of an old building, located in Avenue Hedi Nouira, showing the inclination of this building a few degrees to the East. Source: Author.
4.2. Mornag plain
The application of the SBAS interferometric technique in this area has made it possible to detect and measure displacements in the alluvial plain of Mornag. Displacement maps show the spatial distribution of surface deformations observed from the two satellites in descending and ascending orbit. The displacements highlighted by Envisat ASAR and Sentinel 1B show a permanence subsidence during both periods. The displacements are measured along the line of the satellite sight. The negative values (cyan to blue) represent movements away from the satellite (ground subsidence), while the positive values (yellow to red) represent the movements towards the satellite (terrestrial uplift) ( and ). Indeed, the green pixels that have velocities between −0.3 and +0.3 mm/year, are considered stable. For Envisat ASAR data, in descending orbit the displacement rate detected a long the LOS direction is −13.98 mm/year (Blue) and −19.4 mm/year (Blue) is observed for Sentinel 1B data in ascending orbit. Despite the low density of measuring points made from the interferometric analysis of the Envisat ASAR (2003–2007), we note that the area affected by negative displacements (subsidence) show a lot of similarity with the results obtained from the Sentinel 1B data (2016–2018).
Figure 16. Spatial distribution of surface deformations (LOS) in Mornag plain (mm/year) obtained from Envisat SBAS analysis (2003–2007). Source: Author.
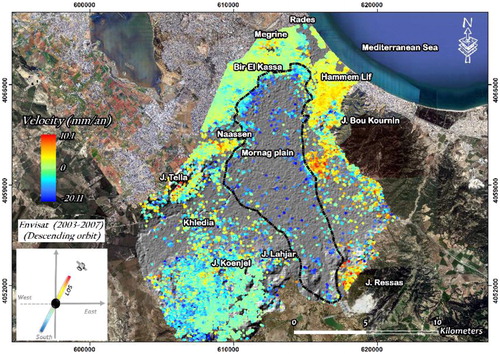
Figure 17. Spatial distribution of surface deformations (LOS) in Mornag plain (mm/year) obtained from Sentinel 1B SBAS analysis (2016–2018). Source: Author.
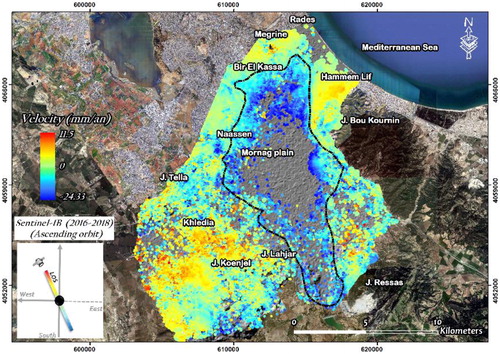
This low density is mainly due to the reduced numbers of radar data and the irregular temporal distribution of the images during the period between 2003 and 2007. Finally, the ground deformation maps produced allowed us to identify a soil subsidence affecting the extended rural areas of about 70 km2 and to measure ground variations in the study area within the observed time interval.
4.2.1. Overexploitation of the water table of Mornag plain
The mitigation of the risks related to overexploitation and the protection of water resources pose complex problems all over the world. Tunisia is one of the most affected Mediterranean countries by water shortage. Mornag plain is also facing serious problems related to the overexploitation of sub-surface water which is linked to the increasingly intensive use of water in sectors such as agriculture, industry and the scarcity of rains resulting from climate change. Indeed, although the climate in this region remain dry with low precipitation, the plain of Mornag is characterized by intensive and extensive rural activities, whose main source of water is the water table which is overexploited from underground wells. Over the last three decades, the increase of irrigated land (12,000 hectares) (Fougeirol et al. Citation2012) related to the development of some crops (), the growth of the deep wells and the decrease in rainfall over several and consecutive droughts years, have resulted in an increase of the groundwater exploitation. This intensive use of water caused a decrease in the piezometric level (), sometimes exceeding 1 m/year in shallow water and deep aquifers located in the centre of Mornag plain (IGIP Citation2011) and as a result an increase in salinity (Lassoued et al. Citation1995).
Figure 18. Irrigated agricultural land in Mornag region. Source: Author.
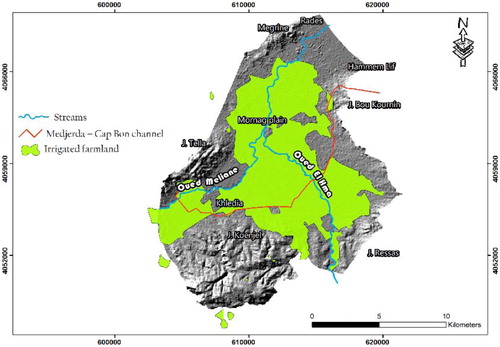
Figure 19. Piezometric level of three wells in Mornag aquifer during the period (1965–2000) (Source: Charef et al. 2012).
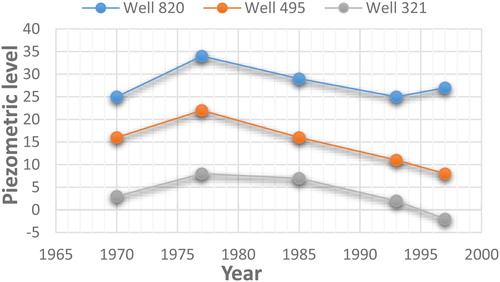
Overexploitation and depletion of groundwater can make the region extremely vulnerable to natural hazards. In sum, Mornag region has overexploited these groundwater reserves to meet the needs of agriculture, industry and the region’s supply of drinking water.
In general, the phenomenon of differential settlement is well known in coastal and agricultural areas where the combined effect of overexploitation of groundwater and the natural consolidation of sediments result in +/− continuous soil subsidence at different scales. The effectiveness of SBAS approaches in the monitoring and mapping of surface deformations has been proven by several researchers, showing that subsidence may be related to overexploitation of aquifers throughout the world. Liu et al. (Citation2017) showed the importance of SBAS technique in the mapping and monitoring surface deformations. Indeed, they used the ALOS data to demonstrate that the subsidence in the city of Cangzhou, is induced by the excessive pumping of groundwater. Tomás et al. (Citation2005) used ERS-1 and 2 radar data to measure the extent of groundwater subsidence in the city of Murcia in Spain. Fruneau et al. (Citation2005) studied the effect of water pumping in the city of Paris (Saint-Lazare station) by comparing piezometric measurements with the results of interferometric analyses.
In this study, due to the unavailability of GPS data and levelling throughout Mornag plain, groundwater piezometric measurements () were used to analyse changes in groundwater level fluctuation over time. The results of this operation make it possible to study the correlation between the variations of the piezometric level of the water table and the ground surface deformations derived from the SBAS method. Groundwater data were provided by the Directorate General of Water Resources of Tunisia (DGRE) who is responsible for monitoring piezometric wells widely distributed in the plain of Mornag.
Figure 20. The distribution of some groundwater monitoring wells for both periods (2003–2007) and (2016–2018). Source: Author.
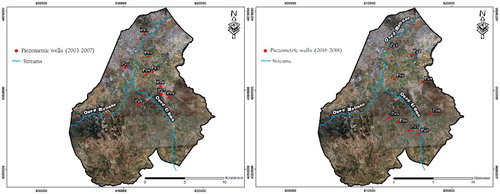
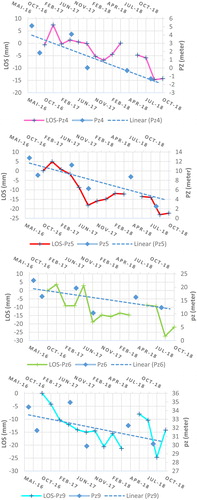
These data were used to establish the piezometric level variation curves. These piezometric measurements carried out monthly during the period 2004–2018 ( and ), correspond to the period of time series of deformations derived from the SBAS method. The evolution of the piezometric level of these wells, shows small seasonal fluctuations but the general tendency of these curves indicates a decrease of several metres during the last 20 years. The comparison of time series deformations and the piezometric measurements recorded at the level of the Pz3 well over the period (2003–2007) (), indicates that the water table level has dropped by about 4 m and the time series for the sample located in the same place reveals the existence of land subsidence of about 2 cm which occurs in compressible alluvial sediments of the plain. In the same context, the well Pz6 indicates that the groundwater level decreased by about 3.9 m in the period (2016–2018) (), and that the time series demonstrates a displacement rate of about 2.3 cm. The temporal evolution of soil deformations, measured by the SBAS method, therefore shows a good correlation with the changes in piezometric level in Mornag alluvial plain. Indeed, from the results achieved from these correlations, we note that the trend of soil subsidence is consistent with the dynamic change in groundwater level. In fact, the level of groundwater was continually decreasing, sometimes showing fluctuations (seasonal change). Soil deformations in Mornag area show a decrease in the topographic surface, but there are some small variations indicating slight uplifts in relation to the increase of the piezometric level.
Figure 21. Evolution of piezometric level at selected wells in Mornag plain (2004–2008). Source: Author.
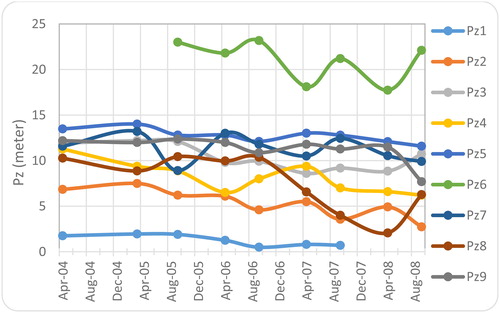
Figure 22. Evolution of piezometric level at selected wells in Mornag plain (2009–2018). Source: Author.
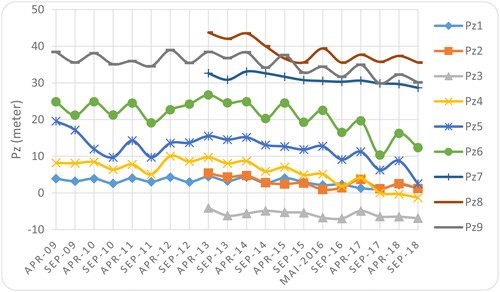
Figure 23. The relationship between deformation time series (LOS) for Envisat SAR data and piezometric levels during (2003–2007) at selected well points (Pz1, Pz2, Pz3, Pz5). Source: Author.
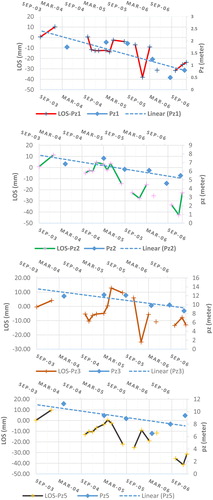
Figure 24. The relationship between deformation time series (LOS) for Sentinel 1B SAR data and piezometric levels during (2016–2018) at selected well points (Pz4, Pz5, Pz6, Pz9). Source: Author.
In addition, the expansion of agricultural and industrial areas in Mornag plain, the decrease in rainfall in recent years and the overexploitation of the aquifer have resulted in a decrease in the level of groundwater. Indeed, the decrease of the piezometric level in a continuous way observed during all this period, caused the differential displacements in Mornag alluvial plain.
As a result, the fluctuation of the groundwater level poses geotechnical problems resulting from the modification of the physical and mechanical properties of the soil up to the subsidence of the soil. The alluvial deposits in Mornag plain consists mainly of clays intermixed with sand and silts and coarser materials. They are widely present in the study area. These clay units are distinguished by high compressibility, thus representing an important role in the process of subsidence caused by groundwater extraction and the phenomenon of consolidation.
According to Terzaghi (1923), the phenomenon of consolidation is the result of the reduction of the water content of a saturated soil and provides that air does not replace water.The static charges exerted on the ground in the long term, induce the elimination of the interstitial water and thus it causes a settlement. This consolidation process mainly affects saturated clays because of their low permeabilities.
In fact, settlements caused by external loads are considered a primary consolidation process (Terzaghi 1923; Polcari et al. Citation2014). The viscous behaviour of very fine-grained soils is considered to be one of the main factors responsible of the settlements resulting from the consolidation process. Generally, the time required to complete the primary consolidation process depends mainly on the thickness and compressibility of the loaded soils as well as the hydraulic conductivity (Terzaghi and Peck 1967; Cascini et al. Citation2007; Polcari et al. Citation2014). In our case, the lithology consists mainly of fine-grained sediments (clay-sands-silts). The thickness of the compressible layer varies depending on its location in the alluvial plain (). In particular, ground settlement is more likely to occur in the centre of the plain where the thickness of the compressible deposits is deep ( and ). The settlement phenomenon observed in coincides with the alluvial deposits filled in the centre of Mornag plain. In fact, it can be seen that the increase of the rate of deformation is related to the variability of the thickness of plio-quaternary alluvial deposits.
Figure 25. Cross-section profile of Mornag plain showing the geometry of the compressible layers and the structure of this area (‘Source: Gestion des ressources en eau en Tunisie: bilan et perspectives d’avenir’), modified.
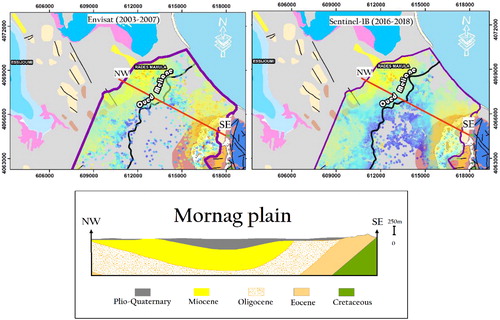
Figure 26. Topographic variations recorded by the permanent station associated to the SBAS time series of surface deformations (LOS) during the period (2003–2018). Source: Author.
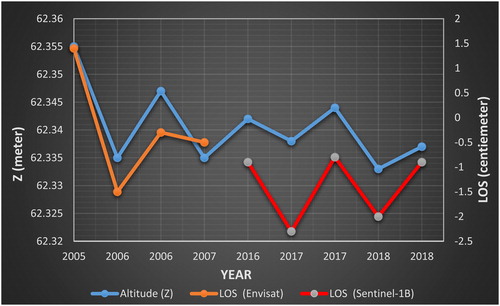
Finally, in order to validate the movements detected in the two sectors of Tunis City and Mornag plain, we combined the experimental data recorded by the permanent station of the Office of Topography and Cadastre (OTC) located in Charguia (Tunis), and deformation time series (LOS) calculated using SBAS method during the period (2003–2018). The Comparison of the curves (), shows a similarity and harmony between land surface deformation (along the LOS) obtained from the Envisat ASAR and Sentinel 1B SAR data and the surface measurements of the GPS data. Indeed, this comparison demonstrates the presence of a slight drop in the topographic surface over time up to 2 cm registered in the permanent station. There are also some seasonal changes during this period. Finally, this comparison allows us to validate the results obtained from the SBAS method in the study area. Knowing that the mobility of the permanent station can be explained by a depression of the building where this station is installed. Indeed, it is built on an old marshy area also corresponding to a compressible soil.
5. Conclusion
The aim of this work was to monitor the deformation phenomena occurring in the Greater Tunis area, using the Envisat (2003–2007) and Sentinel 1B (2016–2018) SAR data. In this study, the SBAS technique was exploited to detect surface displacements. This multi-temporal approach has emerged as an effective methodology for monitoring soil displacements with multi-millimetre accuracy.
Through the analysis carried out by SBAS technique, we have been able to detect the existence of a differential settlement phenomenon in the urban areas (Tunis City) as well as in the rural areas (Mornag plain). The Analysis of SAR images in ascending and descending orbit during both periods in the Greater Tunis area revealed the permanence of the subsidence areas. The SBAS approach has also achieved a high density of measurement points, indicating the ability of this technique to effectively study surface displacements, even in semi-rural areas such as Mornag plain. The DinSAR technique that we have applied for subsidence monitoring in urban and semi-rural areas represents the first step of this work.
The second step of interpretation of these results requires an analytical study these results requires an analytical study, followed by quantitative comparisons between the results on the zones affected by deformation, to see if these displacements are caused by natural (tectonic) or anthropogenic factors.
In this context, through a comparative analysis between SAR data and geological and hydrogeological information, we have been able to explore some of the links between soil subsidence and its main control factors. In particular, a differential settlement was detected in the first site around the region of Tunis Lake, which is probably due to the nature of the highly compressible and thickness alluvial sediments and whose substratum depth sometimes reaches more than 60 m. These compressive deposits have a potential risk to subside progressively due to compaction and under the effect of various loads related to urbanization, such as artificial embankments and infrastructure. For the period of (2003–2007), SBAS technique retrieved values demonstrate maximum subsidence velocities of −13.98 mm/year, and −19 mm/year for the period of (2016–2018). These differential movements are the origin of the instability of the soil in the Tunis region and thus cause numerous failures to buildings. In the second site, ground subsidence was detected in the whole plain of Mornag. Indeed, the analysis of piezometric data and time series deformations revealed that the trend of soil subsidence is consistent with the dynamic change in groundwater level. The results of the analysis show a decrease in the piezometric level, sometimes exceeding 3 m/year. This overexploitation of groundwater is mainly caused by the expansion of agricultural and industrial activities and the decrease in rainfall in recent years (from 2003 to 2018). The good correlation between results derived from SBAS and piezeometric level confirms that depletion of groundwater associated with the consolidation of alluvial sediments are the main driving mechanism of these deformations over the plain. Finally, we recommend this technique for monitoring subsidence in both urban and peri-urban areas as long as the vegetation allows it. We also recommend using the DinSAR method to establish risk maps in urban areas, which saves valuable time and money. Indeed, the establishment of movement maps through this method makes it possible to overcome the difficulties of multiplying the number of boreholes and the expensive geotechnical tests. In Tunisia, the extension programme for urban areas on the margins of wetlands poses stability problems. The use of interferometry is a very valuable decision support tool. As part of the geotechnical zonation of Greater Tunis, it would also be interesting to apply interferometry to highlight the archaeological sites of Carthage.
Acknowledgements
This Project was funded by the Deanship of Scientific Research (DSR), King Abdulaziz University, Jeddah, under Grant No. (DF-769-155-1441). The authors, therefore, gratefully acknowledge DSR technical and financial support.
Disclosure statement
No potential conflict of interest was reported by the authors.
References
- Ambraseys NN. 1962. The seismicity of Tunis. Ann Geophys 15(2–3):233–244.
- Berardino P, Fornaro G, Lanari R, Sansosti E. 2002. A new algorithm for surface deformation monitoring based on small baseline differential SAR interferograms. IEEE Trans Geosci Remote Sens. 40(11):2375–2383.
- Calamita G, Serlenga V, Stabile TA, Gallipoli MR, Bellanova J, Bonano M, Casu F, Vignola L, Piscitelli S, Perrone A. 2019. An integrated geophysical approach for urban underground characterization: the Avigliano town (southern Italy) case study. Geomat Nat Hazards Risk. 10(1):412–432.
- Carnec C, King C, Raucoules D, Guise Y, Paquette Y. 2001. Monitoring of residual movements on mining sites using radar interferometry: perspectives and applications. SIM Environ. 14:21–23.
- Cascini L, Ferlisi S, Fornaro G, Lanari R, Peduto D, Zeni G. 2006. Subsidence monitoring in Sarno urban area via multi-temporal DInSAR technique. Int J Remote Sens. 27(8):1709–1716.
- Cascini L, Ferlisi S, Fornaro G, Peduto D, Manunta M. 2007. Analysis of a subsidence phenomenon via DInSAR data and geotechnical criteria. Riv Ital Geotecn. 4(7):51–59.
- Castellazzi P, Arroyo-Domínguez N, Martel R, Calderhead AI, Normand JCL, Gárfias J, Rivera A. 2016. Land subsidence in major cities of Central Mexico: interpreting InSAR-derived land subsidence mapping with hydrogeological data. Int J Appl Earth Obs Geoinf. 47:102–111.
- Casu F. 2009. The small baseline subset technique performance: assessment and new developments for surface deformation analysis of very extended areas [PhD thesis]. Cagliari: University of Cagliari.
- Charef A, Ayed L, Azzouzi R. 2012. Impact of natural and human processes on the hydrochemical evolution of overexploited coastal groundwater: Case study of the Mornag aquifer refill (South-East Tunis, Tunisia). Geochemistry. 72(1):61–69. doi:10.1016/j.chemer.2011.11.005.
- Costantini M. 1998. A novel phase unwrapping method based on network programming. IEEE Trans Geosci Remote Sens. 36(3):813–821.
- Costantini M, Rosen PA. 1999. A generalized phase unwrapping approach for sparse data. IEEE 1999 International Geoscience and Remote Sensing Symposium (IGARSS’99, Cat. No.99CH36293); June 28–July 2; Hamburg, Germany.
- De Agostini A. 2014. The characterization of landslides at different scales using radar interferometry [PhD thesis]. Padova: Università degli studi di padova; p. 156.
- Deffontaines B, Fruneau B, Prunier-Leparmentier AM, Pajot E, Rudant JP, Arnaud A. 2004. Urban instability revealed by DINSAR and PS interferometry: the Montmartre case example (Paris, France). Proceedings of the 2004 Envisat & ERS Symposium; Sep 6–10; Salzburg, Austria 2004; ESA SP-572, April 2005.
- Deffontaines B, Chang KJ, Champenois J, Fruneau B, Pathier E, Hu JC, Lu ST, Liu YC. 2016. Active interseismic shallow deformation of the Pingting terraces (Longitudinal Valley – Eastern Taiwan) from UAV high-resolution topographic data combined with InSAR time series. Geomat Nat Haz Risk. 8(1):120–136.
- Deffontaines B, Chang KJ, Champenois J, Lin KC, Lee CT, Chen RF, Hu JC, Fruneau B. 2017. Active tectonics of the onshore Hengchun Fault using UAS DSM combined with ALOS PS-InSAR time series (Southern Taiwan). Nat Hazards Earth Syst Sci. 18(3):829–845.
- Deffontaines B, Chang KJ, Champenois J, Lin KC, Lee CT, Chen RF, Hu JC, Magalhaes S. 2018. Active tectonics of the onshore Hengchun Fault using UAS DSM combined with ALOS PS-InSAR time series (Southern Taiwan). Nat Hazards Earth Syst Sci. 18(3):829–845.
- Diao XP, Bai ZH, Wu K, Zhou DW, Li ZL. 2018. Assessment of mining-induced damage to structures using InSAR time series analysis: a case study of Jiulong Mine. China Environ Earth Sci. 77:166.
- El May M, Dlala M, Chenini I. 2010. Urban geological mapping: geotechnical data analysis for rational development planning. Eng Geol. 116(1–2):129–138.
- Ennabli M. 1977. A Mathematical model for studying aquifers of the North-eastern Tunisia. LHM/DR 77/17. Ec. Nat. Sup. des Mines, Paris.
- Ennabli M. 1980. Hydrogeological study of aquifers in the North East of Tunisia for the integrated management of water resources [PhD thesis]. University of Nice, Nice, France
- Farhat B. 2011. Characterization of the geometry of the Moi - Plio - Quaternary aquifers of Mornag plain (NE Tunisia) by geophysical methods. Hydrochemistry and modeling of potential recharge PhD thesis]. Tunis: Faculty of Sciences of Tunis, University of Tunis El Manar, Tunisia.
- Ferchichih, Farhat B., Ben Hamouda MF., Ben Mammou A. 2017. Understanding groundwater Chemistry in Mediterranean Semi- Arid System Using Multivariate statistics Techniques and GIS Methods: case of Manouba Aquifer (Northeasterntunisia). Arabian Journal of Geosciences. 10(530).10.1007/s12517-017-3314-4
- Ferretti A, Prati C, Rocca F. 2000. Nonlinear subsidence rate estimation using permanent scatterers in differential SAR interferometry. IEEE Trans Geosci Remote Sens. 38(5):2202–2212.
- Ferretti A, Savio G, Barzaghi R, Borghi A, Musazzi S, Novali F, Prati C, Rocca F. 2007. Submillimeter accuracy of InSAR time series: experimental validation. IEEE Trans Geosci Remote Sens. 45(5):1142–1153.
- Fielding EJ, Blom RG, Goldstein RM. 1998. Rapid subsidence over oil fields measured by SAR interferometry. Geophys Res Lett. 25(17):3215–3218.
- Fougeirol D, Jarraya-Horriche F, Vollmer KR. 2012. Artificial recharge of Mornag aquifer (Tunisia) with reclaimed wastewater for irrigation purposes. Proceedings of the Conference on Integrated Resources Management; Nov 21–22; Fnunhofer Verlag, Karlsruhe, Germany; p. 227–233.
- Fruneau B, Deffontaines B, Rudant JP, Le Parmentier AM. 2005. Monitoring vertical deformation due to water pumping in the city of Paris (France) with differential interferometry. Comptes Rendus Geosci. 337(13):1173–1183.
- Gaber A, Darwish N, Koch M. 2017. Minimizing the residual topography effect on interferograms to improve DInSAR results: estimating land subsidence in Port-Said City, Egypt. Remote Sens. 9(7):752.
- Galloway D, Jones DR, Ingebritsen SE, editors. 1999. Land subsidence in the United States. Circular Series No. 1182. Reston, VA: U.S. Geological Survey.
- Gama FF, Alessio Cantoneb A, Muraa JC, Pasqualib P, Paradellaa WR, dos Santosa AR, Silvaa GG. 2017. Monitoring subsidence of open pit iron mines at Carajás Province based on SBAS interferometric technique using TerraSAR-X data. Remote Sens Appl Soc Environ. 8:199–211.
- Goldstein RM, Werner CL. 1998. Radar interferogram filtering for geophysical applications. Geophys Res Lett. 25(21):4035–4038.
- Guilloux A, Nakkouri A. 1976. Contribution to geotechnical study of soil in Tunis. Tunis Rev Equip. 16:58–68.
- Halldén T. 2017. Measuring coastal erosion along the coast of Ystad municipality using PSInSAR and SBAS [master’s thesis]. Stockholm: University of Stockholm; p. 88.
- Hu B. 2014. Monitoring of ground deformation due to excessive withdrawal of natural gas using SBAS. Math Probl Eng. 2014(4):1–6.
- Hu B, Wang HS, Sun YL, Hou JG, Liang J. 2014. Long-term land subsidence monitoring of Beijing (China) using the small baseline subset (SBAS) technique. Remote Sens. 6(5):3648–3661.
- Hu RL, Yue ZQ, Wang LC, Wang SJ. 2004. Review on current status and challenging issues of land subsidence in China. Eng Geol. 76(1–2):65–77.
- IGIP. 2011. Integrated water resources management project for irrigated areas in Mornag. Environmental impact study of artificial recharge of Mornag aquifer using treated wastewater. Phase l. Ministry of Agriculture and Hydraulic Resources, Tunisia, 316 p. Ct 16 annexes.
- Jarraya-Horriche F. 2004. Contribution to the analysis and rationalization of piezometric networks[PhD thesis]. Tunis: The National Engineering School of Tunis; p. 254.
- Kaaniche A. 1989. Design and implementation of a geological database (Tunis-Data-Bank) oriented geotechnical mapping automatically (Tunis-Geo-Map). Application to the City of Tunis [PhD thesis]. Lyon: National Institute of Applied Science.
- Kacem J. 2004. Seismotectonic study and assessment of the regional seismic hazard of the North - East of Tunis: Contribution of the seismic reflection in the identification of seismogenic sources [PhD thesis]. Tunis: Faculty of Sciences, University of Tunis El Manar; p. 200.
- Kim JR, Lin SY, Hong S, Choi YS, Yun HW. 2014. Ground deformation tracking over Mt. Baekdu: a pre-evaluation of possible magma recharge by D-InSAR analysis. KSCE J Civ Eng. 18(5):1505–1510.
- Klai M, Bouassida M. 2016. Study of the behavior of Tunis soft clay. Springer International Publishing.
- Lassoued B, Labbene H, Gouider N. 1995. Note on the operation of Mornag aquifer system. Tunis: DGRE.
- Liosis N, Marpu PR, Pavlopoulos K, Ouarda TBMJ. 2018. Ground subsidence monitoring with SAR interferometry techniques in the rural area of Al Wagan, UAE. Remote Sens Environ. 216:276–288.
- Liu X, Wang Y, Yan S. 2017. Ground deformation associated with exploitation of deep groundwater in Cangzhou City measured by multi-sensor synthetic aperture radar images. Environ Earth Sci. 76(1):1–12.
- Loesch E, Vasit Sagan V. 2018. SBAS analysis of induced ground surface deformation from wastewater injection in East Central Oklahoma, USA. Remote Sens. 10(2):283.
- Mansour AR, Baliki MN, Huang L, Torbey S, Herrmann KM, Schnitzer TJ, Apkarian AV. 2013. Brain white matter structural properties predict transition to chronic pain. Pain. 154(10):2160–2168.
- Mellouli M. 1984. Safeguarding project of the hill of Sidi Bou Said (Cap Carthage - northern Tunisia), Geological contribution to the study of terrain movements [PhD thesis]. Marseille: Univ. Aix Marseille; p. 92.
- Pepe A, Lanari R. 2006. On the extension of the minimum cost flow algorithm for phase unwrapping of multitemporal differential SAR interferograms. IEEE Trans Geosci Remote Sens. 44(9):2374–2383.
- Polcari M, Albano M, Saroli M, Tolomei C, Lancia M, Moro M, Stramondo S. 2014. Subsidence detected by multi-pass differential SAR interferometry in the Cassino Plain (Central Italy): joint effect of geological and anthropogenic factors? Remote Sens. 6(10):9676–9690.
- Qiu Z, Jiang T, Zhou L, Wang C, Luzia G. 2019. Study of subsidence monitoring in Nanjing City with small-baseline InSAR approach. Geomat Nat Haz Risk. 10(1):1412–1424.
- Rosen PA, Hensley S, Joughin IR, Li FK, Madsen SN, Rodriguez E, Goldstein RM. 2000. Synthetic aperture radar interferometry. Proc IEEE. 88(3):333–382.
- GCP Manual, 2015. Sarmap SA, Switzerland, 2015; p. 27. Available online: http://www.sarmap.ch/tutorials/GCP_Manual.pdf
- SBAS Tutorial.Version 2, 2013. Sarmap SA, Switzerland, 2013; p. 92. Available online: http://www.sarmap.ch/tutorials/sbas_tutorial_V_2_0.pdf.
- Terzaghi K. 1923. Calculation of the Coefficient of Clay from the Course of the Observed Hydrodynamic Stress Phenomena. Akademie der Wissenschaften, Vienna; p. 125–138.
- Terzaghi K, Peck RB. 1967. Soil mechanics in engineering practice. Hoboken (NJ): John Wiley & Sons.
- Tomás R, Márquez Y, Lopez-Sanchez JM, Delgado J, Blanco P, Mallorqui JJ, Martinez M, Herrera G, Mulas J. 2005. Mapping ground subsidence induced by aquifer overexploitation using advanced Differential SAR Interferometry: Vega Media of the Segura River (SE Spain) case study. Remote Sens Environ. 98(2–3):269–283.
- Vicari A, Famiglietti NA, Colangelo G, Cecere G. 2019. A comparison of multi temporal interferometry techniques for landslide susceptibility assessment in urban area: an example on Stagliano (MT), a town of Southern of Italy. Geomat Nat Haz Risk. 10(1):836–852.
- Vogt J. 1993. Further research on the historical seismicity of Tunisia. Terra Nova 5:475–476.
- Zhang L, Liao M, Balz T, Shi X, Jiang Y. 2014. Monitoring landslide activities in the three gorges area with multi-frequency satellite SAR data sets. In: Scaioni M, editor. Modern technologies for landslide investigation and prediction. Berlin: Springer; p. 181–208.
- Zhang Y, Meng XM, Jordan C, Novellino A, Dijkstra T, Chen G. 2018. Investigating slow-moving landslides in the Zhouqu region of China using InSAR time series. Landslides. 15(7):1299–1217.