
 ?Mathematical formulae have been encoded as MathML and are displayed in this HTML version using MathJax in order to improve their display. Uncheck the box to turn MathJax off. This feature requires Javascript. Click on a formula to zoom.
Abstract
Along with the development of computer science and communication techniques, tunnel monitoring has been digital and intellectualized gradually. In recent years, traditional tunnel monitoring systems have been becoming powerless to deal with huge amounts of data as the number of tunnels and monitoring sensors surge. In this study, an innovative and comprehensive intelligent tunnel monitoring system was designed based on micro-service architecture. Various function modules were distributed to multiple service instances to get the computing pressure decentralized. The system offered powerful massive data processing support, flexibility, and extensibility. For a certain tunnel, the system could acquire the monitoring data in real-time using wireless sensors deployed on its surface. When data reached the early warning threshold, the system would immediately transmit the warning message to users. Besides, an app was developed to offer support for wireless communication between the monitoring apparatus and watchers. The application of the Anping case, one of the monitoring targets, proved the high efficiency of data transmitting and effective emergency response of the developed system. The results indicated that the microservice architecture could facilitate algorithm development, decentralize calculation pressure, and promote the service capacity by decoupling components and distributing loads.
1. Introduction
The geological structure of the tunnel is always complex, and disasters are serious in the meantime, so there are many hidden risks (Cao et al. Citation2018; Zhu et al. Citation2020). With the constant construction of tunnel traffic infrastructure, tunnel accidents have occurred frequently in recent years with huge damage to the lives and properties (Gong et al. Citation2016; Hu et al. Citation2020; Koch et al. Citation2017; Liu et al. Citation2018). Especially, the tunnel collapse imposes much severe adverse influence on engineering security and economical construction (Zhang et al. Citation2014; Wang et al. Citation2017; Huang et al. Citation2020) . Due to the harsh environment, it is of great importance to strengthen the monitoring, early warning, and prevention of tunnel accidents, taking full advantage of modern communication techniques and methods (Yin et al. Citation2017; Dickmann Citation2020; Chen et al. Citation2019). Thus, comprehensive disaster control, forecasting, and early warning performance should be boosted.
Traditional tunnel monitoring shows relatively poor performance for the forecasting and early warning of tunnel accidents since it mainly relies on hands. Monitoring personnel must manually complete the whole task, including data acquiring and recording, through equipment like extensometer, total station, taseometer and so on, at the tunnel site. This method has a low cost but with a more cumbersome process and higher security risk, which makes it difficult to build a real-time emergency response. Moreover, human errors are inevitable in the data acquisition and recording process. In the last few decades, the rapid development of modern technology has offered a technical basis for the new generation of tunnel monitoring methods. Many new algorithms have been developed to identify the potential risk areas and analyze the variation of structural characteristics. For the monitoring and early warning of the complex underground working area, Chen proposed a smart safety monitoring system based on improved DV-Hop localization algorithm for randomly deployed wireless sensor networks (WSNs), which can position accurate personal tracking in tunnel engineering and underground engineering (Chen et al. Citation2020). In the Jinchuan No. 2 Mine, Jiang applied 3 D laser scanner technology and processing algorithm for point cloud data to monitor the temporal evolution of the 3 D deformation of a deep tunnel (Jiang et al. Citation2020). Li developed an approach integrating the continuum modeling and micro-seismic (MS) monitoring data to quantitatively predict the structurally controlled displacements in bedded rock masses surrounding large-scale underground caverns(A. Li et al. Citation2020). Di used a pilot Distributed Fiber-Optic Sensing (DFOS) system using Brillouin scattering to instrument 8 tunnel sections (Di Murro et al. Citation2019; Wang et al. Citation2020).
The tunnel monitoring is becoming more accurate and faster utilizing advanced instruments and powerful algorithms. However, if tunnel monitoring is to be truly efficient, these devices and algorithms are supposed to be integrated into a unified and coordinated system and work automatically. Due to the harsh environment in the tunnel, web service based on the internet becomes an optimal carrier of the data interchange and transmission due to its flexibility and high efficiency. Over the years, many scholars have done a lot of research on the Internet-based tunnel web monitoring system (Ranaweera et al. Citation2013; Zhai et al. Citation2016; Bossi et al. Citation2017; Liu et al. Citation2020). Wei proposed a novel web-based visualization platform to help TBM operators efficiently manage, process and visualize the TBM parameters (Wei et al. Citation2019; Zhang et al. Citation2020). Sun proposed a design scheme for a tunnel monitoring and measuring system with laser scanning as the main sensor for tunnel environmental disease and deformation analysis(Sun et al. Citation2020; Zhang et al. Citation2020; Wang et al.Citation2020). Therefore, a 24-hour automatic monitoring mechanism could be built through the wireless communication based on the internet, which enabled the decision-makers to manage the instruments and to publish early warning information in a convenient and low-cost way.
Currently, the amount of monitoring data grows explosively as a lot of sophisticated sensors are applied to tunnel monitoring. Meanwhile, the number of tunnels monitored also grows rapidly. The vast quantity of data and more complex algorithms bring tunnel monitoring web systems a new challenge because the existing architecture of tunnel monitoring web systems could not deal with the huge computation smoothly. For existing researches, improvements are mainly made to expand the functionalities upon the tunnel monitoring system such as adding new monitoring sensors or integrating new algorithms regardless of improving its data processing capability and maintenance(Song et al. Citation2019; Tao et al. Citation2019; Y. Li et al. Citation2020; Shan and Lai Citation2020; Feng et al. Citation2020). However, there are hardly any studies on overall-architecture optimization of internet-based tunnel monitoring systems.
Web applications have been developed mainly based on two modes so far: B/S (Browser/Server) and C/S(Client/Server). The development of the backend server is always the heart of both modes. Therefore, the research on productive and effective server-architecture deserves a lot more attention. Until now, the related investigation has experienced the process of 3-tier architecture, service-oriented architecture, and micro-service architecture.
3-tier architecture was the first architecture bringing web application high-quality productivity. As shown in -tier architecture mainly consists of three layers: data access layer, business logic layer and user interface layer. Also note that the layers here are logical, not physical. 3-tier architecture always has only one database and all the data access logic is encapsulated in the data access layer. Similarly, all the business logic is encapsulated in business logic layer too. In this layer, a special class named Controller has the responsibility of managing the execution of the business logic. The request from user enters the system through user interface layer firstly. Then, Controller will call the corresponding business logic when it accepts the request and return the response to the user interface after the processing completes (He and Chen Citation2010). In this way, the operation of request and response gets decoupled thereby improving the reusability and cooperativity of the code.
However, with the rapid growth of the volume of business and data, 3-tier architecture presents poor performance owing to two main factors. One is that all the services operate in the same memory thus the system would run slowly if the business volume were more than it could afford. 3-tier architecture system has to be deployed on a single server, which seriously limits its extensibility. The other is that the heavy amount of code has a negative influence on the maintenance and extensibility of the system. It is difficult to make even a subtle change to the system. The bloat and compatibility problems of codes also push up the maintenance cost. So, it is more suitable for web applications with small business volumes.
The development of 3-tier architecture is based on the objective-oriented principle thus leading to a tightly coupled architecture. To avoid the performance bottleneck of single-server operation and improve flexibility and expandability, service-oriented principle became a relatively ideal solution (Koubâa et al. Citation2019). The architecture developed based on service-oriented principle is referred to as service-oriented architecture (SOA). As shown in , the application will be split into several independent units called “service” according to the business logic, such as data management service, user management service and other services. “service” has high flexibility and reusability since all of them can be developed in different technology stacks, programming languages and deployed ways to implement distributed deployment (Elhoseny et al. Citation2016).
Figure 1. 3-tier architecture.
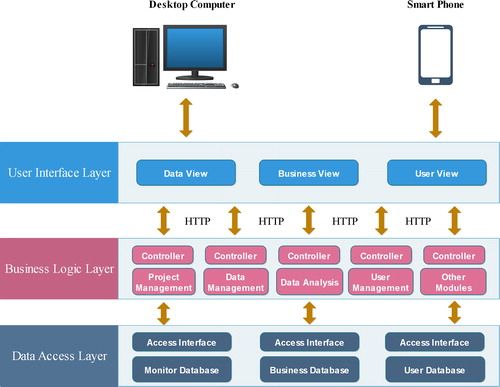
Figure 2. SOA architecture.
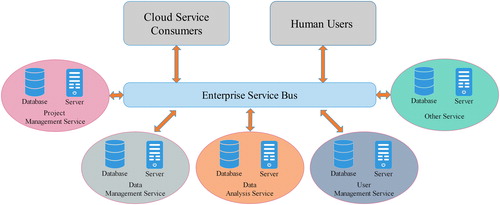
Another important feature of SOA architecture is enterprise service bus (ESB) (Huang et al. Citation2016). ESB is a centralized service responsible for monitoring the message flow between sub-services and controlling their interaction. ESB is more like a pipe and filter to manage the communication between each service based on a uniform communication protocol or interface like Restful API interfaces and JSON protocol.
SOA can overcome the shortcoming of 3-tier architecture to some extent, so SOA is much suitable for large-scale web applications with huge business volume and high-performance requirements (Yoon et al. Citation2019; Wang et al.Citation2019; Jiang et al. Citation2020). However, it also has some drawbacks. Firstly, the lower coupling it gets, the more complexity of development it has. Secondly, the performance of the whole system depends on the efficiency of communication between the sub-modules. Finally, it is hard to avoid single point of failure in SOA architecture due to the presence of enterprise service bus. The whole system would breakdown if ESB malfunctioned.
At present, most of the internet-based tunnel monitoring and early warning systems are based on 3-tier architecture, which hardly fits the requirements of the new generation of comprehensive and intelligent tunnel monitoring. More importantly, flexible, robust designs and detailed architectures for the establishment of tunnel monitoring and early warning systems have been seldom provided.
This study aims to partially fill this gap in the literature. In this study, an innovative and comprehensive tunnel intelligent system was developed based on the micro-service architecture. This system realized the distributed extension, distributed storage, and computing pressure balance by distributing function modules to multiple service instances. These services communicated with each other through a registry center and implemented load balancing through the polling strategy. The applications proved that micro-service architecture provided the web system with massive data processing capability and improved stability and extensibility. Micro-service architecture could fit the trend of increasing tunnel monitoring accuracy well.
More importantly, this system provided a detailed demonstration application of a tunnel monitoring system with the complex and multimode composition including laser cross-section scanners, total stations, a data transmission system, and an app on the mobile phone.
2. Development framework of the system
2.1. The overall design of the system
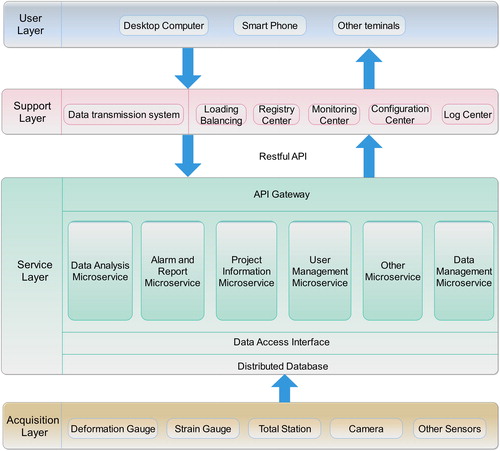
As shown in , the developed system consisted of four layers: acquisition layer, service layer, support layer, and user layer. Firstly, deformation gauge, strain gauge, total station, camera, and other sensors used for acquiring monitoring data would be deployed in the target tunnel. They were referred to as the acquisition layer, responsible for data acquisition. Then, after the data acquisition completed, they would get processed in the service layer. These separated microservices, such as data analysis microservice, alarm and report microservice, and data management microservice together made up the management and analysis component of the system. The key responsibility of the service layer was to manage information of projects, users, instruments, monitoring data, and guide them into the distributed database based on data characteristics. Moreover, the powerful data analysis algorithms including identification and elimination of outliers, data denoising, data interpolation, trend extraction, and regression analysis would run here. Next, the support layer offered necessary support for the normal operation of the system. In this layer, a data transmission system would be used for the transmission of the monitoring data from the inside of the tunnel (no network signal) to the server. Meanwhile, the other components would ensure the security and stability of the service layer. Finally, the layer containing user terminals was referred as the user layer, responsible for the management of the human-system interface and offering a multi-ways presentation.
Figure 3. Architecture of the designed system.
2.2. Acquisition layer
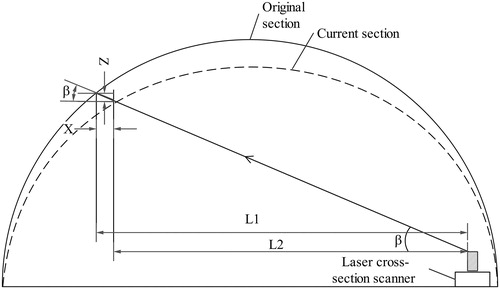
The acquisition layer was mainly responsible for gathering monitoring data from the target tunnel through different kinds of sensors in real-time and transmitting the data to the service layer. The deformation of tunnel surface was a required course in tunnel monitoring and several ways of data acquisition were provided in this system. One was the automatic measurement through the developed wireless sensors such as laser cross-section scanner, taseometer, strainometer, etc. In the monitoring process, a laser cross-section scanner would be deployed in each section. The scanner could obtain the deformation of the target based on the angle skewing between the emitting beam and the reflected beam from the target. Therefore, the real-time outline of such a section could be drawn by setting a sequence of different angles. displays the scene and the working principle of the laser cross-section scanner. The settlement is given by:
(1)
(1)
(2)
(2)
(3)
(3)
where “R1” and “R2” respectively denote the original distance and current distance. “L1” and “L2” denote the corresponding sines. “Z” denotes the vertical deformation of the target and “X” denotes the horizontal deformation of such target. EquationEquation 1-3 could be used to compute the deformation of a single measuring point in vertical and horizontal directions thus monitoring personnel would be allowed to acquire the deformation of the whole section by setting numerous angles. The other is manual measurement. An extra App was developed for monitoring personnel to build a connection with the total station. Total stations are types of electronic equipment that makes it possible to accurately measure slope distances between the location of the stations and a specifically identified geographical point. The total station could offer a high-precision measurement result hence it is much suitable for the deformation measurement of the tunnel due to its reliability and easy operation.
Figure 4. Work principle of laser cross-section scanner.
The collected data would be sent to the service layer through the built-in Data Transfer unit (DTU) and the preset data transmission system. Moreover, users could also control the monitoring devices by sending commands to them through the data transmission system. The devices took a measurement once a day by default. If the accelerating trend of deformation were captured, the acquisition interval could be shortened.
2.3. Service layer
The service layer played a crucial role in the system architecture. As shown in , Based on the previous demand analysis, seven microservices were designed to provide the necessary endorsement for the developed system: data parsing and forwarding microservice, data management microservice, data analysis microservice, alarm and report microservice, project information microservice, user management microservice, and other microservice. The deployment of these services was as shown in . Due to the high read and write activities and the concurrency pressure, data parsing and forwarding, data management, data analysis and prediction, and early warning service were deployed to multiple service instances. Data management microservice was mainly responsible for the creation, update, retrieval, and deletion of the data in the database. The frequent communication with the database brought the server much pressure thus two distributed servers were required to balance computing pressure. Such service was written in Java and ran on Spring boot and linked with the database through a support framework named Mybatis. Data parsing and forwarding microservice, written in C#, was mainly responsible for parsing the received data from the monitoring sensors and broadcasting in the message queue. User management microservice and project information microservice were deployed on a single server because both take up relatively less memory and resource. Data analysis microservice offered multiple analysis algorithms for the monitoring data including identification and elimination of outliers(3σ criterion, chauvenet criterion, dixon criterion, etc.), data denoising(wavelet, EMD, Kalman filtering, etc.), data interpolation(cubic spline), trend extraction, and regression analysis(polynomial regression, SVR, k-nearest neighbors, etc.), etc. Due to the complexity of programming, such service was implemented in Python and ran on flask because Python could greatly facilitate the development of these algorithms. Two servers could help reduce computing pressure and ensure the operation of such service via multiple instances. Similarly, the deployment of alarm and notification microservice followed the same principle. This service would send a warning message to users when the data exceeded the threshold. There are two ways to check the data. Firstly, the service would make a judgment about whether such data triggered the warning when new data got received. Data exceeding the threshold will be sent to the message queue instantly. Secondly, the service would recheck the stored data and computed the change rate at a certain time interval. Here, the data change trend was obtained by calling the data analysis microservice. Besides, other services were set on another server to complement the system. Data transfer service was responsible for dequeuing data from the message queue and calling the corresponding function to process it.
Figure 5. Framework of service layer.
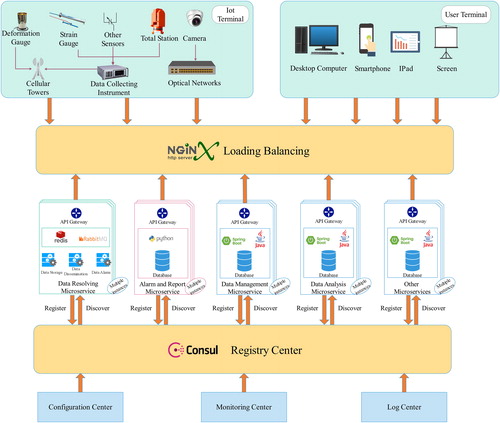
Table 1. Distribution of microservices of the developed system.
The operation of microservices is independent and some essential microservices have multiple service instances. In this way, not only did the system architecture get decoupled and decrease the difficulty of the development, but the stability and security of the system would be improved because the rest of the instances could continue working if one of them malfunctioned.
2.4. Support layer
The support layer provided communication and management support for designed system architecture. The registry center was used to manage all the microservices. All the microservices with their instances would register in the registry center to perceive and recognize mutually between each other. They would constantly send their heartbeat packets, a set of their information including IP and port, to the registry center so that their registration information could get refreshed in a certain frequency and their status change could be captured at once. The register center recorded the real-time working state of every microservice and made it available for all the microservices. This mechanism was called service discovery and realized through consul in this system.
Based on polling strategy, when a request was accepted, the loading balance, built up by Nginx, would assign the request to selected service according to its IP address and the port number recorded in the registry center. This mechanism could check the working status of each microservice instance to distribute the requests to unoccupied instances thereby reducing the computation pressure.
The monitoring center was responsible for monitoring the operation status of the entire system and collecting the log files generated in the log center. If exceptions were thrown, operation personnel would be able to locate the exception the first time. The configuration of the entire system was managed centrally in configuration center. By separating the configuration files from the service itself, the cost of development got significantly reduced. If the online system version required any tiny modification, personnel could just simply modify parameters in the configuration center.
The interaction of request and response must be through API gateway, the only entrance exposed to outside of every microservice. In this way, all the requests targeting such the service could get effective management. Moreover, some necessary protective operations like circuit break, current limiting, could be taken in the gateway to ensure the safety of internal microservice if loading balance and registry center performed out of order.
Moreover, the support layer also included a wireless data transmission system to transmit the monitoring data from inside of the tunnel, usually no internet signal there. A signal conversion station would be set up near the tunnel entrance to convert the wired network or mobile communication network into a radio signal or a bridge signal. Multiple data relay stations would be installed at the corner of the tunnel or a certain distance. The signal conversion station would build up communication with the nearest data relay station, and other data relay stations would communicate with the former data relay station. Through one or more data relay stations, the signal could be introduced into the inner tunnel to make the monitoring areas get network signal coverage. After that, signal access points would be set up nearby. The monitoring and measurement instruments could connect to external networks through signal access points to implement data transmission.
The signal access points adopted two forms of the radio signal and the WIFI signal. The radio signal would use the 840 MHz frequency band. This band had more resistance to interference with the frequency band used by other devices (such as radios that may use the 433 MHz frequency band). At the same time, this frequency could ensure a high communication rate and penetrability. The WIFI signal would use the 2.4 G frequency band, which was compatible with almost all mobile intelligent terminal devices and WIFI data transmission modules. In this way, various intelligent devices with wireless network functions could smoothly access the network.
2.5. User layer
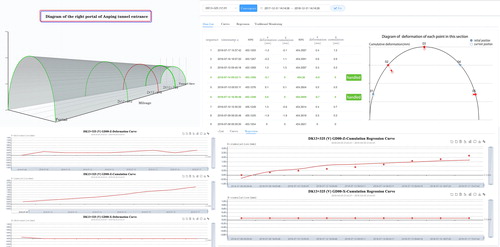
This layer mainly included the interactive interface with the user terminals. The developed system offered two applications of browser application and mobile application. The browser application was implemented in JavaScript, a lightweight, interpreted programming language. Some views are detailed in . The front-end view of browser application was built based on Vue framework in webpack 4.0 environment. Vue is a progressive JavaScript framework with encapsulated common functions, so users just need to focus on the view. For data visualization, Echart.js is an ideal driver to build multiple types of charts.
Figure 6. Interfaces of browser part of the developed tunnel intelligent monitoring and early warning system.
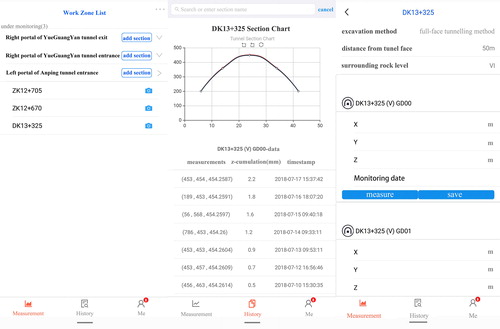
Moreover, mobile applications (APPs) have been becoming the main form of mobile internet service. To view the tunnel status in real-time and facilitate the monitoring, a corresponding app application was developed based on react-active, which allowed application run on IOS and Android devices. Some views are as shown in . The users could use this app to obtain the changing trend of the deformation of the target tunnel and learn about the security status of a tunnel anywhere and anytime. In addition to the common functionality with the browser part, the app was given an extra Bluetooth module for controlling the total station to measure in order to ensure the data acquisition when sensors malfunction. The users could use the app to pair the total station through the Bluetooth module, and then adjust the position of the total station. After that, the users could just click the measure button to get the gauge result when everything was done.
Figure 7. Interfaces of mobile part of the developed tunnel intelligent monitoring and early warning system.
3. Applications
3.1. Overall application
As the rapid growth of the business and data volume, the original system we used was becoming powerless to deal with the heavy network load and even crashed frequently. presents the curves of the growth of data volume and tunnel numbers in monitoring as the time. Before June 2015, we had monitored no more than 5 tunnels simultaneously because of the lack of wireless monitoring technology and high labor costs. Since 24 February 2015, the first version of the tunnel monitoring and early warning system (based on 3-tier architecture) came into use, which allowed a higher data capacity and monitoring efficiency. Therefore, all the tunnels monitored in a manual recorded way in the past could be transferred into a paperless way. After two more years, the volume of monitoring data reached more than 300000. It was conceivable that such an increasing tendency of the data volume and additional auxiliary services would make the current system too bulky to meet the performance requirement. When several analysis algorithms ran concurrently, the system responded slowly resulting in a significant decline of user experience. Besides, with the substitution of auto-measurement for manual-measurement, more and more data would be gained in the future, which required higher efficiency of communication and more efficient ways of data management. More importantly, it is difficult to add new services and modifications to the present system.
Figure 8. The growth of the number of the monitored tunnels and the data volume.
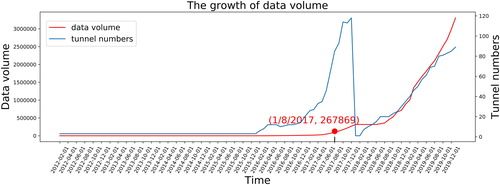
In consideration of the prospective data growth and the high-performance requirements of more complex algorithms in the future, microservice architecture becomes a more competitive solution. In 2017, the system was redesigned based on the microservice architecture, function modules of which was divided into several microservices. One of the most crucial changes the new system brought was the multilingual compatibility support, which allowed varying microservices of the system to be implemented in varying programming languages. Therefore, new services could be easily integrated into the system according to their characteristics in a lowest-cost way thereby facilitating the development of analysis algorithms. At the same time, we began to substitute laser cross-section scanners for manual measurement, which brought tremendous data due to the much more measurement points than before.
In 2018, the updated system officially launched. As shown in , we migrated the previous data and tunnels to the new system. In the meantime, laser cross-section scanners began to be deployed in these tunnels. From January 2018 to the present, the growth of the data has kept at an ultrahigh rate and its amount exceeded 3millon in two years. The microservice architecture provided the whole system with significant support for data storage, data analysis and quick response, etc. More new services were being added to the system such as the gas monitoring, exudation-pressure monitoring and water flow monitoring. Compared with the original architecture, the system was capable of processing huge data and more complex computation. Moreover, it allowed more flexibility on its expandability thus its comprehensive monitoring performance got further improved. In this paper, the real application in Anping Tunnel of the developed system was taken as a concrete example to demonstrate its effectiveness.
3.2. Anping tunnel
3.2.1. Research area
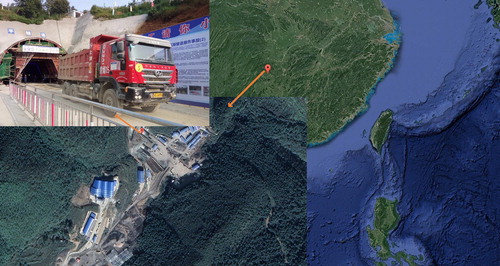
Anping Tunnel is located in Tianchong Village, Anping Town, Loudi City (). The survey site comprises the hilly landform, mountains and erosive surface. The mountain where the tunnel traversed is band-shaped and the maximum elevation of the peak is 534.99 m. The tunnel starts from the northwest slope of Tianchong Village, next to the Changxiao Village Bridge, and ends in the northeast slope of Liziyu Village. The natural gradient of the Longtang portal is about 35° ∼ 45°, and the natural gradient of the Langtang portal is about 40-50°. The ground level of the section where tunnel axis locates is from 419.27 to 534.99 m, with a relative level difference of 115.72 m. The residual slope of the tunnel mountain surface has a small thickness of silty clay or gravel soil, most of the bedrocks are exposed, and the vegetation develops well, mainly including firs, bamboo forests and shrubs. There is no road through the tunnel site, only rural roads lead to villages near the tunnel entrance which leads to the poor traffic conditions.
Figure 9. Location and scene of Anping tunnel.
3.2.2. Proposed monitoring principle
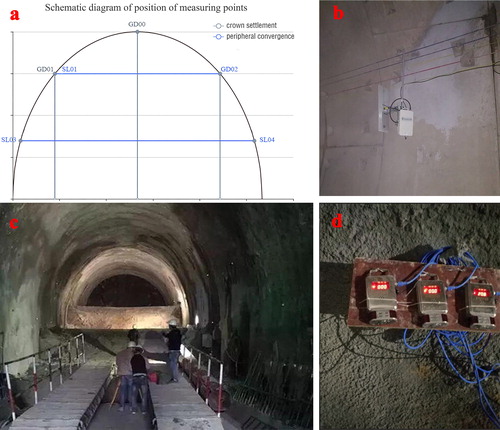
According to Technical Specifications for Construction of Highway Tunnel (JTG F60-2009), combined with the geological data and surrounding rock level of Anping tunnel, tunnel observation, the vault crown settlement measurement, and the peripheral displacement convergence measurement were required in Anping tunnel monitoring. As shown in , laser cross-section scanners, total stations, and a wireless data transmission system were deployed in Anping tunnel. Every two sections are about five meters apart. There are five points monitored in each section (). GD represents vault crown settlement; SL represents peripheral displacement convergence. The data collected by laser cross-section scanners would be sent to the data parsing and forwarding microservice through the data transmission system and the data collected by total stations would be uploaded through the mobile network.
Figure 10. Layout of on-site instruments (a) location of measuring points; (b) wireless data transmission system; (c) total station; (d) laser cross-section scanner.
We set the frequency of data acquisition as shown in . Generally, the measurement would be taken once a day. If abnormal deformation were detected, the system would adjust the measuring frequency based on . In addition, as shown in , three alarm-levels, blue, yellow, red were set up according to the Technical Specifications for Construction of Highway Tunnel (JTG F60-2009) and geological conditions of Anping tunnel to ensure an early warning mechanism and quick disaster response ability. The developed system would call the short message service to send the warning message to the users if the alarm were triggered.
Table 2. Measuring frequency.
Table 3 Early warning threshold for Anping tunnel.
3.2.3. Monitoring results
The construction team used geological radar to predict the geological data of this area, as shown in , the radar moved along the monitoring lines to collect the data and the result. The current location was DK + 645 and the sampling time window was 400 ns and the detection range was 20 m.
Figure 11. Tunnel geological prediction.
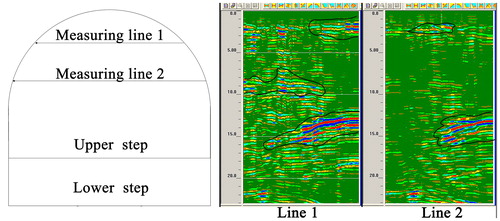
The result of line 1 showed that within the detection range, the local events of the radar electromagnetic wave was relatively continuous. The position of the middle and left side walls (1-3 m, 8-11 m, 12-17 m) in front of the tunnel face presented a strong low-frequency reflected signal. It could be presumed that rock joints and dissolution fissures were more developed, and the rock was relatively broken. There were many muddy materials between the fissures, and there were likely to be dissolution cavities in some areas.
The result of line 2 showed that within the detection range, the position of the middle and right-side walls (1-3 m, 13-17 m) in front of the tunnel face presented a strong low-frequency reflected signal. It could be inferred that rock joints and dissolution fissures were more developed, and the rock was relatively broken. There might be weak fissure water between the fissures and some dissolution cavities locally.
According to the geological data and geological prediction, the area between DK16 + 650 and DK16 + 665 of the tunnel right hole of Anping exit suffers a poor surrounding rock condition thus surveillance in this section should be strengthened.
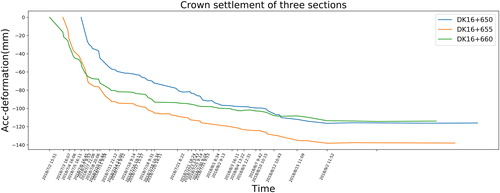
As the excavation approached this area, an abnormal settlement was clearly observed in DK16 + 665, DK16 + 660, DK16 + 655, DK16 + 650 during the period from 25 June 2018 to the end of August. displays the crown settlement data of GD01 of three sections during the period from 30 June 2018 to September 2018. They successively exceeded the designed threshold and continuously increased.
Figure 12. Crown settlement of GD01 of DK16 + 660, DK16 + 655, DK16 + 650.
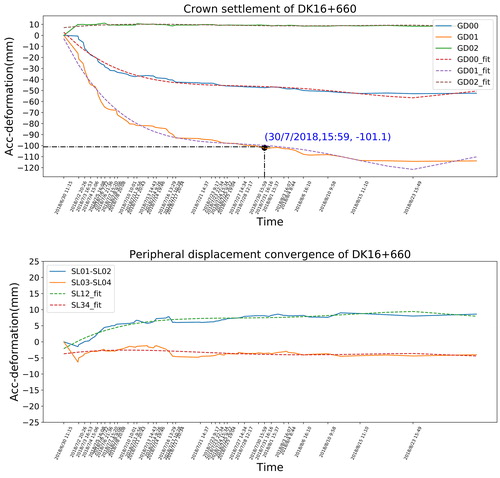
displays the monitoring data of five monitoring points of DK16 + 660. The data of GD00, GD01, GD02 showed a significant decline from 30 June 2018 to the end of August. In particular, the accumulative settlement of GD01 reached 101.1 mm, exceeding the designed maximum displacement value on 15:59, 30 July 2018. At the same time, the peripheral displacement convergence also presented an increasing trend.
Figure 13. Crown settlement and the peripheral displacement of DK16 + 660.
When the abnormal acceleration trend was captured, the developed system sounded the first red alarm about DK16 + 660 on 2 July 2018, DK16 + 655 on 3 July 2018, and DK16 + 650 on 6 July 2018.
The construction team took measures to support the structure of the tunnel at once when the system raised alarm. Grouting is a common method used for providing support for the stability of the tunnel structure. Among them, the leading ductule injection is often used to reinforce the surrounding rock. The construction team took the grouting and leading ductule injection on 4 July, 7 July 2018 of DK16 + 660; 6 July, 9 July, 17 July 2018 of DK16 + 655; 9 July, 22 July 2018 of DK16 + 650.
3.2.4. Analysis
As shown in , it has been observed that of GD01 of DK16 + 660, DK16 + 655, DK16 + 650 displayed large deformation. The mean deformation rate of DK16 + 660, DK16 + 655, DK16 + 650 was 9.2 mm/d, 16.9 mm/d, 11.53 mm/d respectively before taking the first grouting, which demonstrated the poor rock stability of surrounding rock in this area. There were still several accelerated deformation processes after the first grouting, which indicated that single grouting had a limited performance on holding back the distortion. For DK16 + 660, the calculated mean settlement speed of GD01 fell to 5.6 mm/d from 4 July to 5 July. However, from 5 July to 7 July, the calculated mean settlement speed rose to 8.6 mm/d. The construction team then took the second grouting to reinforce the support on 7 July. From 7 July to 17 July, the mean deformation speed declined to 2.22 mm/d. From 17 July to 27 July, the mean deformation speed declined to 0.55 mm/d.
Monitoring personnel did not stop monitoring until September 2018 to confirm the settlement trend. The tiny change of deformation indicated the basic stability of the surrounding rock, which demonstrated that the productivity of previous support measures. It has been proved that the developed system offered an effective real-time warning mechanism and allowed the users to make a quick response in time.
As shown in , the settlement of GD01 was the largest of three crown settlement points and its accumulative settlement has reached 101.1 mm on 30 July 2018. It could be inferred that the area GD01 located in has the worst stability of surrounding rock. The result of geological prediction also demonstrated that there were several zones of broken rock at 2 m, 8 m, 15 m, which proved that the poor bearing capacity of rock in this area. Compared to the crown settlement data, the peripheral displacement convergence showed relatively minor change. Thus, it could be assumed the crown settlement could directly reflect the stress distribution of surrounding rock and it should be considered as the most important tunnel security evaluation index.
Moreover, the imaginary lines represented the regression curves of deformation tendency. After about two weeks of grouting, most of the deformation curves has leveled off at the end of July 2018, which symbolized the stability of surrounding rock has gotten enhanced.
4. Discussion
Micro-service architecture is a development pattern suitable for complex large-scale web applications. The core of micro-service architecture is component, which means that the application could be split into different service components and each component could be developed independently. A general micro-service architecture contains extra components like registry center, loading balancing, monitoring center, API gateway, etc, and they could be deployed on dissimilar servers. Multiple services must be registered in the registry center, and their heartbeat would be monitored persistently. If the registry center received no heartbeat of a certain service instance, this instance would be considered as malfunctioned-instance and the later service requests would be redirected to the other instances. Loading balancing takes charge of the dispatch of all the HTTP requests coming from the terminals based on some predefined strategies. The business interfaces of services are exposed through the API gateway, which means that API gateway is the sole access for communication between such service and exterior modules. So, it could intercept and filter the HTTP requests and the back-end service would not gain extra weight. A service could register several instances in the registry center to ensure the normal operation of the whole system if one of them malfunctioned and then the monitoring center could perform maintenance operations like circuit break and current limiting.
There are several characteristics of micro-service architecture. 1. Loose Coupling. Each part of the application could be developed and deployed independently, thus different microservices could be developed by different development teams, which leads to high development efficiency. 2. High Compatibility. Micro-service architecture allows developers to use different but suitable technologies. In other words, developers could choose the technology stack based on the characteristics of the task, regardless of compatibility issues. 3. Load Balance. The computation pressure gets decentralized through the polling strategy to achieve the maximum optimization of the system performance. In this way, the system based on micro-service architecture could offer unprecedented strong data processing capability. 4. Independent Scalability. Each component could be scaled independently of each other, which makes elastic scaling more feasible and reduces costs.
The applications of the developed system showed that compared to the 3-tier architecture, the tunnel intelligent monitoring and early warning system based on micro-service architecture would no longer be constrained to the performance bottleneck of the single server. This architecture offered an ideal platform for the integration of diverse monitoring algorithms and novel sensors. Moreover, the application of the developed system in Anping tunnel also proved the high inspection efficiency, the effective early-warning ability, and the timely emergency response mechanism of the system.
5. Limitation and future work
This article drew on the advantages of previous research work on tunnel monitoring and explored a possible solution to handle the new challenges brought by the development of tunnel monitoring methods. A novel tunnel intelligent monitoring and early warning system based on micro-service architecture was developed to supplement the development of the internet-based tunnel monitoring system. However, there are still some shortcomings in this article. These shortcomings need to be further improved in the next step of the study.
Some algorithms may not be suitable for being implemented in a web-browser way because of the limited caching capabilities of desktop browsers. The computation process could be finished in the back-end server, but if the required result visualization of such algorithm were much sophisticated, like a high-resolution 3D modeling, the browser might crash due to its limited rendering performance. Therefore, in the follow-up work, the multi-mode interactions of wireless monitoring need to be further explored.
Although this architecture could be flexible enough to be an ideal platform to integrate advanced algorithms and sensors, this flexibility also brings the high costs of operation and maintenance. Therefore, how to split the whole service appropriately deserves the most attention. It would be too difficult to maintain such a bloated system if the service got over-split. The combination of the monolith and micro-service architecture seems to be an important issue to be explored in future work. Also note that the choice of architecture mainly depends on the business volume.
6. Conclusions
This article focuses on the research topic of the optimization of the internet-based tunnel monitoring system to fit the development trend of tunnel monitoring methods. A novel tunnel intelligent monitoring and early warning system based on micro-service architecture was developed and applied to the wireless monitoring of the study area. The main conclusions obtained are as follows:
The monitoring data and preventive measures in Anping tunnel showed that the surrounding rock condition has a significant influence on tunnel security. The crown settlement and peripheral displacement convergence are the most critical evaluation indexes of tunnel security. Thus, the monitoring and measurement should be in combination with the geological prediction.
The successful application in Anping tunnel showed that the internet-based tunnel monitoring system possessed high monitoring efficiency and quick data transmission. Diverse data visualization and analysis algorithms could offer users comprehensive and detailed up-to-date information of the tunnel in real-time. Thus, effective emergency response action could be taken timely.
Micro-service architecture could be suitable for the tunnel automatic monitoring due to its big data processing capability and satisfying extensibility. There would be massive monitoring data generated from more sophisticated sensors and more productive monitoring algorithms in the foreseeable future. Compared to the existing system architecture, the internet-based system based on micro-service architecture would be well-suited to this trend.
Disclosure statement
No potential conflict of interest was reported by the author(s).
Additional information
Funding
References
- Bossi G, Schenato L, Marcato G. 2017. Structural health monitoring of a road tunnel intersecting a large and active landslide. Appl Sci. 7(12):1271.
- Cao C, Shi C, Lei M, Yang W, Liu J. 2018. Squeezing failure of tunnels: A case study. Tunn Undergr Sp Technol. 77:188–203.
- Chen K, Wang C, Chen L, Niu X, Zhang Y, Wan J. 2020. Smart safety early warning system of coal mine production based on WSNs. Saf Sci. 124:104609.
- Chen S, Yin D, Jiang N, Wang F, Zhao Z. 2019. Mechanical properties of oil shale-coal composite samples. Int J Rock Mech Min Sci. 123:104120.
- Di Murro V, Pelecanos L, Soga K, Kechavarzi C, Morton RF, Scibile L. 2019. Long-term deformation monitoring of CERN concrete-lined tunnels using distributed fibre-optic sensing. Geotech Eng. 50(2):1–7.
- Dickmann T. 2020. Using seismic exploration to predict geological risk along tunnels and underground spaces. Proc Inst Civ Eng - Civ Eng. 173(5):11–16.
- Elhoseny H, Elhoseny M, Abdelrazek S, El-Bakry H, Riad A. 2016. Utilizing Service Oriented Architecture (SOA) in Smart Cities. Int J Adv Comput Technol. 8(3):77–84.
- Feng G, Kang Y, Wang X, Hu Y, Li X. 2020. Investigation on the failure characteristics and fracture classification of shale under Brazilian test conditions. Rock Mech Rock Eng. 53(7):3325–3340.
- Gong Q, Yin L, Ma H, Zhao J. 2016. TBM tunnelling under adverse geological conditions: An overview. Tunn Undergr Sp Technol. 57:4–17.
- He L, Chen Y. 2010. Design and implementation of Web Content Management System by J2EE-based three-tier architecture -Applying in maritime and shipping business. ICIME 2010 - 2010 2nd IEEE Int Conf Inf Manag Eng. Vol. 2. Chengdu, China: IEEE. p. 513–517.
- Huang H, Babadagli T, Chen X, Li H, Zhang Y. 2020. Performance comparison of novel chemical agents for mitigating water-blocking problem in tight gas sandstones. SPE Reservoir Eval Eng. 2020:1–9.
- Hu SC, Tan YL, Zhou H, et al. 2020. Anisotropic modeling of layered rocks incorporating planes of weakness and volumetric stress. Ener Sci & Engi.8: 789–803.202.
- Huang W, Sun B, Xu M, Zhao H, Hu Y. 2016. Enterprise service bus based on OSGi. Proc 22nd Int Conf Ind Eng Eng Manag 2015. Paris: Atlantis Press. p. 233–245.
- Jiang N, Wang CX, Pan HY, et al. 2020. Modeling study on the influence of the strip filling mining sequence on mining-induced failure. Energy Sci Eng. 0:1–17. https://doi.org/10.10.
- Jiang Q, Zhong S, Pan PZ, Shi Y, Guo H, Kou Y. 2020. Observe the temporal evolution of deep tunnel’s 3D deformation by 3D laser scanning in the Jinchuan No. 2 Mine. Tunn Undergr Sp Technol. 97:103237.
- Koch C, Vonthron A, König M. 2017. A tunnel information modelling framework to support management, simulations and visualisations in mechanised tunnelling projects. Autom Constr. 83:78–90.
- Koubâa A, Qureshi B, Sriti MF, Allouch A, Javed Y, Alajlan M, Cheikhrouhou O, Khalgui M, Tovar E. 2019. Dronemap Planner: A service-oriented cloud-based management system for the Internet-of-Drones. Ad Hoc Networks. 86:46–62.
- Li A, Liu Y, Dai F, Liu K, Wei M. 2020. Continuum analysis of the structurally controlled displacements for large-scale underground caverns in bedded rock masses. Tunn Undergr Sp Technol. 97:103288.
- Li Y, Wang H, Cai W, Li S, Zhang Q. 2020. Stability monitoring of surrounding rock mass on a forked tunnel using both strain gauges and FBG sensors. Measurement. 153:107449.
- Liu DK,Gu ZL,Liang RX,Su JW,Ren DZ, Chen B,Huang CQ,Yang C. 2020. Impacts of pore-throat system on fractal characterization of tight sandstones, Geofluids. 9: 1–17. Article ID4941501. doi: 10.1155/2020/4941501.
- Liu W, Zhao T, Zhou W, Tang J. 2018. Safety risk factors of metro tunnel construction in China: An integrated study with EFA and SEM. Saf Sci. 105:98–113.
- Ranaweera K, Ruwanpura J, Fernando S. 2013. Automated real-time monitoring system to measure shift production of tunnel construction projects. J Comput Civ Eng. 27(1):68–77.
- Shan PF, Lai XP. 2020. An associated evaluation methodology of initial stress level of coal-rock masses in steeply inclined coal seams, Urumchi coal field. EC. 37(6):2177–2192.
- Song Q, Wu Y, Xin X, Yang L, Yang M, Chen H, Liu C, Hu M, Chai X, Li J. 2019. Real-time tunnel crack analysis system via deep learning. IEEE Access. 7:64186–64197.
- Sun H, Xu Z, Yao L, Zhong R, Du L, Wu H. 2020. Tunnel monitoring and measuring system using mobile laser scanning: Design and deployment. Remote Sens. 12(4):730.
- Tao Z, Zhang H, Zhu C, Hao Z, Zhang X, Hu X. 2019. Design and operation of App-based intelligent landslide monitoring system: the case of Three Gorges Reservoir Region. Geomatics, Nat Hazards Risk. 10(1):1209–1226.
- Wang J, Ning JG, Qiu PQ, YS, Shang HF. 2019. Microseismic monitoring and its precursory parameter of hard roof collapse in longwall faces: A case study. Geomech Eng. 17(4):375–383.
- Wang J, Qiu P, Ning J, Zhuang L, Yang S. 2020. A numerical study of the mining-induced energy redistribution in a coal seam adjacent to an extracted coal panel during longwall face mining: A case study. Energy Sci Eng. 8(3):817–835.
- Wang X, Yuan W, Yan YT, Zhang X. 2020. Scale effect of mechanical properties of jointed rock mass: A numerical study based on particle flow code. Geomech Eng. 21(3):259–268.
- Wang Y, Jing H, Su H, Xie J. 2017. Effect of a fault fracture zone on the stability of tunnel-surrounding rock. Int J Geomech. 17:04016135.
- Wei L, Khan M, Mehmood O, Dou Q, Bateman C, Magee DR, Cohn AG. 2019. Web-based visualisation for look-ahead ground imaging in tunnel boring machines. Autom Constr. 105:102830.
- Yin Q, Ma GW, Jing HW, Wang HD, Su HJ, Wang YC, Liu RC. 2017. Hydraulic properties of 3D rough-walled fractures during shearing: an experimental study. J Hydrol. 555:169–184.
- Yoon S, Um J, Suh S-H, Stroud I, Yoon J-S. 2019. Smart Factory Information Service Bus (SIBUS) for manufacturing application: requirement, architecture and implementation. J Intell Manuf. 30(1):363–382.
- Zhai X, Yue P, Zhang M. 2016. A sensor web and web service-based approach for active hydrological disaster monitoring. IJGI. 5(10):171.
- Zhang L, Skibniewski MJ, Wu X, Chen Y, Deng Q. 2014. A probabilistic approach for safety risk analysis in metro construction. Saf Sci. 63:8–17.
- Zhang N, Liu W, Zhang Y, Shan PF, Shi XL. 2020. Microscopic pore structure of surrounding rock for underground strategic petroleum reserve (SPR) caverns in bedded rock salt. Energies. 13(7):1565.
- Zhang Y, Cao SG, Zhang N, Zhao CZ. 2020. The application of short-wall block backfill mining to preserve surface water resources in northwest China. J Cleaner Prod. 261(121232):121232.
- Zhu C, He MC, Karakus M, Cui XB, Tao ZG. 2020. Investigating toppling failure mechanism of anti-dip layered slope due to excavation by physical modelling. Roc Mech and Rock Engi. doi:10.1007/s00603-020-02207-y.