
 ?Mathematical formulae have been encoded as MathML and are displayed in this HTML version using MathJax in order to improve their display. Uncheck the box to turn MathJax off. This feature requires Javascript. Click on a formula to zoom.
Abstract
Coal is the major energy source in China. Many coal mines in Southwest China have arranged the excavation roadway system in the Maokou limestone in coal seam floor because of its special hydrogeological conditions. Since karst is widely distributed in Maokou limestone and water-filled karst caves are also developed commonly there, once a strongly water-filled karst cave is exposed during roadway excavation, the water inrush disaster occurs easily. In order to reveal the phenomenon of water inrush disasters from covered karst caves more effectively, the water inrush that occurred during the roadway excavation process of Jiyuan coal mine in northern Guizhou was taken as a research object in this study. Based on the regional geological structure, the hydrogeological condition and the fluid-structure interaction theory, a fluid-structure interaction model of water inrush in the roadway excavation was established, and variation laws of stress field, displacement field and seepage field of surrounding rock during the process of water inrush from karst cave were analyzed. Besides, the influence of different geological conditions on water inrush from karst cave was discussed from aspects of the size of karst cave, the water pressure of karst cave and the thickness of aquiclude.
1. Introduction
Coal resources are abundant in Southwest China, and coal industry plays an important role in the development of national economy (Song et al. Citation2015; Yu Citation2017; Li et al. Citation2018; Li and Wu Citation2019; Ma et al. Citation2020). However, the hydrogeological conditions of the coal field are extremely complex there, and the coal mining process is threatened by various forms of water hazards, especially for coal mines in Chongqing city and northern Guizhou province. The primary mineable coal seams of Longtan formation of Permian in these areas are directly threatened by both the limestone aquifer of Changxing formation in the roof and the limestone aquifer of Maokou formation in the floor, which constitutes a "sandwich" hydrogeological condition. This unique mine hydrogeological structure makes it difficult to choose the layout of excavation roadway systems (Guo Citation2010; Liang Citation2013; Wu et al. Citation2016). To explain this, first of all, since the strata of Longtan formation are mainly layered weak to semi hard clastic rocks, of which compressive strengths are low and support costs are high, and may cross the coal seam by mistake, inducing gas outbursts due to geological structure at any time. Moreover, it is inappropriate to arrange the excavation system in the limestone of Changxing formation in coal seam roof, as the roadway will be destroyed after coal mining, which makes the excavation roadway system unable to meet its function. In view of the above reasons, currently many excavation roadway systems have been arranged in the Maokou limestone in coal seam floor of coal mines in these areas such as Hongyan coal mine, Miaoxin coal mine, Jiyuan coal mine and Guancang coal mine. It is a reasonable choice to arrange the excavation roadway system in the Maokou limestone under various unfavorable conditions in Chongqing and northern Guizhou. However, water-filled karst caves, which have remarkable spatial distribution heterogeneity, are commonly developed in the Maokou limestone, and once a strong water-filled karst cave is exposed during roadway excavation, water inrush disasters occur easily.
At present, a large number of researchers have conducted a lot of studies on mechanism of water inrush of different types, such as water inrush from faults, water inrush from karst collapse columns, water inrush from unconsolidated aquifers in roof and water inrush from confined aquifers in floor, but there is almost no research on water inrush from covered karst caves during roadway excavation in Southwest China. Only a few researchers have carried out some related studies. For example, Sun et al. (Citation2013) discussed necessary and sufficient conditions for water inrush from karst caves based on their geomechanical characteristics under mining. Zhao et al. (Citation2014) created a linkage analysis between fluid-structure interaction and strength reduction method of water bursting from concealed confined karst cave before roadway, and studied fluid-structure interaction effects and safety margins of rock pillar. Jiao and Bai (Citation2013) analyzed the delayed water inrush process from covered karst cave in Sanhejian coal mine, and then supposed that due to the excavation-induced stress and high pressure of karst groundwater, new karst collapse occurs at the top of cave, and the aquiclude is gradually broken down, which becomes the dominated factor of forming water inrush from karst cave in coal seam floor. The researches above are helpful to understand the phenomenon of water inrush disasters from karst cave, but there is no further study on the multi-field evolution laws in the process of water inrush from karst caves. In order to reveal it more practically, the water inrush disaster that occurred during the roadway excavation process of a typical coal mine was taken as a research object in this study. Based on the regional geological structure, the hydrogeological conditions and the fluid-structure interaction theory, a fluid-structure interaction model of water inrush in the roadway excavation was established, and variation laws of stress field, displacement field and seepage field of surrounding rock during the process of water inrush from karst cave were analyzed. Besides, the influence of different geological conditions on water inrush from karst cave was analyzed from three aspects of the size of karst cave, the water pressure of karst cave and the thickness of aquiclude. Related results in this study can provide scientific basis for the explanation of water inrush disasters from karst caves.
2. Project overview
2.1. Physical geography
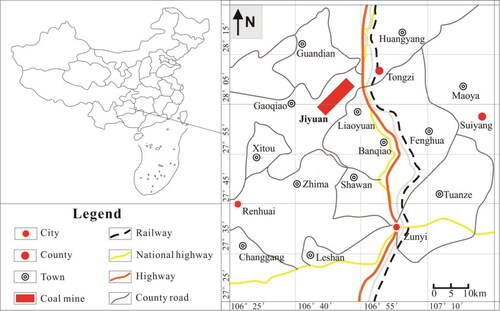
With an annual production capacity of up to 600,000 tons, Jiyuan coal mine is located 7 km away from the downtown area of Tongzi county, Guizhou province, China. Its geographic location is shown in . Topographically, Jiyuan coal mine is high in the northeast and low in the southwest, with the highest elevation point of 1321.3 m and the lowest elevation point of around 565 m. A vast area of carbonate rocks is exposed on the surface of the mining field, where well-developed surface and underground karst landscapes in various types and diverse individual forms are present. Located across the monsoon climate zone, the mining field has a warm, moist climate and an annual average precipitation of 1011.2 mm over the past decade, with the majority of precipitation falling from May to October. The supply source of water is mainly the meteoric water, and highly frequent mutual exchange, conversion and circulation between surface water and groundwater are present there.
Figure 1. Location of the study area.
2.2. Hydrogeology
The coal mine is developed by means of inclined shafts. Due to the peculiarity of hydrogeological conditions there, the main, service and ventilation inclined shafts are arranged in coal seam floor of Maokou formation, where the lithology is characterized by massive limestone, cherty limestone and siliceous limestone of medium-thick to thick layers. The average outcropping thickness in the mine field is 244 m, with a dip angle of 15-35° and a dip of NW. The karst fissures are well developed in this stratum. Specifically, the groundwater is recharged by precipitation and surface stream water through karst fissures, sinkholes and dolines. Besides, the groundwater runs off through karstic fissures, conduits and dissolved pores, and it is outcropped in the form of springs or spring clusters, showing characteristics of intense exchanges, shallow circulation, short runoff and concentrated discharges. Due to the obvious spatial difference of karst development, water abundance in the Maokou limestone is highly uneven, and the typical water-filled karst caves in limestone pose huge safety risks for the roadway excavation in rainy season.
2.3. Process of the water inrush hazard
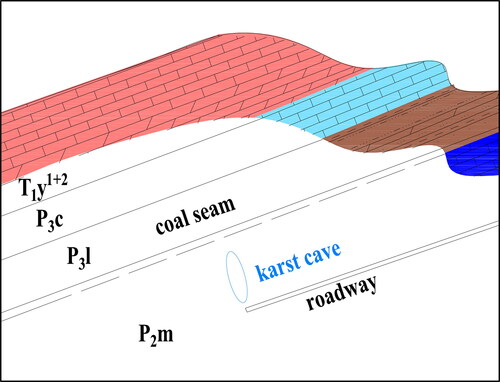
On October 30, 2010, discharge of fissure water was found at 12 m of the water prospection roadway under the excavation roadway of Jiyuan coal mine. The water inflow was about 50 m3/h, the roadway was submerged for 85 m and the water level was stable at +770.5 m. Starting from November 30, a horizontal water prospection roadway was constructed at the +771 m level, which uncovered the underground karst cave. Due to great difficulties with controlling the water in the main inclined shaft, a diversion design and construction of the main inclined shaft was started in September 2011. This study focused on the water inrush hazard stated above, and the geological profile of water inrush site is shown in .
Figure 2. Geological profile of water inrush site.
3. Analysis of multi-field catastrophe evolution laws of water inrush
3.1. Mathematical model of fluid-structure interaction
The equilibrium differential equation of solid mechanics is shown in Formula (1) (Zhu et al. Citation2009; Li and Xu Citation2016).
(1)
(1)
The Darcy's law equation of seepage is shown as follows:
(2)
(2)
(3)
(3)
(4)
(4)
Through the analysis of the fluid-structure interaction theory (Zhao et al. Citation2014; Ma et al. Citation2020), the constitutive equation of the numerical model can be obtained as Formula (5).
(5)
(5)
In the above formulas, F is the body force (N); v is the seepage velocity (m/s); K is the permeability coefficient (m/d); J is the hydraulic gradient (m); P is the seepage water pressure (Pa); rw is the bulk density of water (N/m³); Jx, Jy are the hydraulic gradient components on x and y axis (m); Kij is the permeability coefficient in different directions in xy quadrant (m/d).
3.2. Numerical calculation model and distribution of monitoring points
Values of parameters in the model are shown in . The calculation model was constructed by centering on the process of water inrush from covered karst cave in the roadway excavation, as shown in . The strike direction x of the model was 500 m in length, and the tilt direction y was 500 m in width. The cave was generalized as an ellipsoid, and the formation dip was 21°. The karst cave was generalized as an ellipsoid, and the stratum dip is 21°. For conditions of solid mechanics boundary, the top and excavation roadways of the model were set as a free boundary, the X direction of the model was set as a stick support boundary, the Y direction of the model was set as a symmetric boundary and the bottom of the model was set as a fully constrained boundary. For conditions of seepage boundary, the outer wall of karst cave in this model was set as a permeable boundary, and the other outer surfaces were set as an impervious boundary. The roadway was located in Maokou limestone, 80 m beneath the coal seam floor, with its excavating direction consistent with that of the rock strata. Excavating with a step length of 10 m was adopted for roadway far away from karst cave, and excavating with a step length of 4 m was conducted when the roadway was approaching karst cave. The mesh of the model was divided uniformly based on a free tetrahedral mesh, observing to a principle of a higher mesh density for areas near the roadway and karst cave, and increasingly lower density for surrounding areas. A total of 8 monitoring points, denoted by a, b, c, d, a1, b1, c1 and d1, respectively, were arranged on the roadway’s roof and floor to monitor the stress and displacement. 3 other monitoring points, denoted by A, B and C, were arranged around the surrounding rocks between the roadway and karst cave to monitor the pore water pressure. Monitoring point D was arranged at the surrounding rock between the roadway and karst cave to monitor variations in stress, displacement and pore water pressure in the aquifuge during the process of water inrush from karst cave under different geological conditions ().
Figure 3. Schematic diagram of numerical calculation model.
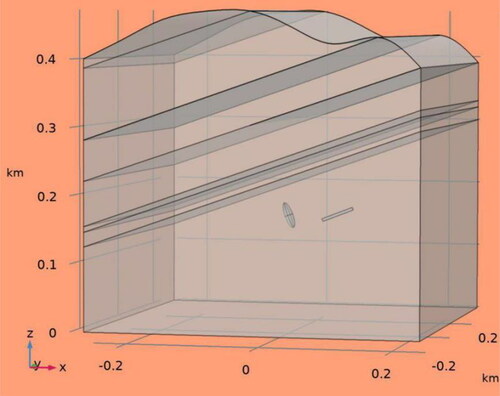
Figure 4. Layout of monitoring points.
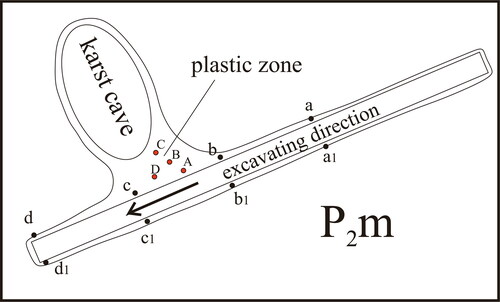
Table 1. Simulation calculation parameters.
3.3. Simulation results and analysis
3.3.1. The effect of roadway excavation on stress in surrounding rock
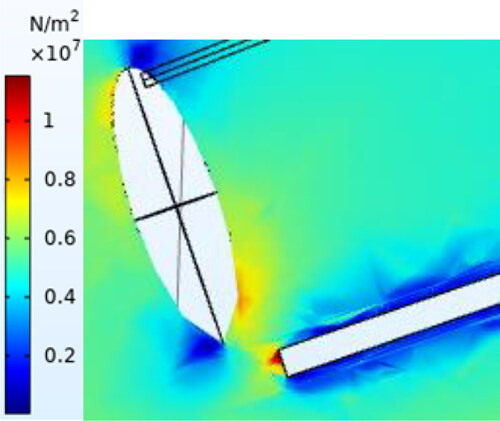
presents the stress distribution in surrounding rock when roadway is being excavated. As is shown in the picture, the roadway excavation caused a redistribution of the stress field around surrounding rock, leading to the formation of a partial stress concentration zone near the excavation panel where the value of stress was significantly higher than that in other surrounding rocks. Values of stress in surrounding rock on roadway’s roof and floor were lower than those in the rock adjacent, and a region of relatively higher stress was formed on the side of outer karst cave wall which was close to the roadway.
Figure 5. Stress Distribution when approaching the karst cave.
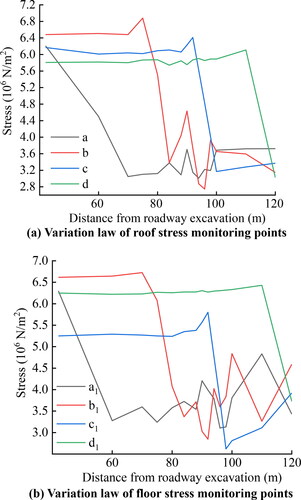
show variations in stress collected by monitoring points at the roadway’s roof (a, b, c, d) and floor (a1, b1, c1, d1) with advancement in excavation. As can be known from the figures, stress measured at points a and a1 first dropped drastically and then gradually climbed when the distance from roadway excavation was 50-80 m and the excavation panel gradually approached the karst cave. Stress at monitoring points b and b1 were relatively stable and then dropped drastically when the distance from excavation was less than 70 m, while those measured by the rest of monitoring points was relatively stable; When the distance from roadway excavation was 80-100 m, and the excavation panel reached and passed through the karst cave, stress measured at monitoring points d and d1 were relatively stable, while those at other monitoring points showed different degrees of fluctuation; When the distance from roadway excavation was 100-120 m and the excavation panel gradually moved away from the karst cave, stress measured at roof’s monitoring points a, b and c gradually stabilized while those at d drastically dropped. Apart from stress at floor’s monitoring point d1 which showed a significant decrease, stress measured at other monitoring points still showed relative fluctuations.
Figure 6. (a) Variation law of roof stress monitoring points, (b) Variation law of floor stress monitoring points.
3.3.2. The effect of roadway excavation on displacement of surrounding rock
presents the displacement distribution of surrounding rock during roadway excavation. The displacement variation of surrounding rock in the range of free face was caused by roadway excavation. Especially, the closer the surrounding rock was to the free face side of the roadway, the larger the displacement. Besides, positive displacement was generated around the roadway’s floor while negative displacement was generated around the roadway’s roof.
Figure 7. Displacement distribution when approaching the karst cave.
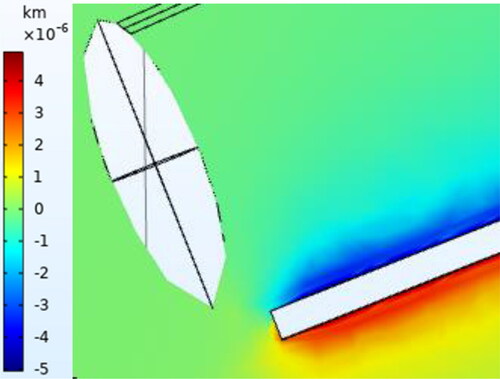
Figure 8. (a) Variation law of roof displacement monitoring points, (b) Variation law of floor displacement monitoring points.
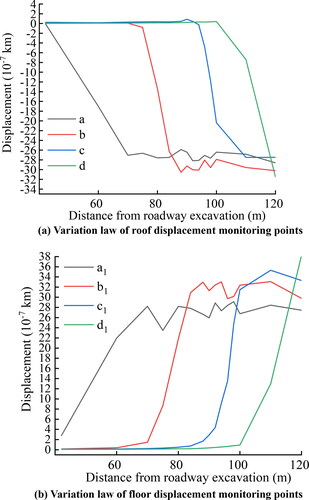
show variations in displacement collected by monitoring points at the roadway’s roof (a, b, c, d) and floor (a1, b1, c1, d1) with advancement in excavation. As can be seen, when the distance from roadway excavation was 50-80 m and the excavation panel gradually approached the karst cave, displacement at monitoring points a and a1 showed an increasing negative displacement and a positive displacement respectively, which then gradually stabilized when the distance from excavation exceeded 70 m. At the same time, displacement measured by floor monitoring point b1 drastically increased before tending to stabilize, and variations in monitoring point b were consistent with that of b1, but with an evident lag. When the distance from roadway excavation was 80-100 m, and the excavation panel reached and passed though the karst cave, displacement at monitoring points c and c1 showed a drastically increasing negative displacement and a positive displacement respectively, and those of other monitoring points except d and d1 all showed significant fluctuations. When the distance from roadway excavation was 100-120 m and the excavation panel gradually moved away from the karst cave, displacement at monitoring points d and d1 showed a negative displacement and an increasing positive displacement respectively, while those of other monitoring points tended to stabilized. Generally, with the advancement in roadway excavation, variations in displacement at monitoring points of roof and floor almost showed the same pattern, but variations at roof’s monitoring points were somewhat lagged.
3.3.3. The effect of roadway excavation on pore water pressure in the surrounding rock
presents the pore water pressure distribution in surrounding rock during roadway excavation. Driven by the internal water pressure, the pore water pressure gradually transited from the inside of karst cave to the surrounding rock, and then decreased.
Figure 9. Pore water pressure distribution when approaching the karst cave.
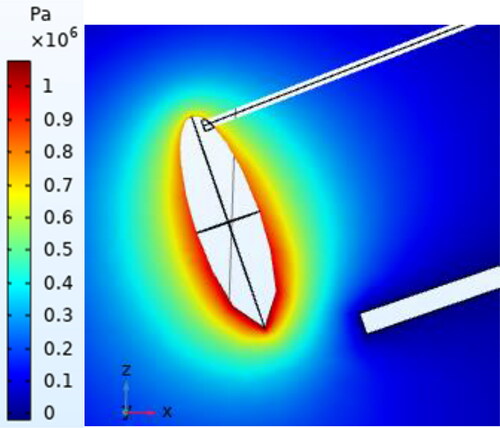
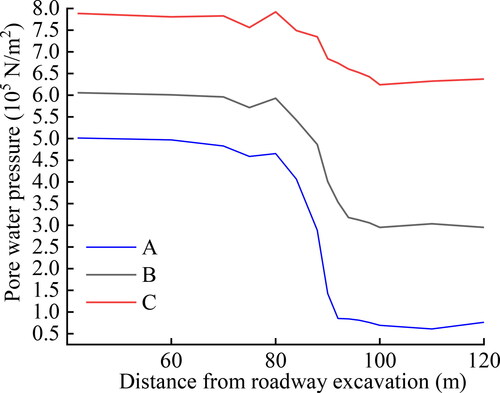
presents variations in pore water pressure measured by monitoring points A, B and C between the roadway and karst cave during roadway excavation. When the distance from roadway excavation was 50-80 m and the excavation panel gradually approached the karst cave, pore water pressure of each monitoring point firstly decreased gradually, and the decreasing speed became faster. When the excavation panel reached the karst cave, pore water pressure at each monitoring point showed a slight increase. When the distance from roadway excavation was 80-100 m and the excavation panel passed through the karst cave, pore water pressure at each monitoring point showed an abrupt decrease, with the highest decreasing rate appearing when the distance was 90 m. And it was speculated that water inrush occurred at that time. When the distance from roadway excavation was 100-120 m and the excavation panel moved away from the karst cave, the pore water pressure gradually stabilized.
Figure 10. Variation law of pore water pressure at monitoring points in the plastic zone.
3.4. Analysis of seepage process of water inrush from karst cave in roadway
3.4.1. Nonlinear seepage coupling model
Navier Stokes free flow equation is used to describe the motion law of fluid under the pressure, viscous resistance and gravity, and has been widely used in the study of conduit flow and river channel flow (Lee Citation2018; Youssef and Awotunde Citation2019; Kadapa et al. Citation2020) which can be expressed as:
(6)
(6)
Brinkman equation can describe the flow characteristics of fluid in porous media under the seepage pressure, which is suitable for presenting the rapid seepage law of fluid in the failure area of surrounding rock where Darcy's law is not applicable (Ma et al. Citation2019; Khoei et al. Citation2020; Pažanin and Radulović Citation2020). And it can be expressed as:
(7)
(7)
(8)
(8)
(9)
(9)
In the above formulas, ρ is the fluid density (kg/m3); u is the fluid velocity (m/s); p is the fluid pressure (Pa); I is the unit matrix; F is the fluid resistance (N); k is the porous medium permeability (m/d); η is the dynamic viscosity (Pa·s); εp is the porosity; Cf is the friction coefficient; βF is the parameter in Forchheimer equation.
When water inrush occurs from karst cave, the fluid in karst cave flows under the action of water pressure and gravity, which can be expressed by Navier Stokes seepage equation. The water inrush channel is located in the plastic failure zone, and flow of water there is characterized by nonlinear seepage, which can be expressed by Brinkman nonlinear seepage equation. When the water flows into the roadway, it will flow freely, which conforms to the movement characteristics of Navier-Stokes seepage equation. It can be concluded that there are two physical transformation processes in the process of water inrush from covered karst cave. In the calculation model of this study, Formula 6 and Formula 7 were used to analyze the variation laws of flow fields of groundwater in the process of water inrush from karst cave.
3.4.2. Results and analysis of numerical calculation
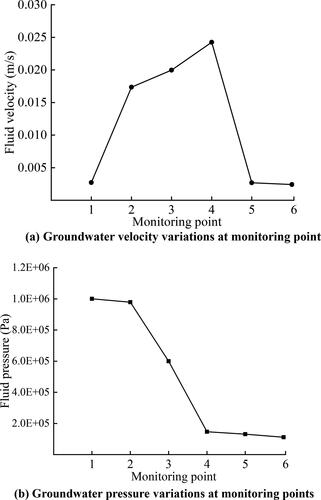
shows the fluid velocity’s variation of groundwater flowing from karst cave to roadway and the layout of each monitoring point, and present variations in groundwater’s velocity and water pressure measured at each monitoring point. As can be seen from , the fluid velocity of groundwater increased swiftly at the connected area between the karst cave and the fracture zone in surrounding rock. When the flow continued to flow into the failure zone in surrounding rock, the fluid velocity was still increasing, but at this time, the increase range of the velocity greatly decreased compared with that earlier, which may be attributed to the fact that when groundwater entered the plastic failure zone of surrounding rock, part of the water flow had lost their kinetic energy to overcome the friction between water molecules and rock masses. When groundwater was about to break through the failure zone in surrounding rock, the fluid velocity reached its maximum level. After that, the groundwater entered into a free flow state with a reduced fluid velocity before finally tending to stabilize.
Figure 11. Variation in fluid velocity and positions of monitoring points.
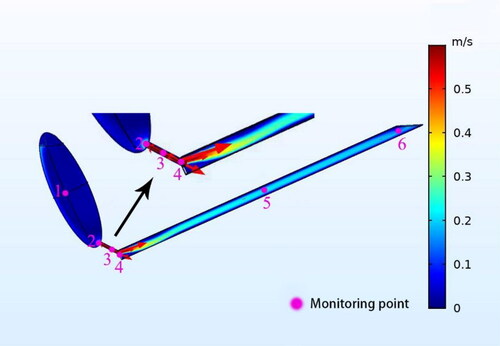
The water pressure decreased along the flow path, during which the flow energy gradually transformed into fluid velocity in the following process: The water pressure abruptly decreased from the overlying karst cave to the water inrush channel from 0.99 MPa to 0.15 MPa; After the groundwater entered the water inrush channel, variations in water pressure tended to stabilized from 0.15 MPa to 0.1 MPa; Finally, after the groundwater entered the roadway, the water pressure remained stable.
4. The effect of different geological conditions on water inrush from karst cave during roadway excavation
Although the numerical simulation experiment under the background of a project case is representative, it is insufficient to reflect the process of water inrush from karst cave under different geological conditions. The geological factors that affect the water inrush from the overlying karst cave are mainly reflected in two aspects: One is the structure and water-filling characteristics of the karst cave, and the other is the water resisting ability of the rock mass between the roadway and the cave. In this study, the size of karst cave, water pressure of karst cave and the thickness of aquifuge are selected as the key geological factors affecting water inrush, and the influence of these factors on the water inrush from the cave is analyzed. Specifically, five groups of numerical simulation experiments were set up for each scheme according to different levels of each factor. When one factor level changes, the other two factors remain constant. Parameters of physical mechanics and altitude of rocks were based on the geological background of Jiyuan coal mine. Monitoring point D was set up at the aquifuge between the roadway and karst cave, as shown in , to analyze the variation in stress, displacement and pore water pressure in surrounding rocks in the aquifuge under different geological conditions. Specific experimental schemes are shown in .
Table 2. Numerical simulation schemes of water inrush under different geological conditions.
4.1. The effect of the size of karst cave on water inrush from karst cave
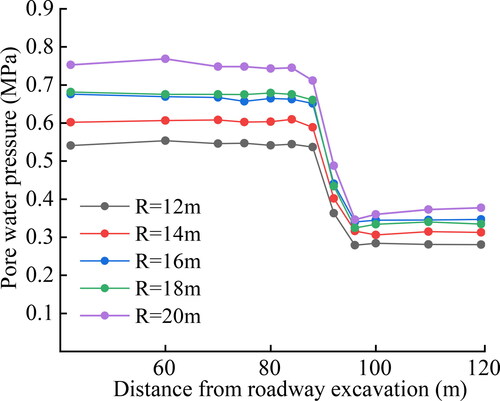
Set the water pressure of karst cave as 1.5 MPa and the thickness of aquiclude as 2 m. The variation laws of stress, displacement and pore water pressure in aquiclude with different cave radius (12 m, 14 m, 16 m, 18 m, 20 m) were studied (shown in ).
Figure 12. (a) Groundwater velocity variations at monitoring point, (b) Groundwater pressure variations at monitoring points.
As can be known from , before the occurrence of water inrush, stress in aquiclude showed a minor fluctuation as the roadway excavation was approaching the karst cave, while the displacement and pore water pressure both remained stable. And the larger the radius of karst cave, the smaller the stress and the larger the pore water pressure, while the displacement remained constant; When water inrush occurred (the distance from roadway excavation was 90-95 m), stress in aquiclude under different radius of karst cave showed a slight increase first and then dropped abruptly, as compared with an abrupt drop in both displacement and pore water pressure. After water inrush occurred, stress and pore water pressure in aquiclude tended to stabilize as the excavation panel gradually moved away from the karst cave, but displacement still showed minor fluctuations. Meanwhile, it can be observed that the larger the radius of karst cave, the larger the pore water pressure and the smaller the stress and displacement.
4.2. The effect of karst cave water pressure on water inrush from karst cave
Set the radius of karst cave as 20 m and the thickness of aquiclude as 2 m. The variation laws of stress, displacement and pore water pressure in aquiclude with different water pressure of karst cave (1 MPa, 1.5 MPa, 2 MPa, 2.5 MPa, 3 MPa) were studied (shown in ).
Figure 13. The stress variation of the aquiclude under different cave radius.
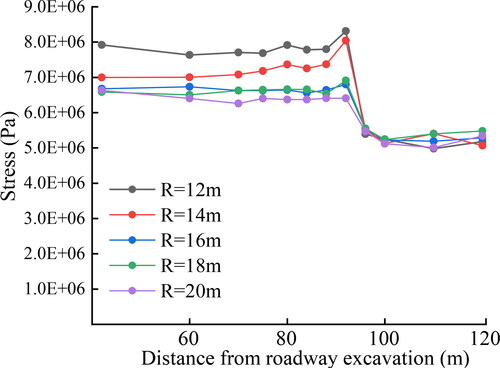
Figure 14. The displacement variation of the aquiclude under different cave radius.
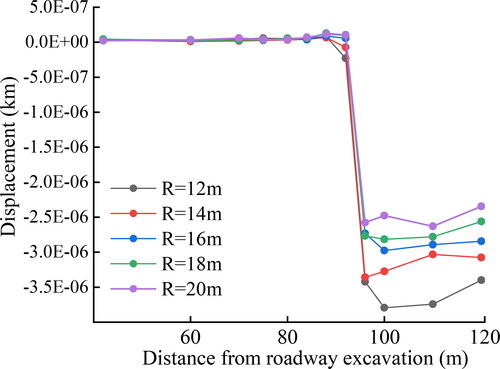
Figure 15. The pore water pressure variation of the aquiclude under different cave radius.
As can be known from , before the occurrence of water inrush, stress in aquiclude under different water pressure of karst cave slowly dropped and then abruptly increased at a minor magnitude with roadway excavation approaching the karst cave. When water inrush occurred (the distance from roadway excavation was 90-95 m), stress in aquiclude under different water pressure of karst cave showed a slight increase first and then dropped significantly, as compared with a steep drop in both displacement and pore water pressure. After water inrush occurred, stress and pore water pressure in aquiclude tended to stabilize as the excavation panel gradually moved away from the karst cave, but displacement still showed minor fluctuations. At the same time, it can be observed that the larger the water pressure of karst cave, the larger the pore water pressure and stress, and the smaller the displacement.
4.3. The effect of aquifuge thickness on water inrush from karst cave
Set the water pressure of karst cave as 1.5 MPa and the radius of karst cave as 20 m. The variation laws of stress, displacement and pore water pressure in aquiclude with different thickness of aquiclude (2 m, 4 m, 6 m, 8 m, 10 m) were studied (shown in ).
Figure 16. The stress variation of the aquiclude under different cave water pressure.
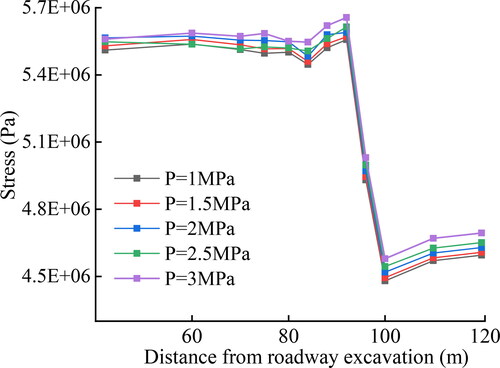
Figure 17. The displacement variation of the aquiclude under different cave water pressure.
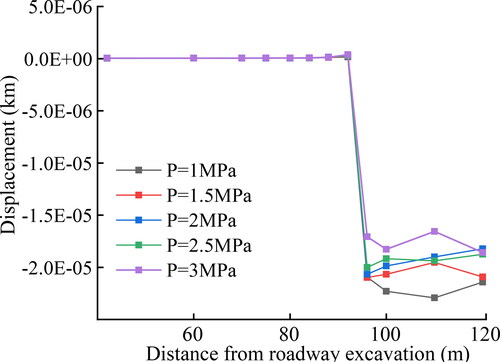
Figure 18. The pore water pressure variation of the aquiclude under different cave water pressure.
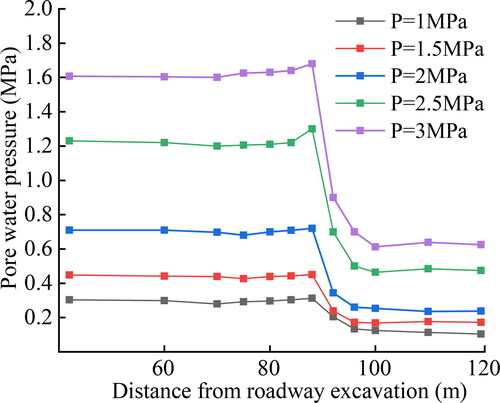
Figure 19. The stress variation of the aquiclude under different aquiclude thickness.

Figure 20. The displacement variation of the aquiclude under different aquiclude thickness.
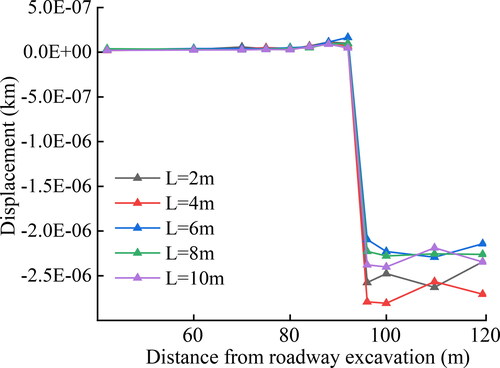
Figure 21. The pore water pressure variation of the aquiclude under different aquiclude thickness.
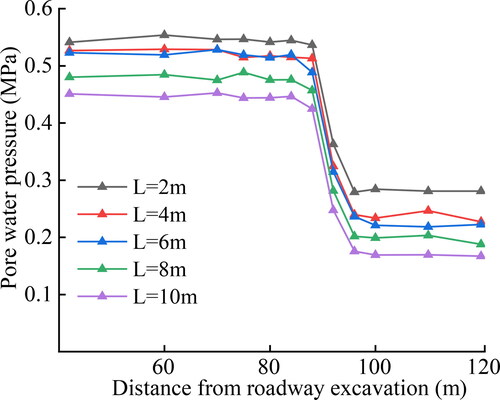
As can be known from , before the occurrence of water inrush, displacement and pore water pressure in aquiclude remained stable as the roadway excavation was approaching the karst cave, while the stress showed a certain degree of fluctuations. When water inrush occurred (the distance from roadway excavation was 90-95 m), stress in different thickness of aquiclude showed a slight increase first and then dropped significantly, as compared with a steep drop in both displacement and pore water pressure. After water inrush occurred, stress and pore water pressure in aquiclude tended to stabilize as the excavation panel gradually moved away from the karst cave, but displacement still showed minor fluctuations. Meanwhile, it can be observed that the larger the thickness of aquiclude, the smaller the pore water pressure and stress.
5. Conclusion
Through the analysis of the variation laws of physical quantities of each monitoring point in the roadway’s roof and floor during the process of water inrush, the following conclusions can be drawn: When the excavation roadway is approaching the karst cave from a distance, affected by excavation disturbance, the stress of the surrounding rock of the roadway decreases obviously. The displacement of the roadway’s floor and roof of increases significantly along the positive and negative directions respectively. The pore water pressure decreases gradually and increases slightly when the excavation roadway is close to the karst cave; When the excavation roadway reaches and passes through the karst cave, the stress, displacement and pore water pressure of surrounding rock of the roadway’s roof and floor near the karst cave change suddenly, which is reflected in the sharp decrease of the stress and pore water pressure, and rapid increase of the displacement along the positive and negative directions respectively. Besides, water inrush occurs at this time; When the excavation roadway is far away from the karst cave, the stress, displacement and pore water pressure of the surrounding rock around the excavated area and the karst cave tend to be stable after a certain fluctuation. And there is a certain lag in the process of the physical quantities of the surrounding rock of the floor to be stable compared with the roof’s. To sum up, the variations of stress, displacement and pore water pressure of surrounding rock on roof and floor in the process of water inrush from karst cave caused by roadway excavation can be summarized into four states: stable state, germinating state, mutating state and post stable state. The variation characteristics of each physical quantity information of germinating state and mutating state can be used as the reference for identifying warning information of water inrush from karst cave.
The flow of water goes through two physical transformation processes when water inrush occurs. One occurred in the karst cave and roadway can be expressed by the Navier Stokes seepage equation and the other occurred in the water inrush channel can be expressed by the Brinkman nonlinear seepage equation; After entering the water inrush channel, the velocity of water in karst cave increases rapidly and reaches the maximum value when it is about to enter the roadway. After entering the roadway, it turns into free flow state with slight decrease of velocity, and finally tends to be stable; The water pressure decreases along the flow path, and the flow energy gradually transforms into fluid velocity. After water in karst cave enters the roadway, the water pressure tends to be stable.
Through the analysis of multi-field evolution law in the process of water inrush from karst cave, it can be found that the variation of stress field causes the variation of displacement field rapidly, the variation of displacement field causes the variation of seepage field gradually, and the variation of seepage field further aggravates both the variation of stress field and displacement field. These three physics fields influence each other and are closely related. Specifically, stress is the inducing factor of water inrush disaster, seepage is the direct factor of water inrush disaster, and displacement is the medium connecting stress and seepage.
Through the analysis of the variation laws of physical quantities of each monitoring point in the aquiclude under different geological conditions during the process of water inrush, the following conclusions can be drawn: Before the water inrush occurs, as the roadway is being excavated closer to the karst cave, the stress, displacement and pore water pressure in the aquiclude under the karst cave have kept stable for a long time. When the water inrush is about to occur, the stress and displacement in the aquiclude will rise obviously, and when the water inrush occurs, the stress, displacement and pore water pressure all show a sharp drop. After the water inrush occurred, these physical quantities gradually tend to be stable. The influence of different geological conditions on pore water pressure in aquiclude is most obvious, followed by stress and displacement. Besides, the influence on displacement is mainly appeared after water inrush occurred. In summary, the larger the size of karst cave, the smaller the stress and displacement and the greater the pore water pressure in the aquiclude; The greater the water pressure of karst cave, the greater the stress, displacement and pore water pressure in the aquiclude; The greater the thickness of the aquiclude, the smaller the stress and pore water pressure in the aquiclude.
Disclosure statement
No potential conflict of interest was reported by the authors.
Data availability statement
The data that support the findings of this study are available from the corresponding author, Dr Bo Li, upon reasonable request.
Additional information
Funding
References
- Guo M. 2010. Characteristics and prevention of water disaster in coal mine in Guizhou Province. Saf Coal Mines. 41(5):53–55. (in Chinese)
- Jiao Y, Bai HB. 2013. Mechanism of delayed groundwater inrush from covered karst cave in coal seam floor. J China Coal Soc. 38(S2):377–382. (in Chinese)
- Kadapa C, Dettmer WG, Perić D. 2020. Accurate iteration-free mixed-stabilised formulation for laminar incompressible Navier–Stokes: applications to fluid–structure interaction. J Fluids Struct. 97:103077.
- Khoei AR, Salehi SA, Hosseini N. 2020. Modeling of reactive acid transport in fractured porous media with the Extended–FEM based on Darcy-Brinkman-Forchheimer framework. Comput Geotech. 128:103778.
- Lee HC. 2018. Weighted least-squares finite element methods for the linearized Navier–Stokes equations. Int J Comput Math. 95 (1):20–35.
- Li B, Wu Q. 2019. Catastrophic evolution of water inrush from a water-rich fault in front of roadway development: a case study of The Hongcai Coal mine. Mine Water Environ. 38(2):421–430.
- Li D, Wu DS, Xu FG, Lai JH, Shao L. 2018. Literature overview of Chinese research in the field of better coal utilization. J Clean Prod. 185:959–980.
- Li JB, Xu YC. 2016. Mechanical model of the collapse column water inrush prevention considering the confined water seepage and its application. J China Univ Min Technol. 45(2):217–224. (in Chinese)
- Liang SK. 2013. The investigation on the characteristics of confined water and safely mining technology in north Guizhou coal region [PhD thesis]. Beijing, China: China University of Mining & Technology.
- Ma D, Duan HY, Li XB, Li ZH, Zhou ZL, Li TB. 2019. Effects of seepage-induced erosion on nonlinear hydraulic properties of broken red sandstones. Tunnelling Underground Space Technol. 91:102993.
- Ma D, Duan HY, Liu WT, Ma XT, Tao M. 2020. Water-sediment two-phase flow inrush hazard in rock fractures of overburden strata during coal mining. Mine Water Environ. 39(2):308–319.
- Ma D, Duan HY, Zhang Q, Zhang JX, Li WX, Zhou ZL, Liu WT. 2020. A numerical gas fracturing model of coupled thermal, flowing and mechanical effects. Comput Mater Continua. 65(3):2123–2141.
- Pažanin I, Radulović M. 2020. Effects of the viscous dissipation on the Darcy-Brinkman flow: Rigorous derivation of the higher-order asymptotic model. Appl Math Comput. 386:125479.
- Song ML, Wang SH, Cen L. 2015. Comprehensive efficiency evaluation of coal enterprises from production and pollution treatment process. J Clean Prod. 104:374–379.
- Sun Q, Zhu SY, Zhang R. 2013. Analysis on water inrush mechanism of pipeline conduction. J Basic Sci Eng. 31(3):463–470. (in Chinese)
- Wu Q, Li B, Chen YL. 2016. Vulnerability assessment of groundwater inrush from underlying aquifers based on variable weight model and its application. Water Resour Manage. 30(10):3331–3345.
- Youssef AA, Awotunde AA. 2019. Modelling fluid flow in karst reservoirs using Darcy Model with estimated permeability distribution. Comput Geosci. 133:104311.
- Yu XJ. 2017. Coal mining and environmental development in southwest China. Environ Dev. 21:77–86.
- Zhao YL, Cao P, Wan W, Wang WJ, Zhang SG, Zou SH. 2014. Fluid-solid coupling analysis of water bursting catastrophe from concealed confined karst cave before roadway. J Central South Univ. 45(05):1598–1604. (in Chinese)
- Zhao YL, Peng QY, Wan W, Wang WJ, Chen B. 2014. Fluid–solid coupling analysis of rock pillar stability for concealed karst cave ahead of a roadway based on catastrophic theory. Int J Min Sci Technol. 24(6):737–745.
- Zhu WC, Wei CH, Zhang FZ, Yang TH. 2009. Investigation of water inrush from karst subsidence column by using a coupled hydromechanical model. Chin J Underground Space Eng. 5(05):928–933. (in Chinese)