
 ?Mathematical formulae have been encoded as MathML and are displayed in this HTML version using MathJax in order to improve their display. Uncheck the box to turn MathJax off. This feature requires Javascript. Click on a formula to zoom.
Abstract
As an earthquake occurred in Iburi subprefecture, Japan on September 2018, Sapporo has also been damaged by ground subsidence. Ground subsidence can occur in various area, especially in urban areas causing considerable damage to human lives and properties. Currently, ground subsidence is one of the most important problems all over the world. However, quantitative research about ground subsidence due to earthquake that particularly occurred in urban area was not well studied. To prevent and minimize critical damage caused by subsidence, this study aims to construct hazard map to predict susceptible subsidence place in East area of Sapporo, using geographic information system (GIS) and frequency ratio (FR) model. To determine major factors related to ground subsidence, spatial databases were constructed from geological map, slope data, land use map, borehole data, precipitation data, railroad and subway line data and earthquake information data. Weight of each factors were estimated by FR model to analyze degree of subsidence hazard and construct subsidence hazard map. Constructed subsidence susceptibility map was compared with reported actual ground subsidence area for verification and showed prediction accuracy of 85.17%. This result showed sufficient possibility for reliable susceptibility mapping of ground subsidence using GIS and FR model.
1. Introduction
Currently, ground subsidence is one of the most important disaster all over the world. Ground subsidence can occur in various area but especially in urban areas, it can cause considerable damage to human lives and properties. Ground subsidence occur by natural processes like dissolution of limestone, earthquake, groundwater-related subsidence and faulting. Also caused by human activities such as activity of mining, extraction of natural gas. In Japan, earthquakes have occurred on a large or small scale every year. In the past 10 decades (2009–2019), there have been 70 times major earthquakes (Meteorological agency of Japan). Earthquake is one of the major ground subsidence triggers as mentioned above. As a result of earthquake, ground subsidence has occurred and caused serious damages. In most cases, as a countermeasure, it had been performed reinforcement after ground subsidence occurred and it cost more and difficult to cover completely in particular in urban areas. There have been a number of studies regarding ground subsidence using GIS and quantitative analysis methods. Logistic regression model and GIS was applicated for the assessment of ground subsidence hazard (Dai et al. Citation2001; Kim et al. Citation2006; Park et al. Citation2014). Choi et al. (Citation2007) and Oh et al. (Citation2011) predicted areas vulnerable to ground subsidence near abandoned underground coal mine using frequency ratio (FR) model with GIS. Also, Choi et al. (Citation2010) applicated fuzzy operator to susceptibility estimations of coal mine subsidence in Korea. Kim et al. (Citation2009) and Lee et al. (Citation2012) constructed hazard map for presumptive ground subsidence around abandoned underground coal mine using artificial neural network with GIS. Kyriaki et al. (Citation2013) constructed Karst collapse susceptibility map using a multivariate statistical method and GIS in a rapidly growing urban area. Pradhan et al. (Citation2014) estimated sinkhole type land subsidence hazards using GIS and remote sensing techniques. Perrin et al. (Citation2015) applied weight of evidence model for karst subsidence hazard mapping. Support vector machine model was used for mapping of land subsidence susceptibility in Kerman province, Iran (Abdollahi et al. Citation2019). Also, Mohammady et al. (Citation2019) compared weight of evidence model and support vector machine model to assess subsidence susceptibility in Semnan plain, Iran. Bianchini et al. (Citation2019) evaluated ground subsidence susceptibility in the Grosseto plain of Tuscany region, Italy by applying FR and fuzzy logic operator. Rehman et al. (Citation2020) analyzed mining subsidence susceptibility in Raniganj coalfield using FR, statistical index and Mamdani fuzzy models. However, research about ground subsidence due to earthquakes and especially in urban areas has not been well studied. Therefore, this study aims to present ground subsidence susceptibility due to earthquakes in urban areas to prevent and minimize serious damage caused by ground subsidence. To accomplish this goal, raster type of spatial databases of lithology, slope, land use, ground water level, precipitation, railroad and subway line, intensity of earthquake (MMI) were constructed. Constructed seven factors were used to analyse relationship between the ground subsidence and weights for each of factors which were calculated by FR model. This result showed major influential factors on ground subsidence. Using calculated weights of each factors, ground subsidence susceptibility map (GSS map) was constructed by ArcGIS pro software and verification was performed by area under curve (AUC) method. The findings of this research provide most influential factors on ground subsidence in urban area related with one of the current major earthquake and showed degree of vulnerability on ground subsidence. Also, for more reliable result of susceptibility mapping of ground subsidence in big cities, much of borehole databases which are essential for assessment of soil liquefaction by earthquake were used. The results of this study could be used for the disaster risk reduction and management in urban areas related with ground subsidence and earthquake.
2. Study area
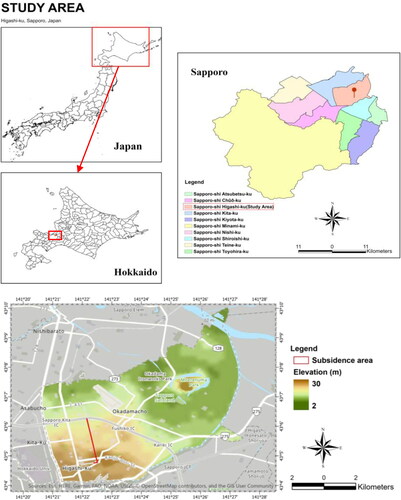
Study area, Higashi-Ku (East area) of Sapporo, is one of the 10 wards in Sapporo, Hokkaido, Japan. And Sapporo is capital city of Hokkaido Prefecture and its Ishikari Subprefecture. Study area is located in the southwest part of Ishikari Plain and the alluvial fan of the Toyohira River, a tributary stream of the Ishikari River. Higashi-Ku lies between 43°4'8"N − 43°10'3"N and 141°20'35"E − 141°27'25"E. And total study area is 56.97 km2. Hokkaido is one of the most earthquake-prone areas in Japan and there have been 93 earthquakes with over 6 Modified Mercalli Intensity scale (MMI) in past 10 decades (Meteorological agency of Japan). Accordingly, as one of the damages from earthquake, there has always been danger of ground subsidence in this area. On 6th September 2018, great earthquake (2018 Hokkaido Eastern Iburi earthquake, Maximum MMI 12) occurred in Iburi Subprefecture, southern Hokkaido. Result of the earthquake, there were 42 confirmed deaths and 762 people were injured. Also, the earthquake caused serious damage of properties and total damage was estimated at around 114.5 billion yen (Japanese Geotechnical Society Citation2019). Study area has also damaged by ground subsidence due to the earthquake and estimated maximum MMI was 9. In the study area, around 4 km of subsidence and road damage has occurred. According to geologic columnar section of this area (Consulting company of Utsuki Geo Solution), ground contains organic soil, clay and silt with very small N values, and sand with N values of 10 or less are deposited to a depth of 12 to 20 m. And also, the layer of peat or organic soil is deposited around 2 to 3 m close to the surface. Reported subsidence location was consistent with the location of the Toho subway lines. It can be considered that subsidence and damage was concentrated on the subway line. The location map of study area with ground subsidence site are shown in .
Figure 1. Study area with ground subsidence location map. World topographic map. Sources: Esri, HERE, Garmin, FAO, NOAA, USGS, © OpenStreetMap contributors and the GIS User Community.
3. Data
Many studies have identified major factors causing ground subsidence in mine site or abandoned mines (Waltham Citation1989; Singh and Dhar Citation1997). However, important factors are not yet clearly defined regarding ground subsidence in urban areas. In this study, seven factors were considered to identify major factors that contribute to ground subsidence and to construct ground subsidence susceptibility map (GSS map). Considered seven factors are including lithology, slope, land use, ground water level, railroad and subway line, precipitation and intensity of earthquake (MMI). For this purpose, GIS database of each factors were constructed after extracting data of target area from raw data using ArcGIS Pro 2.4.3 software. Constructed spatial database of each factors are listed in and as shown in . Lithology data of study area were extracted from geological map produced by Geological Survey of Japan (AIST) at a scale of 1:200,000. Slope, land use, railroad and subway line and climatological normal precipitation databases were collected from topographic map and land use map supplied by National Land Information Division (MLIT of Japan). Categories of land use were classified into eight types (). MMI data were collected and constructed from earthquake information provided by meteorological agency of Japan. Inverse distance weighting (IDW) interpolation method was used with the point MMI data of 20 regions which were located around study area. Ground subsidence area occurred by Eastern Iburi earthquake was collected using Google Earth Pro with data of location information from final report of ground subsidence disaster investigation team (Japanese Geotechnical Society). Then, this file was converted to GIS database format using ArcGIS Pro software. Constructed ground subsidence area data were used for GSS mapping and verification of prediction accuracy.
Figure 2. Constructed data of each factor. a: lithology, b: slope, c: land use, d: ground water level, e: distance from railroad and subway line, f: precipitation, g: MMI.
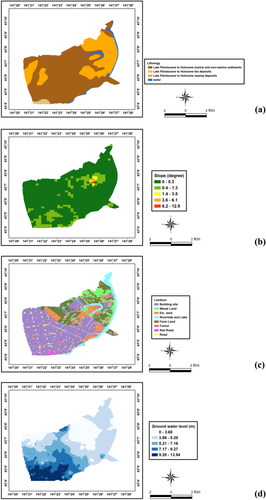
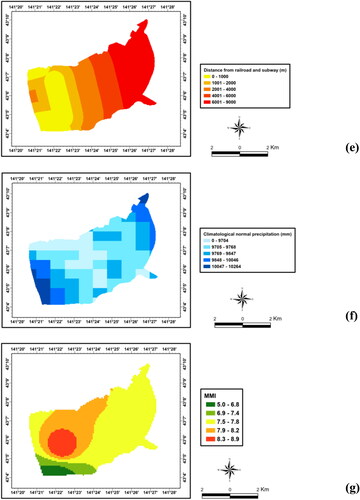
Table 1. Spatial database for the current research.
3.1. Borehole data
In this study, to extract data of ground water level for study area, borehole databases of Sapporo were used. Also, these data were used for understanding composition of ground for study area. Borehole data are one of the most important factors to assess soil liquefaction by earthquake. Also, the damage from ground subsidence is mostly critical to big cities than rural areas. Thus, it is very important to gather and utilize the borehole data for urban areas. Borehole databases were produced from Consulting company of Utsuki Geo Solution as mentioned above. Normally, it is hard to get borehole databases for urban areas. However, for the purpose of risk reduction and management in urban areas, researchers can get the borehole data from reliable agencies or companies. Moreover, by gathering borehole databases for other main cities not only Sapporo and systemizing it by sum of all the data, it can be applied approach of this study for real situation, more properly. shows flow of ground water level data extraction from raw databases (borehole data). For the first step, only ground water level data were extracted from 3 D type of borehole data and arranged as a table with information of longitude, latitude and ground water level (m) for Sapporo using Excel software. Extracted total number of data were 4814 for entire area of Sapporo city. Then, IDW interpolation method was used with 4814 ground water level data using ArcGIS software. From the results of IDW method, data were re-extracted for constructing GIS database of target area. Finally, layer of ground water level for study area was constructed with 605 borehole databases.
Figure 3. Flow of construction for GIS databases from raw data.
4. Methodology
4.1. Frequency ratio model
To predict and evaluate susceptibility of ground subsidence, it is necessary to analyse relationship between ground subsidence trigger factors and area where ground subsidence occurred. And this relationship could be deduced from relationship between ground subsidence trigger factors and area where ground subsidence has not occurred (Rasyid et al. Citation2016). In this study, FR model was applicated to identify closeness degree of relationship. FR model is a popular quantitative and probability analysis method which has been applied with reliable results to create disaster-related susceptibility maps. It is famous for its simple concept and straight forward calculation of the susceptibility index that can be readily performed in most widely-used GIS software (Intarawichian and Dasananda Citation2011). FR values of each factors were calculated by using EquationEquation (1)(1)
(1) .
(1)
(1)
Where, P(sf) number of pixels of ground subsidence within class c of factor f, ∑SP total pixels of ground subsidence area, P(cf) number of pixels in class c of factor f, and ∑CP total pixels of the area.
Calculated FR values of each factor are shown in and it indicate a higher FR value means that the factor has a higher influence on ground subsidence occurrence. With FR values of each factor, relative frequency (RF) was calculated by dividing FR of classes within a factor by total FR of the factor to normalize FR values from 0 to 1. After normalization, RF still has flaw of considering all conditioning factors as equal weight. To solve this problem and also consider mutual interrelationship among selected factors (weights of individual factors related with ground subsidence), prediction rate (PR) was calculated (Acharya and Lee Citation2019; Ullah and Zhang Citation2020).
(2)
(2)
Table 2. Calculated FR and RF values of each factor.
Using PR values, ground subsidence susceptibility index (GSSI) was calculated by combining PR values of each factor and RF values of each class as below:
(3)
(3)
Where, RF values of each class within factor,
PR values of each factor.
Finally, GSS map (Ground subsidence susceptibility map) was constructed using ArcGIS Pro software with calculated GSSI values.
5. Results and discussion
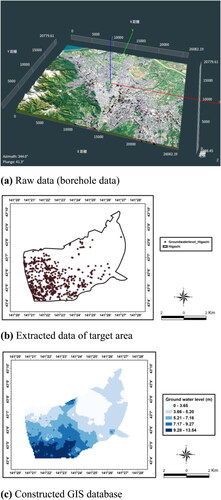
FR and RF values of all seven factors were calculated by using FR model as shown in . Considered seven factors in this study are lithology, slope, land use, ground water level, distance from railroad and subway line, precipitation (Rainfall) and intensity of earthquake (MMI). Also, to analyse weightage for seven factors and construct ground subsidence susceptibility map, PR values were calculated from RF.
In the case of lithology, only class of Late Pleistocene to Holocene marine and non-marine sediments had FR over 1 (1.07) and this result indicates having high ground subsidence probability. Also, FR of Late Pleistocene to Holocene swamp deposits class had FR value of 0.96 and it indicates less probability to ground subsidence than FR value greater than 1. Rest classes had FR value of 0.24 and 0, respectively, which means low probability or no likelihood of ground subsidence.
For degree of slope, higher FR values were shown as gradient increased up to 1.3 and peak FR value was 1.98 at degree of 0.4 to 1.3. Results of gradient from 1.4 to 12.9 were indicated very low probability of ground subsidence in the study area.
Land use is an important factor regarding ground subsidence hazard in the urban area, because of the risk of damage to properties and human lives is high. Land use factor was divided into subclasses as building site, waste land, etc. land, riverside and lake, farm land, forest, railroad and road. Among the classes, railroad and road classes were denoted very high subsidence probability of FR of 15.78 and 7.69, respectively. Also, the FR values were greater than 1 in the class of building sites, farm land and forest. This result indicates, at railroad and road are more prone to ground subsidence than other land use sites in this study area.
Subsidence probability for ground water level had high FR values at 5.21–7.16 and 7.17–9.27 m with ratio of 2.38 and 2.21, respectively, and this denotes that high probability of ground subsidence at this range of ground water level.
For distance from railroad and subway line, only had highest FR value of 2.77 from 0 to 1000 m and denoted very low probability over 1000 m. This result indicates susceptibility of ground subsidence is higher as closer to railroad or subway line. Also, this result shows agreement with reported actual ground subsidence area information.
In the case of precipitation, data of three-decade averages of climatological variables were used. FR values were higher as precipitation increase within range 0 to 9847 mm. And indicated highest probability of subsidence at the range of 9769 to 9847 mm which had FR value of 2.42.
For MMI, as intensity of earthquake increase, the FR values denoted higher from range of 7.5 to 8.9 in the area. Highest FR value of 12.47 were for class of 8.3 to 8.9 and this result indicates very high ground subsidence probability.
After preparation of all factor layers related with ground subsidence, to construct final ground subsidence susceptibility map of study area, PR value (weight) of each factor were calculated from prepared RF values using FR model. shows calculated weight of each factor and weight rank. Highest rank of factor was railroad and subway line and this means the factor has high influence to ground subsidence. MMI has second highest PR value after rank 1 factor. Slope and precipitation have some influence to predict ground subsidence occurrence. Lithology, land use and ground water level have low contribution to subsidence than other four factors in this study. From these results, three thematic maps were constructed to analysis how the factors will be affected to prediction of final ground subsidence susceptibility as shown in . This analysis was performed except for lowest weight data of lithology. shows GSSI of overlaid layers of land use and ground water level. Calculated GSSI values were from 0 to 109.33. In this map, GSSI values were high (values from 72.89 to 109.33) along the roads. Also, index from 36.44 to 72.89 was showed in the building sites with high ground water level. This result indicates that roads and building sites where located on the areas with high ground water level are more vulnerable to ground subsidence. And this information was reflected in the final GSS map.
Figure 4. Thematic map of overlaid data for land use and ground water level.
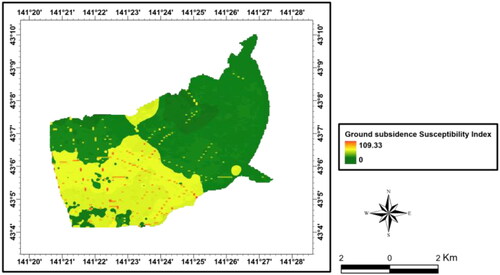
Figure 5. Thematic map of overlaid data for slope and precipitation.
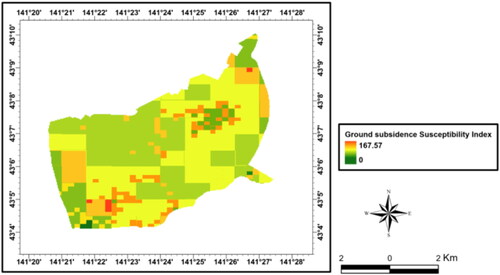
Figure 6. Thematic map of overlaid data for railroad and subway line and MMI.
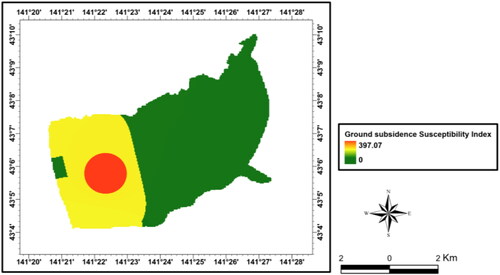
Table 3. Weight of each factor and rank.
Overlaid layers of slope and precipitation had GSSI values from 0 to 167.57 as shown in . High GSSI values (111.71–167.57) were showed at very low degree of slope and areas with moderate amount of rainfall. But the entire of study area is a flat area with almost no slope and also there is not much precipitation annually. For this reason, slope and precipitation had little effect on ground subsidence occurrence in this study.
shows overlaid factor layers of railroad and subway line and MMI. These two factors had highest weights among the seven factors and ground subsidence susceptibility index was from 0 to 397.07. This result showed the areas closer to railroad and subway line and had high intensity of earthquake are more prone to occur ground subsidence than other areas. Thus, it also showed that areas where farther from railroad and subway line and has low MMI are relatively has lower susceptibility index. Accordingly, this result had most influence to the construction of final ground subsidence susceptibility map.
Using PR weight of each factor, GSSI was calculated by EquationEquation (3)(3)
(3) and finally, ground subsidence susceptibility map was constructed as shown in using ArcGIS Pro 2.4.3 software. Range of ground subsidence susceptibility index was from 29. 38 to 635.33 in this study. Also, ground subsidence susceptibility index was divided in five classes as follows: Very low (29.38–149.77), low (149.77–271.16), moderate (271.16–392.55), high (392.55–513.94) and very high (513.94–635.33).
Figure 7. Constructed ground subsidence susceptibility map of study area.
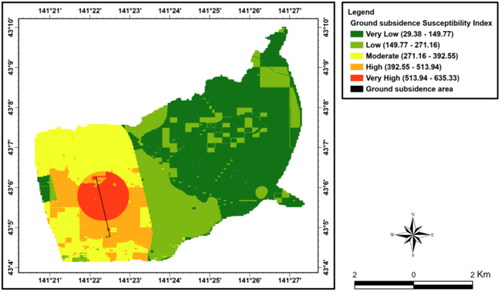
In this study, to evaluate the susceptibility of ground subsidence, FR model was applied because it can provide the probability of subsidence by calculating weights of each factors from the relationship between factors and area where ground subsidence has been occurred. Also, FR model is well known and applied as a quantitative and probability analysis method with its simple concept and straightforward calculation of susceptibility index. Moreover, this method has been frequently applied with GIS and showed reliable results to create disaster-related susceptibility maps (Intarawichian and Dasananda Citation2011). This method could be applied along with other quantitative approaches as comparison. And this could provide more effective approach for the assessment of susceptibility of ground subsidence. From the constructed GSS map, analysis result shows that actual ground subsidence area is located in very high and high area of prone to ground subsidence. Also, this result indicates that areas where located in near the subway line and influenced by earthquake with higher intensity are more vulnerable to ground subsidence as same with the results of overlay analysis.
6. Verification of ground subsidence susceptibility map
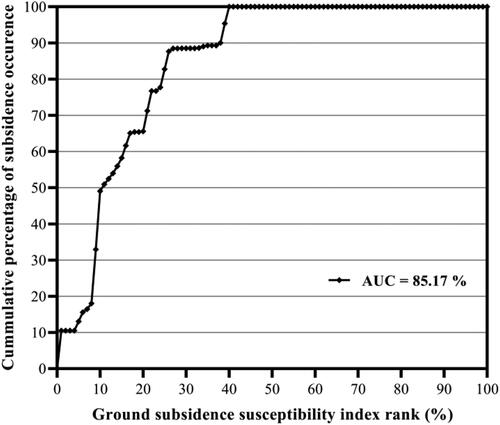
For verification, constructed ground subsidence susceptibility map was compared with actual ground subsidence area information data and AUC method (Lee and Dan Citation2005; Lee et al. Citation2012) was applied. Predicted output using FR method was compared with its expected changes. For this, rate curves were created using GSSI values from constructed GSS map. This rate curves explain how well the method and factors predict ground subsidence. To obtain rate curves, calculated GSSI of all grids in study area were sorted in descending order. Then, newly sorted grid values were divided into 100 classes with accumulated 1% intervals. For next step, AUC was calculated to compare the results and total area of 1 denotes perfect prediction accuracy for all cases. Also, assessment of prediction accuracy has performed qualitatively using AUC method. Results of verification are shown in . This result indicates that 49% of all ground subsidence has occurred in 10% of study area where having high ground subsidence susceptibility index rank. Also, in 25% of study area, occurred 85.17% of all ground subsidence and all of ground subsidence has occurred in 40% of study area. Calculated total AUC value was 8516.56 and this means prediction accuracy of 85.17% as result of verification.
Figure 8. Verification result and accuracy of constructed final ground subsidence susceptibility map.
7. Conclusion
Ground subsidence occurrence in urban areas can causing serious damage to both of human life and facilities. In this study, ground subsidence susceptibility mapping was performed to predict and minimize this damage from ground subsidence especially caused by earthquake. For this purpose, FR model method and GIS software were applied. Seven factors which related with causing ground subsidence were chosen in this study, as below; lithology, slope, land use, ground water level, distance from railroad and subway line, precipitation and intensity of earthquake. All layers of each factor were constructed using GIS and FR model was applicated to identify closeness degree of relationship between ground subsidence trigger factors and actual ground subsidence area. From the results, it was showed that factor of distance from railroad and subway line has highest influence to ground subsidence with weight of 2.12. MMI was also one of major trigger factor as weight of 1.99. Verification was performed using AUC method and the result showed 85.17% prediction accuracy of constructed ground subsidence susceptibility map. This study has showed major factors related with ground subsidence occurrence by earthquake in the study area and good prediction accuracy of constructed susceptibility map. Ground subsidence susceptibility map can be used as a material of preventive measure against ground subsidence hazard to reduce scale of damage effectively. Moreover, this map will be very helpful to city planning, urban redevelopment projects and reinforcement works in urban areas.
Data availability statement
The lithology data that support the findings of this study is openly available from the Geological Survey of Japan (AIST) at https://www.aist.go.jp. Data of slope, land use, railroad and subway line and precipitation are openly available from the National Land Information Division (MLIT of Japan) at https://nlftp.mlit.go.jp/ksj. MMI data are openly available from the Meteorological Agency of Japan at http://www.jma.go.jp/jma/index.html. Information of ground subsidence area is openly available from the Japanese Geotechnical Society at https://www.jiban.or.jp. Due to its proprietary nature, ground water level data cannot be made openly available. Further information about the data and conditions for access are available from the author, Shinji Utsuki, upon reasonable request.
Disclosure statement
No potential conflict of interests was reported by the authors.
References
- Abdollahi S, Pourghasemi HS, Ghanbarian GA, Safaeian R. 2019. Prioritization of effective factors in the occurrence of land subsidence and its susceptibility mapping using an SVM model and their different kernel functions. Bull Eng Geol Environ. 78(6):4017–4034.
- Acharya TD, Lee DH. 2019. Landslide susceptibility mapping using relative frequency and predictor rate along araniko highway. KSCE J Civ Eng. 23(2):763–776. DOI: https://doi.org/10.1007/s12205-018-0156-x
- Bianchini S, Solari L, Soldato MD, Raspini F, Montalti R, Ciampalini A, Casagli N. 2019. Ground subsidence susceptibility (GSS) mapping in Grosseto Plain (Tuscany, Italy) based on satellite InSAR data using frequency ratio and fuzzy logic. Remote Sensing. 11(17):2015.
- Choi JK, Kim KD, Lee S, Kim IS, Won JS. 2007. Prediction of ground subsidence hazard area using GIS and probability model near abandoned underground coal mine. Jour of The Kore Socie of Econ and Environ Geol. 40(3):295–306.
- Choi JK, Kim KD, Lee S, Won JS. 2010. Application of a fuzzy operator to susceptibility estimations of coal mine subsidence in Taebaek City, Korea. Environ Earth Sci. 59(5):1009–1022.
- Dai FC, Lee CF, Li J, Xu ZW. 2001. Assessment of landslide susceptibility on the natural terrain of Lantau Island, Hong Kong. Environ Geol. 40(3):381–391. doi: https://doi.org/10.1007/s002540000163
- Intarawichian N, Dasananda S. 2011. Frequency ratio model based landslide susceptibility mapping in lower Mae Chaem watershed, Northern Thailand. Environ Earth Sci. 64(8):2271–2285.
- Japanese Geotechnical Society. 2019. Final report of 2018 Hokkaido Eastern Iburi earthquake by the ground disaster investigation team. p. 70–90. https://www.jiban.or.jp/file/saigai/H30_Hokkaido_EQ_FinalReport.pdf , Japanese Geotechnical Society, Tokyo, Japan
- Kim KD, Lee S, Oh HJ. 2009. Prediction of ground subsidence in Samcheok City, Korea using artificial neural networks and GIS. Environ Geol. 58(1):61–70.
- Kim KD, Lee S, Oh HJ, Choi JK, Won JS. 2006. Assessment of ground subsidence hazard near an abandoned underground coal mine using GIS. Environ Geol. 50(8):1183–1191.
- Kyriaki PV, George DB, Hariklia DS, George K, Kostas M. 2013. Karst collapse susceptibility mapping considering peak ground acceleration in a rapidly growing urban area. Eng Geol. 158:77–88. doi: https://doi.org/10.1016/j.enggeo.2013.02.009
- Lee S, Dan NT. 2005. Probabilistic landslide susceptibility mapping in the Lai Chau province of Vietnam: focus on the relationship between tectonic fractures and landslides. Environ Geol. 48(6):778–787.
- Lee S, Park I, Choi JK. 2012. Spatial prediction of ground subsidence susceptibility using an artificial neural network. Environ Manage. 49(2):347–358.
- Mohammady M, Pourghasemi HR, Amiri M. 2019. Assessment of land subsidence susceptibility in Semnan plain (Iran): a comparison of support vector machine and weights of evidence data mining algorithms. Nat Hazards. 99(2):951–971.
- Oh HJ, Ahn SC, Choi JK, Lee S. 2011. Sensitivity analysis for the GIS-based mapping of the ground subsidence hazard near abandoned underground coal mines. Environ Earth Sci. 64(2):347–358.
- Park IH, Lee J, Lee S. 2014. Ensemble of ground subsidence hazard maps using fuzzy logic. Central European J Geosci. 6:207–218. doi: https://doi.org/10.2478/s13533-012-0175-y
- Perrin J, Cartannaz C, Noury G, Vanoudheusden E. 2015. A multicriteria approach to karst subsidence hazard mapping supported by weights-of-evidence analysis. Eng Geol. 197:296–305.
- Pradhan B, Abokharima MH, Jebur MN, Tehrany MS. 2014. Land subsidence susceptibility mapping at Kinta Valley (Malaysia) using the evidential belief function model in GIS. Nat Hazards. 73(2):1019–1042.
- Rasyid AR, Bhandary NP, Yatabe R. 2016. Performance of frequency ratio and logistic regression model in creating GIS based landslides susceptibility map at Lompobattang Mountain, Indonesia. Geoenviron Disasters. 3(1):19.
- Rehman S, Sahana M, Dutta S, Sajjad H, Song X, Imdad K, Dou J. 2020. Assessing subsidence susceptibility to coal mining using frequency ratio, statistical index and Mamdani fuzzy models: evidence from Raniganj coalfield, India. Environ Earth Sci. 79(16):380.
- Singh KB, Dhar BB. 1997. Sinkhole subsidence due to mining. Geotech Geol Eng. 15(4):327–341.
- Ullah K, Zhang J. 2020. GIS-based flood hazard mapping using relative frequency ratio method: a case study of Panjkora River Basin, eastern Hindu Kush, Pakistan. Plos One. 15(3):e0229153.
- Waltham AC. 1989. Ground subsidence. New York: Blackie; p. 49–71.