
 ?Mathematical formulae have been encoded as MathML and are displayed in this HTML version using MathJax in order to improve their display. Uncheck the box to turn MathJax off. This feature requires Javascript. Click on a formula to zoom.
Abstract
Rising floodwaters in the Blue Nile (BN) and White Nile (WN) tributaries continually affects people’s lives and the safety of infrastructures in Khartoum, the capital of Sudan. Recently, floods have covered a wide area of Khartoum and destroyed many buildings and bridges. We conducted this study to evaluate and predict the flood effects around BN and WN in Khartoum to make recommendations in view of upcoming flood disasters. Land-use/land-cover (LULC) changes after floods that occurred in 2014, 2016, and 2020 were evaluated and LULC was predicted for 2024 by applying a combination of remote sensing (RS) and geographic information-system (GIS) techniques. We also evaluated the expected hazard due to floods. Our results showed that the agricultural, built-up, and water changes around BN were 0.30%, 0.25%, and 0.05%, respectively, for the period 2014–2016, and, that changes for the period 2016–2020 were 3.38%, 3.68%, and 7.28%, respectively. Correspondingly, the agricultural, built-up, and water changes around WN were 5.56%, 3.26%, and 8.02% during 2014–2016 and 13.79%, 5.62%, and 21.40% during 2016–2020. The change estimation indicates that the most flood effects in the region occurred around WN, possibly covering the whole areal extent of Khartoum city. The area covered by waterbodies may decrease by 4.18% (BN) and 20.35% (WN) during 2020–2024, based on RS–GIS evaluation, but hydraulic evaluation shows that the expected hazard due to floods in Khartoum is high. Thus, flood-risk assessments should take into account both physical hazard and the distribution of the population across the whole area of Khartoum.
1. Introduction
In recent times, climate change has directly or indirectly influenced people all over the world. Many people reportedly have died, and much construction and many infrastructures have been damaged owing to the effects of natural disaster (Davies Citation2016; Ritchie and Roser Citation2019; OPERNICUS Citation2020). Flooding is one of the common natural disasters that affect people and infrastructures all across the world (Mousavi et al. Citation2019; Andreadakis et al. Citation2020); in Sudan, it has forced people to move and change their activities (Abdel Hamid et al. Citation2020). Heavy rainfall and the increasing water capacity of the Nile have caused flash floods in different places in Sudan (OCHA Citation2019; OPERNICUS Citation2020; UN 2020). Although water extensions have affected the land around the Nile tributaries in Khartoum in past years, rising population in this city, as in other cities worldwide, will make residents increasingly vulnerable to annual flood disasters by 2050 (UNU 2004; Matheswaran et al. Citation2019; Abdel Hamid et al. Citation2020). Therefore, in this study we have aimed to provide recommendations for decreasing future floods’ effects in Khartoum.
Previous studies in Sudan evaluated and predicted floods effects over different States. Fadul et al. (Citation2019) evaluated the effects of floods on irrigation systems in Kassala State, and they recommended that some effort should be applied to improve technical, financial, and management aspects of floodwater control and mitigation. Abbas and Routray (Citation2013, Citation2014) evaluated health risks related to floods in Kassala State. Elsafi (Citation2014) did flood assessments for Dongola town by using soft computing techniques to evaluate flood data and design different flood scenarios, the results of which showed that these techniques can be applied for disaster prediction. Williams et al. (Citation2015) evaluated the environmental and water-level changes on the land at the confluence of the Blue Nile (BN) and White Nile (WN) in Khartoum and central Sudan; they showed that the climate was wetter during times of high WN floods. Khartoum was frequently influenced by different floods, and the consequent disasters were evaluated and discussed. Prior studies have shown that this area is particularly at risk from flooding (McCarthy et al. Citation1994; Billi and Ali Citation2010; Mahmoud et al. Citation2014; Mahmood et al. Citation2017; Abdel Hamid et al. Citation2020). In this study, we have attempted to provide more information on the land-use/land-cover (LULC) change in Khartoum and to assess the extent to which such change is influenced by the yearly flood disasters.
Recently, the combination of remote sensing (RS) and geographic information-system (GIS) techniques has been a powerful approach for evaluating climate-change effects, especially those involving LULC (Elhaja et al. Citation2017; Buğday and Buğday Citation2019; Mustafa et al. Citation2019; Abd El-Hamid Citation2020; Abd El-Hamid et al. Citation2020; Hussein et al. Citation2020; Rajendran et al. Citation2020). Hassaballah et al. (Citation2017) evaluated LULC changes and the impact on BN streamflow, and they concluded that the rate of streamflow change is strongly correlated to LULC. Billi and Ali (Citation2010) found that sedimentation affects BN streamflow velocity. Therefore, BN floods should be expected to change land use, especially after constructing the Grand Ethiopian Renaissance Dam. Similarly, Elhaja et al. (Citation2017) used RS–GIS to evaluate land use and change around WN, and their results showed that the soil characteristics were influenced by the LULC changes attributable to past flooding. Other studies have been applied to the WN and BN areas, and the results show that the floods still rise and fall with the annual rainy season in the Ethiopian highlands (NASA Citation2001, 2007, 2020). Furthermore, drought and flooding have affected the LULC around rivers all across the world (Matheswaran et al. Citation2019; Näschen et al. Citation2019; Abd El-Hamid Citation2020; Andreadakis et al. Citation2020; Dibaba et al. Citation2020). Abdel Hamid et al. (Citation2020) evaluated Khartoum environmental effects on the city and concluded that poor infrastructure and lack of preparedness were the main causes of disasters from floods in Sudan. Although previous studies and researchers’ efforts concluded many significant results and recommendations for the effects of WN and BN floods on Khartoum city, the floods continue to threaten the city and affect people and structures (Zerboni Citation2020; Zerboni et al. Citation2020).
Therefore, we used RS and GIS to evaluate the LULC trend around WN and BN for a better understanding of flooding effects over the course of seven years in the city of Khartoum. We also investigated transition probability and predicted land-use changes to give more recommendations to help prevent disasters that may threaten the city in the future. Hydraulic modelling and digital elevation model (DEM) data were also used to assess flood effects in Khartoum. The specific objectives of this study are to (1) assess and predict the change of LULC around the BN and WN, (2) study the change in vegetation and water around the BN and WN, and (3) map the flood-prone areas using hydrology tools.
2. Study area and floods history
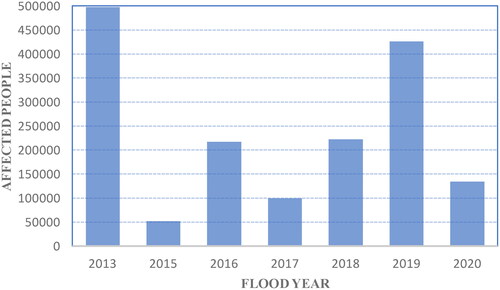
According to the UN Office for the coordination of humanitarian affairs (OCHA) and Sudan Metrological Authority (SMA), the floodwaters yearly affect the people in Sudan. presents people were affected by floodwaters during 2013–2020, and the high effectiveness of floods was happened in 2013 and 2019. As well as, the structures are affected during floods seasons (e.g. in 2019, 37 health facilities, 1,263 education facilities and 10 water facilities were damaged (OCHA Citation2019)). According to OCHA and SAM, exhaustive heavy rains during August and September caused above-average flooding and waterlogging in a significant number of the significant flood-inclined zones of Sudan (OCHA Citation2019). In 2019, the White-Nile state has been highly affected (147,240 affected people), followed by Kassala and Khartoum states with 40,435 and 32,060 affected people, respectively (OCHA Citation2019). In 2020, Kassala state has been highly affected (26,149 affected people), followed by Red-Sea state with 19,620 affected people (OCHA 2020).
Figure 1. People affected by floods in Sudan (OCHA Citation2019, 2020).
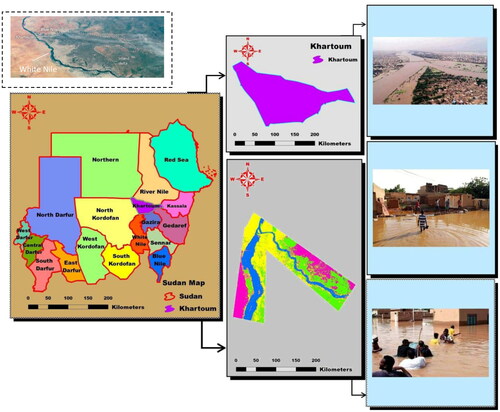
Khartoum is the capital city of Sudan; White Nile (WN) and Blue Nile (BN) are connected at north of the city and function as a single stream after that. According to the International Charter Space and Major Disasters, Khartoum was not affected during the 2016 floods (UNOSAT 2016). In the 2020 floods, many people have been affected in Khartoum, as well, many buildings and infrastructures have been damaged (UN 2020). Thus, this study focussed on the surrounding areas of WN and BN to evaluate floodwaters performances and give a recommendation for upcoming floods. shows the study area. The topographic and inland delta of the study area is also presented in the figure. In this paper, satellite images of Landsat 8 OLI (operational land imager) have been taken for the years 2014, 2016 and 2020 to evaluate floodwaters effect of 2013, 2015 and 2020 floods.
Figure 2. Study area and flood disasters effectiveness.
3. Data and methods
In the current study, RS and GIS were used to evaluate and predict the effect of the floodwaters based on change of LULC evaluation and hydraulic analysis. For that, the multispectral Landsat-8 OLI images were radiometrically and atmospherically corrected from the errors and lines. The images were downloaded from the Earth Resources Observation and Science Centre of the US Geological Survey, as presented in . These images were acquired as presented in to assess the floodwaters period 2013–2020; this according to the heavy raining months in August to September. In addition, the choice of these specific periods was selected due to the availability of a time-series with limited cloud-cover and flood seasons in the study area. These images comprise eight multispectral bands with 30 m spatial resolution including Coastal (0.43–0.45 µm), Blue (0.00–0.51 µm), Green (0.53–0.59 µm), Red (0.64–0.67 µm), Near-IR (0.85–0.88 µm), SWIR 1 (1.57–1.65 µm), and SWIR 2 (2.11–2.29 µm) with a spatial resolution of 30 m.
Table 1. Landsat-8 images used in this study.
3.1. LULC Classification
All the images were processed independently of each other using a maximum likelihood classification without any threshold, in order to produce LULC maps. In this study, LULC were wisely produced to represent five LULC classes including built-up areas, bare lands, cultivate areas, water bodies and agriculture lands depending on Google earth and references data. All the change detection analyses were then performed in post-classification. It is widely recognized in the literature that this approach has the advantage of minimizing the problem of radiometric calibration between dates (Coppin et al. Citation2004). Moreover, as long as the training samples are derived only from the classified image itself, atmospheric correction is unnecessary (Gong et al. Citation2008). In addition, the thermal band of Landsat imagery was included in the classification process because it was able to improve the separation of the classes in the investigated area. Furthermore, the spectral indices of water and vegetation were determined to evaluate the flood effects. Here, the Normalized Difference Water Index (NDWI) and Normalized Difference Vegetation (NDVI) were calculated and evaluated. NDVI and NDWI were used to extract water and vegetation types, respectively. The value of these indices varies from −1 to 1, depending on the amount of water and vegetation. These spectral indices were calculated using the Landsat surface reflectance based on the following equations and spectral bands (Abd El-Hamid Citation2020):
(1)
(1)
3.2. LULC transition and prediction
Based on changes in LULC, transition matrix of LULC reflects the degree of every class conversion to another type in the study area. It is a mathematical and statistical method that studies the changes among types of LULC. A new matrix was applied for assessing the trend of land use type reflection in the study area (Hu et al. Citation2015; Abd El-Hamid Citation2020). This method was applied using ArcGIS10.5 and the function of PivotTable in Excel. The transition matrix simulates the major changes, which shows all multi-directional probabilities of change between all the mutually exclusive land-cover types (Biondini and Kandus Citation2006). The probability of a transition matrix can be calculated as follows (Biondini and Kandus Citation2006):
(2)
(2)
where,
is the land transition probability from landscape i to j;
is the number of observations in row i and column j of image matrix;
is the total marginal of column j.
Moreover, Cellular Automata-Markov chain (CA–Markov) models represent a hybrid model of the Cellular Automata and Markov models (Subedi et al. Citation2013). Markov approach has been usually applied in ecological modelling (Brown et al. Citation2000). Markov model considers past states to predict how a particular variable changes over different classes (Muller and Middleton Citation1994). The applicability of Markov model in LULC modelling is promising because of its ability to quantify not only the states of conversion between land-use types but also the rate of conversion among the land use types (Sang et al. Citation2011). This model effectively combines the potential advantages of the long-term predictions of the Markov model and the ability of the Cellular Automata (CA) model to accurately simulate the spatial variations of land cover. CA-based models have an obvious capability to denote nonlinear, spatial and stochastic processes. Markov chain analysis was used to simulate complex processes such as LULC. It is mainly used to study the transition probability between an initial state and a final state to wisely determine the transition trend among different land. The prediction of future land-use changes can be calculated based on a conditional probability formula by using the following equation (Subedi et al. Citation2013):
(3)
(3)
Where is the land use at a current time t and
is the land use at a predicted time t + 1.
Herein, the accuracy assessment should be evaluated to assess the LULC changes and predicting accuracy. Herein, Kappa coefficient (K) was applied in this study; it is commonly used to evaluate the classification accuracy of production maps by constructing a confusion matrix between reference and classified pixels (Hussein et al. Citation2020; Nguyen et al. Citation2020).
3.3. Hydrology analysis
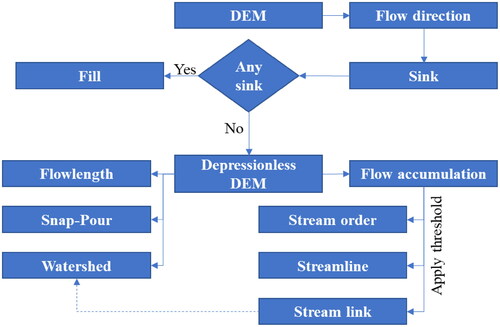
Terrain plays a key role in landscape pattern formation, particularly in the areas prone to natural hazard as the flood. Hydrologic and surface characteristics were identified for further identification of flood hazard effects based on DEM of the study area. The 10 m DEM resolution utilized in this study, which provided good results for topographic changes in the study area. In ArcGIS, there are many factors that can be considered to evaluate the hydraulic model of water flow. This model directs water from a consider given cell to flow into only one adjacent cell (Ozdemir and Bird Citation2009). The flow is encoded to correspond to the orientation of one of the eight cells that surround the cell in the middle as 1, 2, 4, 8, 16, 32, 64, and 128. The resulting flow direction is presented in .
Figure 3. Flow direction in the selected pour point model.

In this study, the criteria of the slope, Surface roughness (SR), Curvature topographic (CT), Topographic wetness index (TWI), flow accumulation and Drainage density (Dd) index were determined and evaluated. The TWI and Dd can be calculated as follows (Horton Citation1945; Beven and Kirkby Citation1979; Ozdemir and Bird Citation2009; Abdel Hamid et al. Citation2020):
(4)
(4)
(5)
(5)
where,
and
are the specific catchment area and the slope angle, respectively, with assuming the properties of the soil as uniform. L and F are the length of the waterway in km and contributing drainage area in km2, respectively. n denotes the number of waterways.
The direction of flow is determined by the direction of steepest descent, or maximum drop, from each cell, as presented in . Eight valid output directions are available, related to the eight adjacent cells to which flow could travel (eight direction flow model). Before deriving the flow direction, a fill-DEM technique was estimated with a fill tool in order to fill sinks that were considered most likely to be data errors/imperfections. The Snap-Pour-Point tool is used to ensure the selection of points of high accumulated flow when delineating drainage basins using the Watershed tool. Snap Pour Point will search within a snap distance around the specified pour points for the cell of highest accumulated flow and move the pour point to that location. The flood risk factors, slope and curvature, were derived from the elevation data set, whereas the drainage density value for catchments with only intermittent streams would be equal to zero. Higher drainage density values indicate lower infiltration rates and higher surface flow velocity (Yalcin Citation2008). A high drainage density is often related to a high sediment yield transported through the river network, high flood peaks, steep hills, and low suitability for agriculture. Surface roughness is the most significant variable in simulating and detecting flash flood simulation and analysis. Low surface roughness causes little penetration of water in the soil pores, therefore the damage reduced under high surface roughness (Abdel Hamid et al. Citation2020). The details of hydraulic analysis indices can be found in (Paul et al. Citation2017; Mattivi et al. Citation2019; Abdel Hamid et al. Citation2020). The flood delineation processing is presented in .
Figure 4. Flowchart of flood delineation.
4. Results and discussion
4.1. Land-use/land-cover evaluation and prediction
We found and characterized land changes within five LULC classes around BN ( (left); ) and WN ( (right); ), which we assessed during multiyear monitoring, focussing on the years 2014, 2016, and 2020.
Figure 5. LULC of study areas for 2014, 2016 and 2020 for the (left) BN and (right) WN.
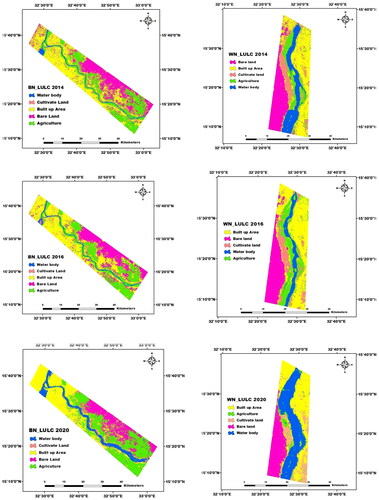
Table 2. LULC changes around BN.
Table 3. LULC changes around WN.
For evaluating the LULC around BN, we found that cultivated land has not changed much during the monitoring period: The cultivated area as percentages of the total land area were 1.47% in 2014, 2.74% in 2016, and 1.66% in 2020. The built-up areas increased by 0.25% during the period 2014–2016 and then decreased by 3.68% during the period 2016–2020. The area percentages of agricultural lands changed from 29.08% in 2014, to 29.38% in 2016, and to 32.76% in 2020. At the same time, waterbodies decreased by 0.05% during 2014–2016 and then increased to 7.28% during 2016–2020. Bare land decreased by 1.76% during 2014–2016 and 5.90% during 2016–2020 periods. These results indicate that the 2019 and 2020 floods highly affected residents and buildings. Clearly, houses that were near the Nile were destroyed, and people changed that area to agricultural use. People also attempted to use bare land that was far from the Nile, and, because the flood effects in the southern BN area were extremely high, the built-up areas decreased there but increased at the Niles confluence. However, the spread or growth of waterbodies results in a high probability of more flood-related disasters in the upcoming seasons around the BN.
For evaluating the LULC around WN, we found that the built-up area increased by 3.26% during 2014–2016 and then decreased by 5.62% during 2016–2020. Bare land decreased by 1.8% during 2014–2016 and by 2.48% during 2016–2020, while cultivated lands increased by 0.99% during 2014–2016 and 0.49% during 2016–2020. Agricultural lands were highly affected by the 2019 and 2020 floods; their areal extent increased by 5.56% during 2014–2016 and then decreased by 13.79% during 2016–2020. At the same time, the waterbodies’ extent decreased by 8.02% during 2014–2016 and then increased by 21.4% during 2016–2020. This implies that the disaster effects around WN were probably high. Furthermore, the government should consider the waterbody changes for upcoming floods, which may spread to more areas in Khartoum State. We also found that the southern areas were highly affected by the flood seasons. The built-up areas have increased in the northern WN area and decreased in the southern. The extension of open-water areas has affected the distributions of the study classes. Almost all agricultural areas around WN were destroyed when they were inundated by floodwaters.
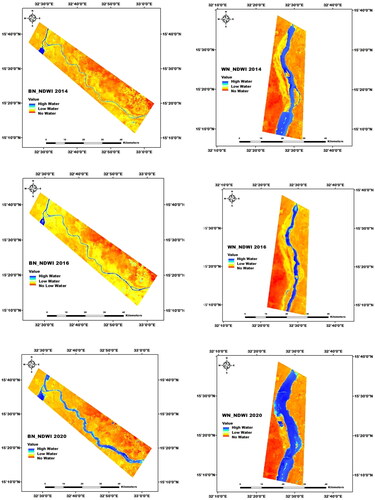
Changes in the vegetation and water cover were discerned by mapping the normalized differences of water and vegetation indices (NDWI and NDVI, respectively) around the BN and WN ( and ). Surrounding BN, NDVI changes show that the vegetation area was influenced by flood effects during the monitoring periods. When comparing the NDVI for 2014 and 2016, we concluded that the floods caused a decrease in the index. We also observed that open-water areas increased during 2014–2020, which affects vegetation areas. Furthermore, we found that the NDVI of areas far from the river were either not affected or the change was small compared to that near the river. The same effects were shown for NDVI around WN; areas of vegetation were affected by the floods of 2013 and even more affected by the floods of 2019–2020. The NDWI of BN clearly shows that the open-water areas of increased between the monitoring periods 2014–2016 and 2016–2020. Water-free areas around BN are in the northeast, indicating an opportunity to spread water flow from any future floods headed towards Khartoum city centre. At the same time, the NDWI of WN is low towards the southwest, which also provides an opportunity of redirecting floodwater threatening the city centre. Meanwhile, the urban areas have been affected by the floods, and vegetation has decreased owing to floods. The observed increase in waterbodies extension has significantly raised the probability for a disaster involving vegetation, buildings, and other infrastructures from future floods. On the basis of the presented results, we concluded that the main causes of flooding in the study area are flash floods, coastal floods, or river floods, but urban flooding in particular negatively affects built-up areas. Urban flooding is caused by natural flooding in the absence of a good drainage system. When a city’s sewage system and drainage canals do not have adequate capacity to accommodate high-intensity rainfall, flooding occurs. If land is converted to urban areas having roads, buildings, and other infrastructure, the land loses its capability to absorb water.
Figure 6. NDVI of study areas for (left) the BN and (right) the WN.
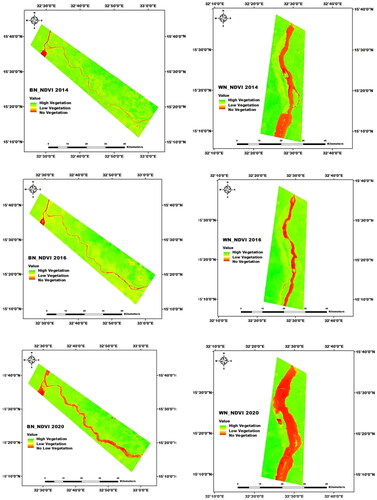
Figure 7. NDWI of study areas for the (left) BN and (right) WN.
For further investigation, we reconstructed and evaluated land-use transition probability for the periods 2014–2016 (two years) and 2016–2020 (four years). Transition lands around BN and WN for the shorter period are shown in . For evaluating the land transition around BN due to the 2013–2015 floods, we determined the gain and loss of land use for periods of two and four years ( and ). The maximum total gain (0.756) of land-transition probabilities was observed in the waterbody class and the minimum total gain was 0.308 was in the built-up areas (; ). This indicates that the 2013–2015 floods affected the areal extent of land occupied by buildings. The land change from cultivated land to waterbody was high, but at the same time, the maximum transition of agricultural land was to bare land. The total losses of bare and cultivated lands were high. Obviously, flooding was the main reason for land changes around BN during the measured period. Maximum total gains of agricultural and cultivated lands were approximately the same (). The land-transition probability for the waterbody class was found to be small. The small waterbody transition within the 2017–2020 floods we considered to be insignificant. We also observed that the total gain of built-up areas for the period 2016–2020 was higher than that for the period 2013–2016. This was caused as people attempted to use the lands along the northern river reaches ( and ). At the same time, the total loss of lands is shown as having happened in the built-up and agricultural areas because of the strong floods that occurred later, in 2019 and 2020.
Figure 8. Transition land use around (upper) BN and (lower) WN in between 2014 and 2016.
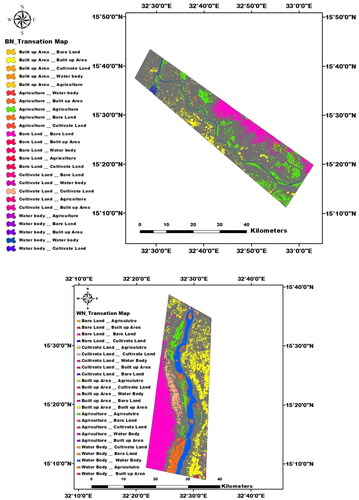
Table 4. Gain and loss of BN transition probability matrix for period 2014–2016.
Table 5. Gain and loss of BN transition probability matrix for period 2016–2020.
To correspondingly evaluate changes around WN, we studied land-change transition for the period 2014–2016 (; ). During this period, the land-change probability around WN was generally similar for total gains of waterbody and built-up areas. The maximum total land-use changes were observed in built-up and agricultural areas, indicating the effect of 2013–2015 floods on people and infrastructure. We also determined land-transition probability for the period 2016–2020 (). Furthermore, we found that the gain and loss of waterbody-transition lands (and thus the flood effects in open-water areas) were the same for the BN and WN areas (). The maximum LULC losses during the period 2016–2020 affected bare land and cultivated areas. During the same period, the transition losses of WN built-up and agricultural areas were small, particularly compared to those around BN. In general, the probability of land-use change was high owing to the effects of floods during 2013–2020. Decision-makers should consider these results for upcoming land and water-resources management.
Table 6. Gain and loss of WN transition probability matrix for period 2014–2016.
Table 7. Gain and loss of WN transition probability matrix for period 2016–2020.
We also evaluated past and predicted future (through 2024) land-use change by applying GIS (). In this research, we used the Cellular Automata-Markov (CA-Markov) GIS tool to assess the precision of the prediction model. We used LULC-2014 and LULC-2016 to simulate LULC-2020 and then to predict LULC-24 via CA-Markov. Then we calculated and evaluated the Kappa index. The high agreement observed for the observed and simulated LULC-2020 means that the CA-Markov performance was shown to be acceptable to simulate future LULC in the current study. The Kappa index is < 0.4 for cultivated land and waterbodies for areas around BN and WN; this means that the land use of these classes has greatly changed. The Kappa indexes for other classes around BN are within 0.3–0.5, while those around WN are within 0.6–0.9. These values indicate obvious changes to the bare land, agricultural land, and built-up areas may occur. We predicted land uses and changes by area through 2024 (; ). Accordingly, the built-up areas around BN and WN remain mostly unchanged; agricultural land is slightly changed around BN but may increase by 9.46% in 2024 (in view of measurements in 2020 around WN). Bare-land changes around BN and WN stay small and probably insignificant. The massive changes of land use have been observed for cultivated lands and waterbody areas over the monitoring period. The area of waterbody change is expected to have decreased by 4.18% around BN and 20.35% around WN during 2020–2024, and the area of cultivated land to have increased by 4.31% around BN and 3.30% around WN for the same period. These results and predictions reflect the influence of past and future flood effects on people and buildings. Although prediction values, including indexes for upcoming land-use changes are not necessarily perfect, the results of this research can provide information to help decision-makers determine the best land use in Khartoum State.
Figure 9. Prediction map of land change around (left) BN and (right) WN.
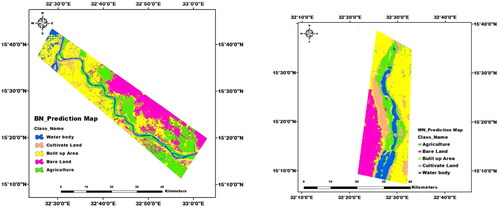
Figure 10. Land-use change during 2014, 2016, 2020 and the predictive period 2024 for (a) BN and (b) WN.
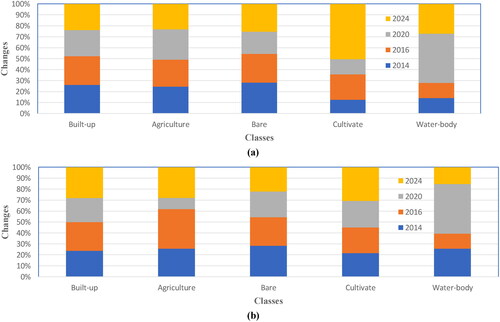
Table 8. Predictive are changes around BN and WN for 2024.
4.2. Hydraulic analysis
To study the potential flood risk in Khartoum city, we evaluated DEM data and hydraulic-modelling results. The flood risk in the study area was assessed by evaluating the direction and accumulation of water flow. Areas that are apt to be particularly vulnerable in future flash floods can be identified by determining water-flow direction. DEM-based flood-flow risk evaluation () based on low-lying land areas indicated susceptible urban areas ( and 11(a)). By applying DEM to map the disaster index of potential flood effects (), Khartoum city’s low-elevation terrain emphasized probable high risk from future floods. The fill DEM () shows the parts of Khartoum most apt to sink with increasing floodwater flow. Also apparent is that the flow at or from higher elevations is low, while the flow around WN and BN are high in Khartoum city from outside areas to city centre (). From the DEM map, which shows streamlines representing how flow may occur from high to low ground, it also is apparent from cumulative flow that the water flow is roughly equal overall across the study area (). Furthermore, other streamlines may connect both Nile tributaries and cross the city area based on road network or low land levels. We assume that roads affect the natural surface and subsurface drainage pattern of a watershed or individual hillslope. Road drainage design has as its basic objective the reduction and/or elimination of energy generated by flowing water. Accordingly, we used the GIS snap pour-point tool and mapped a new basin for Khartoum city ().
Figure 11. Terrain variation of Khartoum city, (a) DEM, (b) fill of DEM, (c) flow direction, (d) flow accumulation.
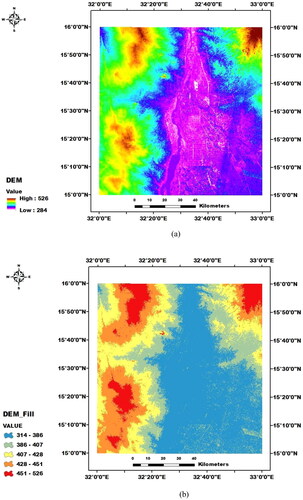
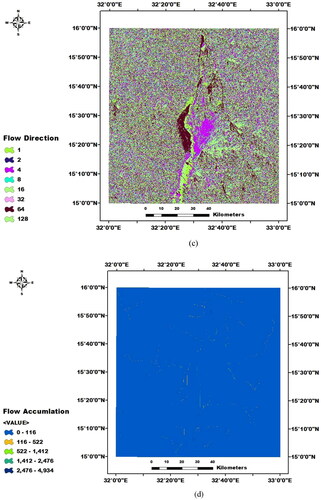
Figure 12. Flood sensitivity (a) watershed, (b) snap-pour-point, (c) detected new basin.
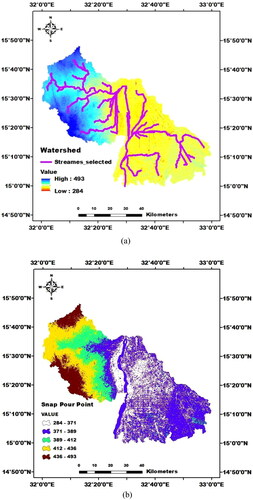
We determined the highest water-flow accumulation value for Khartoum city (). The water streamlines were selected on the basis of the cumulative flow and DEM elevation ( and ). The pour-point flow showed that the water-flow direction is towards Khartoum city centre. In addition, the predictive new basin of the study area shows that the most influenced area encompasses the whole of Khartoum city, and this implies that predictive floods would affect the whole land area, given the DEM slope in the whole city ().
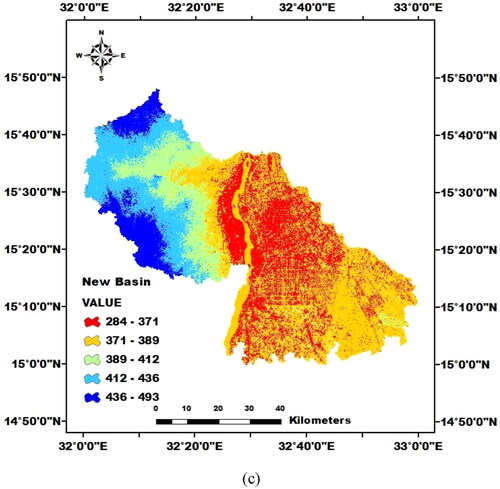
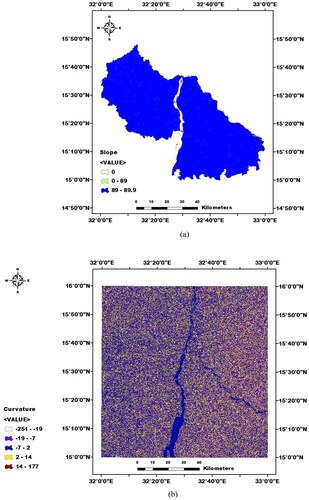
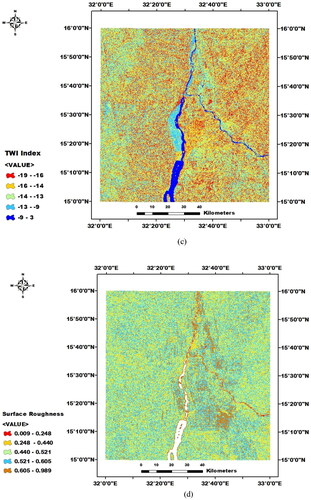
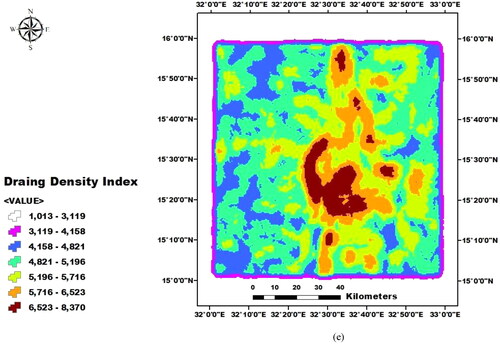
Figure 13. Surface and drainage flood sensitivity: (a) slope; (b) curvature, (c) TWI, (d) surface roughness, (e) drainage density index.
To fully understand the predicted flood disasters in Khartoum, various factors should be considered: flood characteristics, watershed, hillshade, curvature, TWI, surface roughness, and slope and aspect of the study area ( and ). We found a high correlation between DEM and the hydraulic map of the study area. Considering flood factors, DEM is the most significant type of hydrological mapping, particularly for delineating water-flow direction in the study area. From the water-flow direction () as estimated via DEM, we were able to detect the areas most vulnerable to damage from flooding. The watershed map (), which indicates that water flow affects all of Khartoum city, provides data that may help decision-makers and in particular supports ideas for any sustainable development within the study area. Hillshade results show low areas in Khartoum, which indicate probable flow direction towards the city centre and imply the expected high impact of any future flood hazard.
Figure 14. Factors of flood sensitivity for the (upper) aspect and (lower) hillshed.
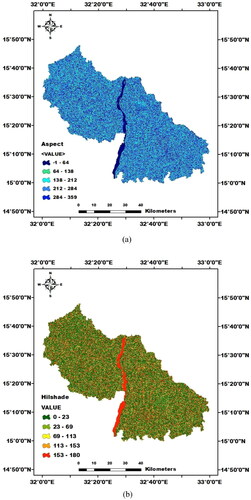
Similarly, aspect values reflect the probability of significant damage from future floods in the study area. Hillshade and aspect, curvature, and slope vary little across over the study area and thus may indicate a high possibility of water-flow extension over the entire extent of Khartoum city. The tendency of the study area to accumulate water is in the range −19.00–−13.00 (). Also, the high surface roughness (0.6–1.0) observed in the centre of the Nile delta means that the basin is highly sensitive to erosion and therefore is capable of an increased peak discharge. The Dd index is divided into seven categories; the maximum Dd can be detected at the city centre and may cover most of the southwestern Khartoum area (). This shows that the physical characteristics of the basin provide suitable conditions for filtration, thereby increasing runoff potential. Thus, the expected hazard due to floods in Khartoum is high, and decision-makers should consider the information presented in this study for future land management of Khartoum city. From evaluation of the hydraulic factors and according to Abdel Hamid et al. (Citation2020), all of Khartoum city is highly vulnerable to flooding. Flash floods can have harmful effects on the environment by destruction of vegetation cover, infrastructure damage, and lowering or loss of annual crop yield in the regions. Ultimately, the consequences of flash floods in Sudan may include effects on human health by causing various diseases (such as malaria).
On the basis of LULC evaluation and hydraulic analysis, we therefore recommend that the results obtained in the current study can be used to prioritize basins of delta land in Khartoum with the aim of proper management of flood hazard. Recognizing the high-risk areas will help reduce the natural-disaster effects of flash floods, thus decreasing the death toll and financial losses. Clearly, flood-risk assessments should take into account both physical hazards and population distribution.
Building-evacuation times during periods of flooding should be considered and can be predicted by studying regional topography. RS–GIS techniques can be used to integrate geomorphological, hydrological, meteorological, and socioeconomic variables, thereby extending the approach to other vulnerabilities such as land use and population. Moreover, the drainage system of the city must be improved for decreasing future flood effects. Also useful for management to consider is that channel construction along selected streamlines and dam construction over the WN may decrease flood effects.
5. Conclusions and recommendations
This study used RS, GIS, and hydraulic analysis to evaluate the natural-disaster effects of flash flooding in the city of Khartoum, Sudan. Flash floods frequently result in significant damage to the society and economics of different lands in Sudan. LULC around WN and BN was evaluated and predicted; in addition, the LULC-transition probability was calculated and discussed in the current research. Different hydraulic analyses were determined and presented. Images of Landsat 8 OLI from 2014, 2016, and 2020 were used to evaluate 2013–2020 flood effects. The LULC evaluation showed that the built-up and water changes around BN were 0.25% and 0.05%, respectively, for the period 2014–2016, and were 3.68% and 7.28%, respectively, for the period 2016–2020. The corresponding changes around WN were 3.26% and 8.02%, respectively, for the first period and were 5.62% and 21.40%, respectively, for the second period. The urban areas have been affected by the floods; vegetation decreased owing to floods, while waterbodies have increased. These effects significantly increase the possibility for a disaster of vegetation and for buildings and other infrastructures from any upcoming floods. Strong floods in 2019 and 2020 caused a high loss of LULC in the built-up and agricultural areas. According to projections based on using RS–GIS prediction techniques, the area of waterbodies around BN may decrease by 4.18% and around WN by 20.35% during 2020–2024. Hydraulic evaluation showed that the expected hazard due to floods in Khartoum is high. Accordingly, decision-makers should consider the information presented in this study for future land and infrastructure management of Khartoum city. For instance, the drainage system of the city must be improved for decreasing future flood effects. Also, building-evacuation times, which should be considered in advance of future flood periods, can be predicted by analyzing regional topography. RS–GIS techniques can be considered a good approach for estimating accurate flood-hazard effects: RS–GIS tools can integrate geomorphological, hydrological, meteorological, and socioeconomic variables, thereby extending the approach to other vulnerabilities such as land use and population.
Disclosure statement
The authors declare no conflict of interest.
Data availability statement
The data that support the findings of this study are openly available in [USGS EROS Center] at https://www.usgs.gov/centers/eros.
Additional information
Funding
References
- Abbas HB, Routray JK. 2013. A semi-quantitative risk assessment model of primary health care service interruption during flood: case study of aroma locality, Kassala State of Sudan. Int J Disaster Risk Reduct. 6:118–128.
- Abbas HB, Routray JK. 2014. Assessing factors affecting flood-induced public health risks in Kassala State of Sudan. Oper Res Health Care. 3(4):215–225.
- Abd El-Hamid HT. 2020. Geospatial analyses for assessing the driving forces of land use/land cover dynamics around the Nile Delta Branches, Egypt. J Indian Soc Remote Sens. 48(12):1661–1674.
- Abd El-Hamid HT, Caiyong W, Hafiz MA, Mustafa EK. 2020. Effects of land use/land cover and climatic change on the ecosystem of North Ningxia, China. Arab J Geosci. 13: 1099.
- Abdel Hamid HT, Wenlong W, Qiaomin L. 2020. Environmental sensitivity of flash flood hazard using geospatial techniques. Glob J Environ Sci Manage. 6(1):31–46.
- Andreadakis E, Diakakis M, Vassilakis E, Deligiannakis G, Antoniadis A, Andriopoulos P, Spyrou NI, Nikolopoulos EI. 2020. Unmanned aerial systems-aided post-flood peak discharge estimation in ephemeral streams. Remote Sens. 12(24):4183.
- Beven KJ, Kirkby MJ. 1979. A physically based, variable contributing area model of basin hydrology/Un modèle à base physique de zone d’appel variable de l’hydrologie du bassin versant. Hydrol Sci Bull. 24(1):43–69.
- Billi P, Ali O. 2010. Sediment transport of the Blue Nile at Khartoum. Quat Int. 226(1–2):12–22.
- Biondini M, Kandus P. 2006. Transition matrix analysis of land-cover change in the accretion area of the lower delta of the Paraná River (Argentina) reveals two succession pathways. Wetlands. 26(4):981–991.[981:TMAOLC]2.0.CO;2.2.0.CO;2]
- Brown DG, Pijanowski BC, Duh JD. 2000. Modeling the relationships between land use and land cover on private lands in the Upper Midwest, USA. J Environ Manage. 59(4):247–263.
- Buğday E, Buğday SE. 2019. Modeling and simulating land use/cover change using artificial neural network from remotely sensing data. Cerne. 25(2):246–254.
- Coppin P, Jonckheere I, Nackaerts K, Muys B, Lambin E. 2004. Digital change detection methods in ecosystem monitoring: a review. Int J Remote Sens. 25(9):1565–1596.
- Davies R. 2016. UN–1995 to 2015, flood disasters affected 2.3 billion and killed 157,000, floddlist. [accessed 2021 Jan 6]. http://floodlist.com/dealing-with-floods/flood-disaster-figures-1995-2015.
- Dibaba WT, Demissie TA, Miegel K. 2020. Watershed hydrological response to combined land use/land cover and climate change in highland Ethiopia: Finchaa catchment. Water. 12(6):1801.
- Elhaja ME, Csaplovics E, Abdelkareem OE, Adam HE, Khalifa AE, Ibrahim KA, Eltahir ME 2017. Land use land cover changes detection in White Nile State, Sudan using remote sensing and GIS techniques. International Journal of Environmental Monitoring and Protection. 4(3) :14–19.
- Elsafi SH. 2014. Artificial Neural Networks (ANNs) for flood forecasting at Dongola Station in the River Nile, Sudan. Alexandria Eng J. 53(3):655–662.
- Fadul E, Masih I, De Fraiture C. 2019. Adaptation strategies to cope with low, high and untimely floods: lessons from the Gash spate irrigation system, Sudan. Agric Water Manage. 217:212–225.
- Gong J, Sui H, Ma G, Zhou Q. 2008. A review of multi-temporal remote sensing data change detection algorithms’. The International Archives of the Photogrammetry, Remote Sensing and Spatial Information Sciences. Vol. XXXVII. Part B7. 757–762.
- Hassaballah K, Mohamed Y, Uhlenbrook S, Biro K. 2017. Analysis of streamflow response to land use land cover changes using satellite data and hydrological modelling: case study of Dinder and Rahad tributaries of the Blue Nile (Ethiopia/Sudan). Hydrol Earth Syst Sci. 21(10):5217–5242.
- Horton RE. 1945. Erosional development of streams and their drainage basins; hydrophysical approach to quantitative morphology. Geol Soc Am Bull. 56(3):275–370.[275:EDOSAT]2.0.CO;2.2.0.CO;2]
- Hu X, Lu L, Li X, Wang J, Guo M. 2015. Land use/cover change in the middle reaches of the Heihe river basin over 2000-2011 and its implications for sustainable water resource management. PLOS One. 10(6):e0128960.
- Hussein K, Alkaabi K, Ghebreyesus D, Liaqat MU, Sharif HO. 2020. Land use/land cover change along the Eastern Coast of the UAE and its impact on flooding risk. Geomat Nat Hazards Risk. 11(1):112–130.
- Mahmood MI, Elagib NA, Horn F, Saad SA. 2017. Lessons learned from Khartoum flash flood impacts: an integrated assessment. Sci Total Environ. 601–602:1031–1045.
- Mahmoud WH, Elagib NA, Gaese H, Heinrich J. 2014. Rainfall conditions and rainwater harvesting potential in the urban area of Khartoum. Resour Conserv Recycl. 91:89–99.
- Matheswaran K, Alahacoon N, Pandey R, Amarnath G. 2019. Flood risk assessment in South Asia to prioritize flood index insurance applications in Bihar, India. Geomat Nat Hazards Risk. 10(1):26–48.
- Mattivi P, Franci F, Lambertini A, Bitelli G. 2019. TWI computation: a comparison of different open source GISs. Open Geospatial Data Softw Stand. 4(1):6.
- McCarthy MC, He J, Hyams KC, El-Tigani A, Khalid IO, Carl M. 1994. Acute hepatitis E infection during the 1988 floods in Khartoum, Sudan. Trans R Soc Trop Med Hygiene. 88(2):177.
- Mousavi SM, Roostaei S, Rostamzadeh H. 2019. Estimation of flood land use/land cover mapping by regional modelling of flood hazard at sub-basin level case study: Marand basin. Geomat Nat Hazards Risk. 10(1):1155–1175.
- Muller MR, Middleton J. 1994. A Markov model of land-use change dynamics in the Niagara region, Ontario, Canada. Landscape Ecol. 9:151–157.
- Mustafa EK, Liu G, Abd El-Hamid HT, Kaloop MR. 2019. Simulation of land use dynamics and impact on land surface temperature using satellite data. GeoJournal. DOI: https://doi.org/https://doi.org/10.1007/s10708-019-10115-0.
- NASA. 2001. Nile river fluctuations near Khartoum, Sudan, NASA. [accessed 2021 Jan 12]. https://earthobservatory.nasa.gov/images/1718/nile-river-fluctuations-near-khartoum-sudan.
- NASA. 2007. Floods in Sudan, NASA. [accessed 2021 Jan 7]. https://earthobservatory.nasa.gov/images/18704/floods-in-sudan.
- NASA. 2020. A pair of Niles and Deltas, NASA. [accessed 2021 Jan 7]. https://earthobservatory.nasa.gov/images/146824/a-pair-of-niles-and-deltas.
- Näschen K, Diekkrüger B, Evers M, Höllermann B, Steinbach S, Thonfeld F. 2019. The impact of land use/land cover change (LULCC) on water resources in a tropical catchment in Tanzania under different climate change scenarios. Sustainability. 11(24):7083.
- Nguyen HTT, Doan TM, Tomppo E, McRoberts RE. 2020. Land use/land cover mapping using multitemporal sentinel-2 imagery and four classification methods-A case study from Dak Nong, Vietnam. Remote Sens. 12(9):1367–1327.
- OCHA. 2019. Overview of 2019 floods in Sudan, OCHA. [accessed 2021 Jan 12]. https://reports.unocha.org/en/country/sudan/card/5VXYjEfbu7/.
- OCHA. 2020. Sudan floods snapshot, OCHA. [accessed 2021 Jan 12]. https://www.humanitarianresponse.info/ru/operations/sudan/infographic/sudan-floods-snapshot-6-oct-2020.
- OPERNICUS. 2020. Sudan–166,000 houses damaged or destroyed by floods, floodlist. [accessed 2021 Jan 6]. https://floodlist.com/africa/sudan-floods-update-september-2020.
- Ozdemir H, Bird D. 2009. Evaluation of morphometric parameters of drainage networks derived from topographic maps and DEM in point of floods. Environ Geol. 56(7):1405–1415.
- Paul D, Mandla VR, Singh T. 2017. Quantifying and modeling of stream network using digital elevation models. Ain Shams Eng J. 8(3):311–321.
- Rajendran GB, Kumarasamy UM, Zarro C, Divakarachari PB, Ullo SL. 2020. Land-use and land-cover classification using a human group-based particle swarm optimization algorithm with an LSTM classifier on hybrid. Remote Sens. 12(24):4135.
- Ritchie H, Roser M. 2019. Natural disasters: Our world in data. University of Oxford. [accessed 2021 Jan 6]. https://ourworldindata.org/natural-disasters.
- Sang L, Zhang C, Yang J, Zhu D, Yun W. 2011. Simulation of land use spatial pattern of towns and villages based on CA–Markov model. Math Comput Modell. 54(3–4):938–943.
- Subedi P, Subedi K, Thapa B. 2013. Application of a hybrid cellular automaton–Markov (CA-Markov) model in land-use change prediction: a case study of Saddle Creek drainage basin, Florida. AEES. 1(6):126–132.
- UN. 2020. Across Sudan, heavy rains and flash floods destroy houses, wash away crops–UN relief wing, UN. [accessed 2020 Dec 26]. https://news.un.org/en/story/2020/08/1069502.
- UNOSAT. 2016. Possible flood water and saturated soil over Khartoum Area, Khartoum State, Sudan, UNITAR/UNOSAT. [accessed 2020 Dec 26]. https://disasterscharter.org/image/journal/article.jpg?img_id=320694&t=1471608174175.
- UNU. 2004. Two billion vulnerable to floods by 2050; number rxpected to double or more in two generations. United Nations University. [accessed 2021 Jan 7]. http://www.unu.edu/news/ehs/floods.doc.
- Williams MAJ, Usai D, Salvatori S, Williams FM, Zerboni A, Maritan L, Linseele V. 2015. Late quaternary environments and prehistoric occupation in the lower White Nile valley, central Sudan. Quat Sci Rev. 130:72–88.
- Yalcin A. 2008. GIS-based landslide susceptibility mapping using analytical hierarchy process and bivariate statistics in Ardesen (Turkey): comparisons of results and confirmations. CATENA. 72(1):1–12.
- Zerboni A. 2020. The Nile river led to Khartoum’s growth, but now threatens the city, conversation media group. [accessed 2021 Jan 7]. https://www.preventionweb.net/news/view/73809.
- Zerboni A, Brandolini F, Mariani GS, Perego A, Salvatori S, Usai D, Pelfini M, Williams M. 2020. The Khartoum-Omdurman conurbation: a growing megacity at the confluence of the Blue and White Nile Rivers. J Maps. 1–14. DOI: https://doi.org/10.1080/17445647.2020.1758810.