
 ?Mathematical formulae have been encoded as MathML and are displayed in this HTML version using MathJax in order to improve their display. Uncheck the box to turn MathJax off. This feature requires Javascript. Click on a formula to zoom.
Abstract
The purpose of this study is to understand flooding in a 1,725-km2 arid catchment in Makkah Province, Saudi Arabia, with very limited ground observations. This mountainous catchment includes densely urbanized areas built on lowlands and in the ephemeral streams of flood zones, which makes them vulnerable to flooding. A physically based, fully distributed hydrologic model was produced by three Integrated Multi-satellite Retrievals for Global Precipitation Measurement Mission (IMERG) high-resolution satellite rainfall products, together with a limited number of ground observations to simulate recent flood events. The hydrologic model was calibrated and validated using two events that occurred in 2010 and 2018, respectively. Details of the flooding in the urbanized areas were examined through simulation of a third event. Significant differences were noticed when the three IMERG rainfall products (Early, Late, and Final) were compared in terms of the spatial patterns and total half-hour accumulation for the three events. Accordingly, a method was developed to remove the biases of IMERG rainfall estimates using ground observations. The Early product was the closest to ground observations, producing peak discharges of 428 m3/s and 663.6 m3/s for calibration and validation storm events, respectively, and resulted in better estimates of the observed peak discharge even before adjustment. The Final run product significantly underestimated rainfall, as peak discharges of 204 m3/s and 123 m3/s for calibration and validation storm events, respectively, resulted in an amplified underestimation of the runoff.
Introduction
As a result of climate change and human intervention in the natural environment, floods occur more frequently. Specifically, flood magnitudes and impacts will increase because of urban development, population growth, and the projected future increase of extreme weather events (Dang et al. Citation2011). Due to the dramatic societal impacts of these floods, scientific recommendations on the best approaches to address this issue are being developed by researchers from various disciplines (Borga et al. Citation2014). Many flood mitigation measures in urban and rural settings were discussed by Morris et al. (Citation2016) and Waylen et al. (Citation2018). Many of these approaches that combine engineering and non-engineering solutions can benefit society by providing opportunities to control floodwaters by turning them into a resource and, accordingly, save lives and property.
Various hydrologic models have been used to generate runoff and flood predictions to help decision makers understand watershed behavior in response to certain precipitation events and adopt proper plans of action to prevent or mitigate flooding (Smith et al. Citation2006). However, the quality of model inputs such as precipitation significantly influences the accuracy of the hydrologic model predictions (Montanari and Koutsoyiannis Citation2012). The low spatial and temporal resolutions and low quality of precipitation data are considered to be major challenges in many regions across the globe, including the Arabian Peninsula (Hussein et al. Citation2020). The high quality, high-resolution global satellite precipitation products that recently became available can fill this gap and provide accurate input for many applications, including water resources planning and management, hydrologic modeling and forecasting, design of hydraulic structures, and flood, drought, and landslide analysis and forecasting (Sharif et al. Citation2017; Alsumaiti et al. Citation2020).
With the advancement of satellite-based remote sensing, extreme rainfall can be measured at relatively low cost over large areas at moderately high temporal and spatial resolution (4 − 25 km, 30 min − 3 h). The accuracy and resolution of satellite precipitation products have increased since the launch of the Global Precipitation Measurement (GPM) mission in April 2014, which collects and merges precipitation data from different satellites. The GPM is the follow-up mission to the Tropical Rainfall Measuring Mission (TRMM) launched in 1997 by the National Aeronautics and Space Administration (NASA) and the Japan Aerospace Exploration Agency (JAXA). The GPM, also launched by NASA and JAXA in 2014, is composed of one core observatory satellite, about 10 partner satellites, a multi-channel microwave imager, and a dual-frequency radar (Hou et al. Citation2014; GPM Citation2018).
Numerous studies of various hydrometeorological applications have evaluated the potential of satellite precipitation products (e.g., Su et al. Citation2008; Wood et al. Citation2011; Siddique-E-Akbor et al. Citation2014; Prakash et al. Citation2015). Satellites have better spatial coverage than weather radars, but with lower temporal and spatial resolutions (Sharif et al. Citation2017) and, generally, more random and systematic errors (Behrangi et al. Citation2011; Vergara et al. Citation2014). The accuracy of satellite rainfall products can be improved through multi-sensor techniques in conjunction with ground observations (Stisen and Sandholt Citation2010). The high resolution of the recent satellite-based precipitation products will be particularly helpful in the simulation and prediction of floods. Several studies have demonstrated that flash flood simulation requires high-resolution rainfall data such as that provided by satellite data (Xie et al. Citation2012; Gao and Sui Citation2013; Deng et al. Citation2015). For instance, Anquetin et al. (Citation2005) mentioned that the storm events which caused the devastating flash flood in France in 2002 were missed by low-resolution, gauge observations but were captured by high-resolution, remotely sensed precipitation products. Schuurmans et al. (Citation2007) found that flood simulation using a single rain gauge located outside the watershed gave a false prediction and concluded that the spatial distribution of rainfall was essential for rainfall-runoff modeling. Chintalapudi et al. (Citation2012) reported that the rainfall spatial distribution could not be captured over a watershed with sparse distribution of rain gauges.
One of the most promising multi-satellite sensor precipitation products is the Integrated Multi-Satellite Retrievals for the Global Precipitation Mission (IMERG). The IMERG produces high-resolution precipitation data due to its design, which avoids major weaknesses and incorporates the strengths of earlier satellites supported by NASA. As a result, the precipitation data is expected to significantly advance hydrological modeling and predictions worldwide, especially in poorly gauged and ungauged catchments (Sharif et al. Citation2017). Three main IMERG products are available, namely the ‘Early’, ‘Late’, and ‘Final’ IMERG runs. The Early and Late multi-satellite products are available within approximately six hours and 18 hours after observation, respectively. Climatological coefficients are used to calibrate these two products. The Final run product is produced approximately three months after observation (Huffman et al. Citation2018). This product is adjusted based on satellite-gauge combined monthly data. All these products have a spatial and temporal resolution of 0.1° × 0.1° and one half-hour. Some studies used earlier satellite products such as TRMM-3B42 and TMPA rainfall products to investigate the improved accuracy of the IMERG rainfall (Prakash et al. Citation2016; Khodadoust Siuki et al. Citation2017; Wang et al. Citation2017). All these studies found that using GPM-IMERG products significantly improved the estimation of rainfall intensities compared with earlier satellites. Other studies used ground-based rainfall data to evaluate the GPM-IMERG products and reported a good agreement between the ground observations and the satellite estimates (Tang et al. Citation2016; Asong et al. Citation2017; Sungmin et al. Citation2017).
In addition to the variability of the rainfall fields, the spatiotemporal variability in topography, soil type, and land use significantly affects watershed response. Accordingly, accurate flood simulation and predictions can be provided by those models which can consider all of these variabilities (Sharif et al. Citation2010a; Smith et al. Citation2012; Furl et al. Citation2015). The gridded nature of physically based distributed hydrologic models can represent details of distributed inputs and parameters at very fine resolutions. Moreover, the flood hazard areas can be identified in detail by using such models (Sharif et al. Citation2016). The Gridded Surface Subsurface Hydrologic Analysis (GSSHA) model (Downer and Ogden Citation2004) is an example of a physically-based, fully distributed model that has been used in numerous flood studies. Sharif et al. Citation2013) applied the GSSHA model on urbanized watersheds to evaluate the effect of flood control structures on stream discharge. Sharif et al. (Citation2010b) used a 30-m model grid to validate the GSSHA model over urban catchment in Texas and demonstrated the benefit of the used grid size over the studied area. The GSSHA model and satellite precipitation products were also used to simulate several flood events over a 3,000-km2 catchment in Texas and a small catchment in Mississippi (Chintalapudi et al. Citation2014; Zeweldi and Gebremichael, Citation2011). The results show that the most reasonable runoff estimates can be generated using high-resolution satellite precipitation products. Sharif et al. (Citation2010a) demonstrated that simulating rainfall storms with multiple hiatuses by GSSHA is more successful than the HEC model.
Recent extreme precipitation events over the Arabian Peninsula spurred several hydrometeorological studies. Almazroui et al. (Citation2012) evaluated TRMM rainfall data from 1998 to 2009 over Saudi Arabia. Although the product’s accuracy was not high, the study recommended using the TRMM product to complement rainfall data for parts of the country with an extremely sparse rain gauge network and for ungauged regions. Mahmoud et al. (Citation2018) assessed the GPM-IMERG products' accuracy over Saudi Arabia using daily rainfall observations for the period from October 2015 to April 2016. The study demonstrated the potential of using the IMERG Final run product to complement or replace ground precipitation observations for poorly gauged and ungauged regions. Tekeli and Fouli (Citation2016) used the TRMM rainfall product for flash flood forecasting to propose an early flood warning system for Riyadh and concluded that during such an extreme event, some helpful information could be provided by the TRMM product.
The western region of Saudi Arabia has witnessed frequent flooding over the past 10 years resulting in significant damage to public and private properties and the overall economy (e.g., Youssef et al. Citation2016). This research aims to develop a physically based, fully distributed hydrologic model for the catchment that encompasses the holy city of Makkah, Saudi Arabia. The Gridded Surface Subsurface Hydrologic Analysis (GSSHA) hydrologic model is the primary model used in this study. Driven by ground-based and remotely sensed rainfall, the model is used to simulate the flooding potential in the urban center and surrounding areas. Three events were simulated in this study: one for GSSHA model calibration, one for model validation, and a major event that was simulated to examine the details of the resulting inundation.
Study area
The holy city of Makkah is located in the southwestern part of the Kingdom of Saudi Arabia, about 80 km east of the Red Sea coast. In the past few decades, the city has witnessed unusually rapid urbanization making it the third most highly populated metropolitan area in Saudi Arabia and one of the fastest-growing cities in the world. Alahmadi and Atkinson (Citation2019) reported a three-fold increase in the urban fraction in Makkah Province between 1992 and 2013. The area covered by Makkah City rose significantly from about 12% of the province in 1992 to 22.13% in 2016 (Al Jabri and Alhazmi Citation2017). The urban areas exposed to flooding increased by about 25 times between 1988 and 2019 (Abdelkarim and Gaber Citation2019). In addition, more than 50% of Makkah’s road network is subjected to the impact of high floods (Al-Baroudi et al., 2013). As a result of the fast urban expansion, local authorities now require flood studies for any building development within the city limits. The total area of Makkah Province is approximately 153,000 km2, and the population is around 8.6 million (GAS Citation2020).
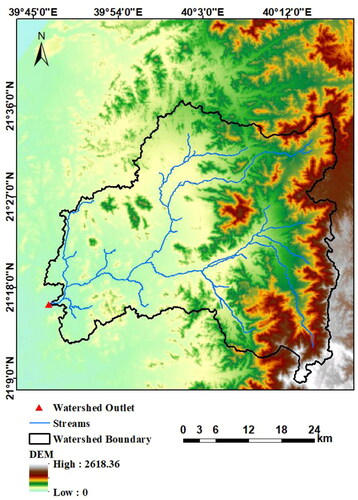
The partially urbanized catchment that encompasses Makkah City with a drainage area of 1,725 km2, as shown in , was selected for this study. The elevation of the study area ranges between 190 and 2,614 m above mean sea level. The study area consists of two geomorphological units—mountains and plains—and is dominated by mountains with steep slopes (). The delineated watershed includes three main wadis (valleys): Wadi Ibrahim, Wadi Nu’man, and Wadi Uranah. It includes a place called ‘Al-Masha’er Al-Muqadasa,’ where more than 3.5 million people gather annually to perform Hajj. It also includes highly populous neighborhoods such as the Al-Haram area, agricultural areas such as the Husseinieh, the very busy arterial roads between Al-Masha’er Al-Muqadasa, and the other cities such as Al-Taif, Jeddah, and Madinah.
Figure 1. Makkah catchment area.
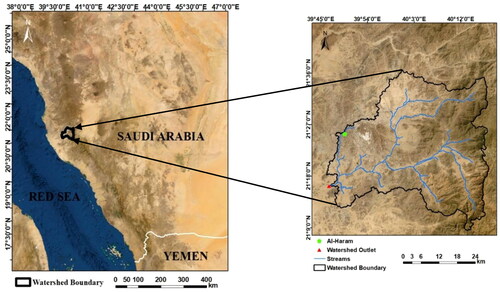
Figure 2. Topography of the study area.
Rainfall data
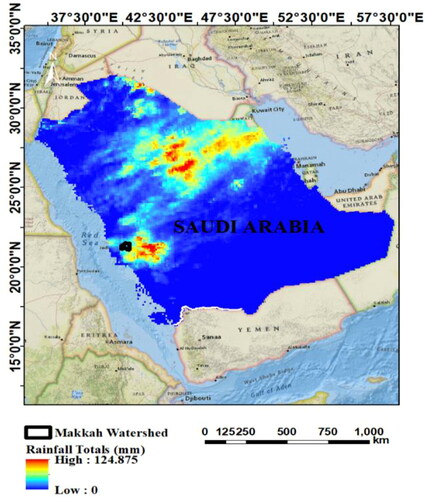
The annual rainfall over Makkah City varied from 3.8 to 318.5 mm from 1966 to 2010, with an annual average of 102.6 mm (Dawod et al. Citation2013). Due to the lack of rainfall data for several storms that occurred recently, such as the storm event of November 23, 2018, and because recorded data is available only on a daily time scale as available in the website of the Ministry of Water and Electricity (MOWE, Citation2021) – Saudi Arabia (website: https://app.mewa.gov.sa/DailyRainsNews/Rain_Dams.aspx), another source of rainfall data is required. Satellite rainfall data was used as the input for the hydrologic simulations in this study. The IMERG data with spatial and temporal resolutions of 0.1° × 0.1° and 30 min, respectively, was downloaded from the Precipitation Measurement Missions (PMM) website (http://pmm.nasa.gov/data-access/downloads/gpm). The Early and Late IMERG products were downloaded using FileZilla software, while the Final product was downloaded using an R-based script. The downloaded rainfall data was converted from HDF5 into a gridded ASCІІ format using an R-based script and then reformatted as an input for the hydrologic model. shows the IMERG rainfall totals (Early) for the November 22–23, 2018 storm over Saudi Arabia.
Figure 3. IMERG rainfall totals (Early) for November 22-23, 2018 storm over Saudi Arabia.
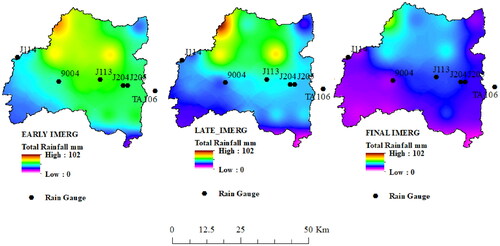
Three rainfall storm events were used in this study. Two of these storms were used for calibration and validation, while the third one was used to examine the inundation that occurred on November 23, 2018, and caused significant damage as reported by the local media and shown in . The total rainfall accumulations for the February 23, 2010 event (used for calibration) over the catchment are shown in as estimated by the three IMERG products. This storm started at 4:30 p.m. and lasted for about two hours with a total rainfall accumulation of 55 mm based on the ground rainfall observation causing serious damages to the road network (Dawod and Mirza Citation2012).
Figure 4. Flood inundation photographs for the Makkah catchment caused by the November 23, 2018 storm (https://sabq.org/WLRZ7X).
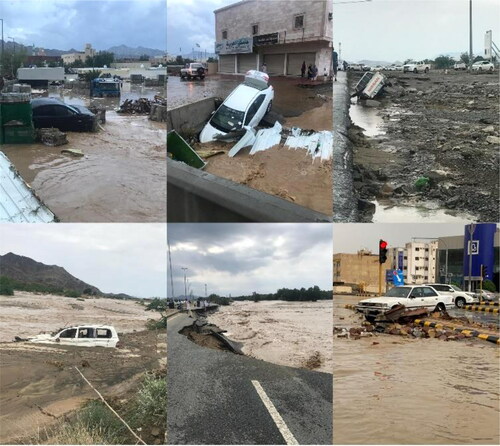
Figure 5. Rainfall totals for the February 13, 2010 storm as estimated by the three GPM products.
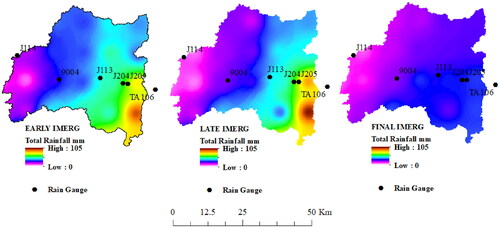
shows the total rainfall accumulations of November 3, 2018 (used for validation), as estimated by the three IMERG products. Three rain gauge stations recorded this event: Arafah 9004, Makkah J114, and Muntasaf-Huda J205. These stations recorded rainfall totals of 22, 7.8, and 20 mm, respectively. As a result of this event, many urban settlements were submerged and several roads were inundated (Abdelkarim and Gaber Citation2019). shows the total rainfall accumulations of November 23, 2018, over the Makkah watershed as estimated by the three IMERG products. This storm started at 3:00 a.m., lasted for about three hours, and was recorded by four rain gauge stations—Makkah Arafah 9004, J114, Muntasaf-Huda J205, and Al-Ferine J113—which recorded rainfall totals of 1.7, 55, 14.2, and 9 mm, respectively. During and after this event, several neighborhoods, as well as many roads (such as the old road of Makkah-Jeddah), tunnels, and bridges were inundated and sustained significant damage, causing traffic congestion as reported by the news, social media, and reports (YtNature-Phenomena of Our World Citation2018).
Figure 6. Rainfall totals for the November 3, 2018 storm as estimated by the three GPM products.
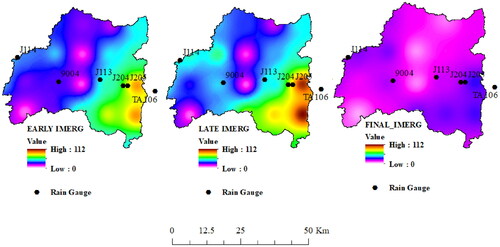
Figure 7. Rainfall totals for the November 23, 2018 storm as estimated by the three GPM products.
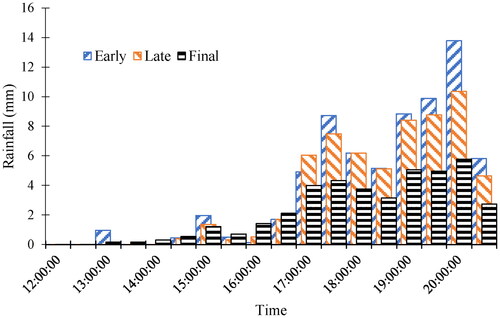
The hyetographs of the three IMERG products for the three storm events are shown in , respectively. It can be seen that there are significant differences in the spatial distribution and half-hour accumulations among the three IMERG products for all three events. In general, the Early product reports the highest estimates while the Final product provides the lowest estimates. This is expected, as adjustment using climatological records would result in reduced estimates in dry regions (Alsumaiti et al. Citation2020). The temporal patterns are generally similar.
Figure 8. The three IMERG products hyetographs for the February 13, 2010 storm.
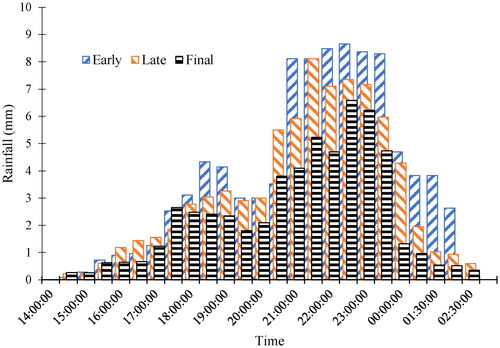
Figure 9. The three IMERG product hyetographs for the November 3, 2018 storm.
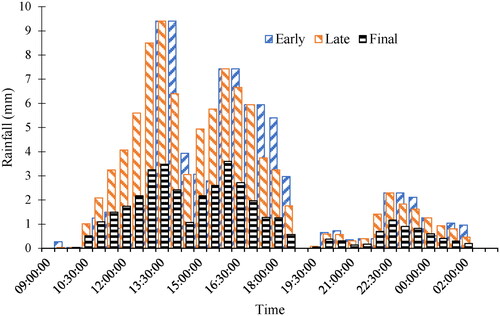
Figure 10. The three IMERG products hyetographs for the November 23, 2018 storm.
GSSHA model
GSSHA is a complete watershed model used for hydrologic, hydraulic, sediment, and water quality simulations. GSSHA simulates channel flow (one dimension) and overland flow (two dimensions) on a structured grid using explicit finite-volume solutions of the St. Venant equations of flow (Downer and Ogden Citation2004, Citation2006). All processes are simulated over each grid cell. The major components of the GSSHA model are temporally and spatially varying precipitation, evapotranspiration, surface runoff routing, interception by plants, simplified lake storage and routing, infiltration, saturated groundwater flow, wetland peat layer hydraulics, unsaturated zone soil moisture accounting, overland sediment erosion transport and deposition, overland contaminant transport and uptake, and in-stream sediment transport (GSSHA Primer Citation2018). GSSHA can offer four options to simulate infiltration: Richard’s equation, Green and Ampt (GA), Green and Ampt with redistribution (GAR), and multi-layered GA (Richards, Citation1931; GSSHA Primer Citation2018). The multi-layered GA and GA are used for modeling a single storm event, while continuous storm events are simulated by the GAR (Ogden and Saghafian Citation1997).
The GAR method is based on the following equations:
(1)
(1)
(2)
(2)
where:
F (t) = cumulative infiltration (cm) f (t) = infiltration rate (cm/hr)
Sf = wetting front suction head (cm) n = effective porosity
K = effective hydraulic conductivity (cm/hr)
K = Ks/2.0
Ks = saturated hydraulic conductivity (cm/h) θi = initial soil moisture content θs = water content of the soil at natural saturation.
The GSSHA model employed the St. Venant equations of flow to calculate the overland flow from each grid cell in two orthogonal directions. Flow cannot be routed across the boundary when a grid cell lies over the catchment boundary (GSSHA Primer Citation2018). Three numerical techniques—alternative direction explicit (ADE), explicit, and ADE-prediction correction (PC)—are used by the GSSHA model to compute overland flow routing. The type of catchment controls the selection of these methods. Flows in the ADE scheme used in this study are calculated using Equationequations (3)(3)
(3) to Equation(8)
(8)
(8) . EquationEquations (3)
(3)
(3) and Equation(4)
(4)
(4) are used to calculate the inter-cell flows along x and y directions, respectively.
(3)
(3)
(4)
(4)
EquationEquation (5)(5)
(5) is used to calculate the flow depths in each cell at the n + 1 time level based on the flows in the x direction.
(5)
(5)
On the other hand, the interflows in the y direction are calculated from each cell using EquationEquation (6)(5)
(5) .
(5)
(5)
EquationEquation (7)(7)
(7) is used to calculate the updated column depths based on the interflows in the y direction.
(7)
(7)
where:
= overland flows from cell ij in the x and y directions, respectively
= cell’s dimensions
N = Manning’s roughness coefficient
= the depth of water in cell ij at the nth time level
= the water surface slopes in the x and y directions, respectively.
Overland flow that enters the stream is routed until it reaches the catchment outlet through a 1-D channel network. The explicit solution of the diffusive wave equation was used in this study to simulate 1-D channel routing. EquationEquation (8)(8)
(8) is used to calculate the flow volume at each node.
(8)
(8)
where:
= lateral flow(m2/s)
= flow exchange between the channel and groundwater(m2/s)
= the longitudinal inter-cell flows (x) computed from depths h, at Nth time level.
Model setup
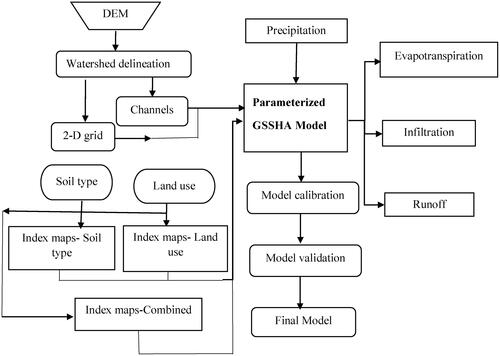
shows the steps of the GSSHA model development. Due to the complex natural topography of the study area and to simulate runoff with a level of reasonable detail, a 150-m GSSHA model grid size was selected.
Figure 11. Flowchart for the GSSHA model.
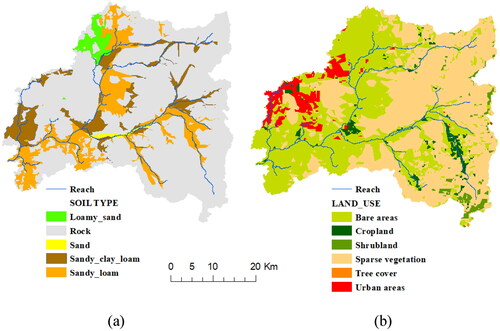
Maps of soil properties, including soil texture fractions at the ground surface and six other standard depths, are provided by the SoilGrids system (www.SoilGrids.org; Hengl et al. Citation2017) at 250-m resolution with a distribution of soil classes based on the USDA classification systems and World Reference Base (WRB). The clay, silt, and sand contents for the study area were downloaded from the SoilGrids system website as a mass fraction in percentages. The catchment is dominated by rock (72.3%) with significant fractions of sandy loam (18.3%) and sandy clay loam (8.8%). The Final soil type map for the Makkah catchment was developed using the ArcGIS10.6 (Zhan and Huang Citation2004; ESRI Citation2020) and USDA classification systems (). The developed map was adjusted based on comparison with aerial photographs, information from site investigation, and geotechnical evaluation for a proposed bridge and deep subsurface dam project in Makkah catchment (Khairy et al. Citation2010). Land cover/use data were obtained from LandGIS (www.openlandmap.org), a Web-GIS system providing access to global spatial physiographical layers at 300-m spatial resolution. Urban areas cover 4.9% of the catchment and are concentrated in the northwestern part around the holy sites of Makkah. The rest of the catchment is dominated by very sparse vegetation (49.1%) and barren land (41.8%). The land cover map was then processed using ArcGIS10.6 and reformatted as an input file to the GSSHA model ().
Figure 12. Soil type (a) and land use (b) maps of the Makkah catchment.
The channel network was delineated using the Watershed Modeling System (WMS) software (Aquaveo Citation2020) based on the 10-m-resolution digital elevation models (DEMs) obtained from King Abdulaziz City for Science and Technology (KACST) in Riyadh, Saudi Arabia. The delineated network was compared with aerial photographs of the watershed, and minor adjustments were performed. The cross-sections of the main channels were extracted as irregular cross-sections from the 10-m DEM. Other streams' cross-sections were assumed to be trapezoidal based on a survey done by Al-Baroudi et al. (2013). The stream channels were adjusted manually using WMS tools to smooth the thalweg elevations by removing adverse slopes resulting from errors in the DEM data. The GAR method was used to simulate infiltration while the overland flow was routed using the ADE method. The GSSHA manual (GSSHA Primer Citation2018) was used to estimate Manning roughness coefficients and soil parameters.
Results and discussion
Model calibration and validation
The February 13, 2010 event was used to calibrate the GSSHA model. Although there is no streamflow data for the event, limited indirect estimates of flow based on high-water marks were computed through post-event field surveys conducted to evaluate the damage caused by the event (Al-Baroudi et al., 2013). The total rainfall accumulation was estimated at 55 mm based on one rain gauge in Wadi Uranah, and the resulting peak discharge was estimated at 431 m3/s based on a maximum flow depth of 1.6 m at the outlet of the wadi measured near the intersection of Wadi Uranah and Mashar Arafat. The GSSHA model was calibrated manually by adjusting the soil and land use parameters (primarily the channel and overland roughness and hydraulic conductivity values). The parameter values were allowed to vary within the published ranges for different land use and soil types. shows the surface properties of the Makkah watershed. When using Early run rainfall as an input, the simulated peak discharge matched the estimated peak with minimal calibration. However, the Final run product significantly underestimated the outlet discharge of Wadi Uranah, producing a peak of only 204.2 m3/s after calibration. The Late run product produced a much better discharge of 376.2 m3/s (). shows that the errors in peak discharge for the Early, Late, and Final products were 0.8%, 12.72%, and 52.63%, respectively.
Figure 13. Comparison between simulated hydrographs for the February 13, 2010 event at the outlet of Wadi Uranah estimated by the three GPM products and observed peak using GSSHA model.
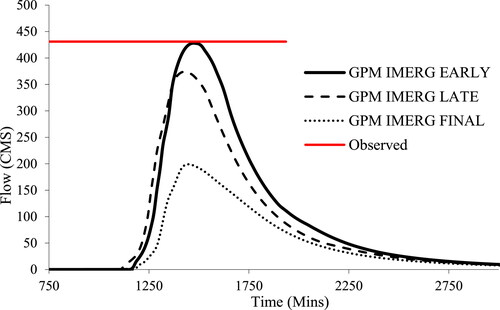
Table 1. GSSHA overland flow and infiltration parameters for the Makkah watershed model.
Table 2. Comparison of the three GPM products and the adjusted Early and Final GPM products.
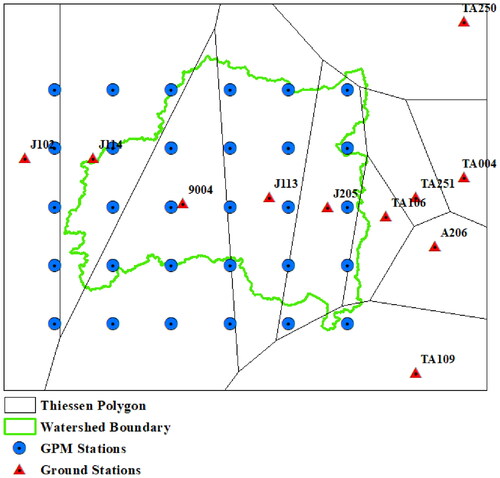
To verify the IMERG products' accuracy, the ground rainfall observations over the entire Makkah catchment were used to adjust the satellite estimates for the November 23, 2018 event. The study area was divided into polygons enclosing the ground gauge stations using the Thiessen method. A bias factor was computed for each polygon by comparing IMERG and gauge estimates. Each IMERG product has different bias factors. The IMERG products were then adjusted by multiplying each value by the corresponding bias factor. Each IMERG grid value was adjusted by a factor determined from the polygon where its center is located ().
Figure 14. Distribution of ground and satellite grid centers covered by Thiessen polygon for the study area.
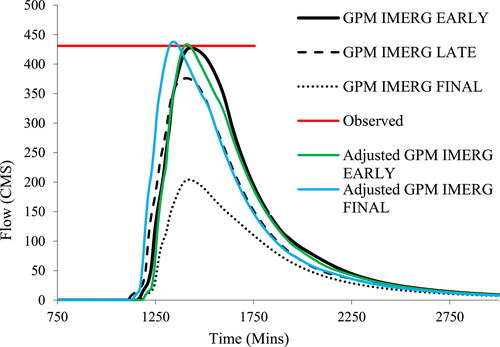
The GSSHA model was used to simulate the calibration event using adjusted IMERG products. Adjusted products produce better estimates of the peak discharge for the Late and Final with little effect on estimates derived by the Early product. The improvement was much higher for the Final product, as shown in and .
Figure 15. Comparison between simulated hydrograph at the outlet of Wadi Uranah estimated by the three GPM and the adjusted uncalibrated GPM products and observed peak using the GSSHA model.
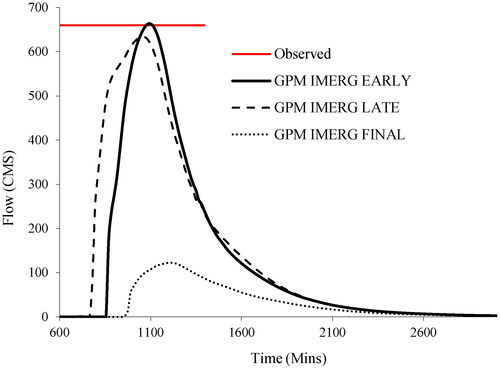
The second high-water mark estimate was made on November 3, 2010, in Wadi Al-Nu’man with an observed peak discharge ranging from 640 to 680 m3/s and a flow depth of about 3.5 to 4 m measured at three points by a consultant near the University of Umm Al Qura in Makkah (Abdelkarim and Gaber Citation2019). This event was used to validate the GSSHA model.
Again, when forced by the Final run product, GSSHA underestimated the outlet peak discharge of Wadi Al-Nu’man for this event, producing a peak discharge of 122.8 m3/s, which is much lower than the average estimated discharge of 660 m3/s. As for the calibration event, the Early run product produced much better discharge values of 663.6 m3/s, while the Late run product estimated the peak discharge at 633.71 m3/s, which is lower than the observed peak (). Compared to the calibration event, the Final product's error was generally higher for the validation event of November 3, 2018, at 81.4%, while for the Early and Late products, they were less at 0.55% and 4%, as seen in . For both events, the Early run product matched the observed peak discharge perfectly, while the Final run product significantly underestimated the peak discharge.
Figure 16. Comparison between simulated hydrographs for November 3, 2018 event at the outlet of Wadi Al-Nu’man estimated by the three GPM products and observed peak using the GSSHA model.
Simulation of the november 23, 2018 storm event
The Makkah region witnessed heavy rainfall on November 23, 2018, which caused wide-spread flooding. Although there were five rain gauge stations inside the catchment (), only four of them—Makkah (J114), Arafah (9004), Al-Ferine (J113), and Muntasaf-Huda (J205)—reported the total rainfall accumulations for the event, with rainfall totals of 55, 1.7, 9, and 14.2 mm, respectively. The three IMERG products reported total accumulations of 20.1, 28.7, 46.6, and 40.95 mm (Early run); 10.2, 24.4, 43.9, and 47.9 mm (Late run); and 11.4 and 23, 24.6, and 21.5 mm (Final run) at the locations of the four gauges, respectively. The catchment-averaged total rainfall observed by the gauges was 15.5 mm using the inverse squared distance method. The average total rainfall estimated by the three IMERG products (Early, Late, and Final) are 34.6, 30.75, and 20.3 mm, respectively. The three IMERG products show an increase in rainfall from west to east, but the spatial patterns are different ( and ). Unfortunately, there is no observed or estimated discharge or flow depth for the November 23, 2018 storm that can help to validate the model. However, based on the rainfall comparison between the ground gauge stations and the three GPM products, the adjusted IMERG products using the approach described above can be used.
The GSSHA model produces discharge at every point in the channel and overland flow at every grid at every time step. shows maximum depth over the urban areas of the catchment when GSSHA was forced by the Early run product. The inundation map shows that some urban areas and major streets were flooded during the event. In very dry regions, settlement starts at low-lying areas around ephemeral streams (wadis), and often the road network follows those streams. Also, the GSSHA output shows that much of the flood runoff volume remained on the surface due to the complex nature of the natural topography of the study area. Also, the flood simulations show that the inundation was due to the overbank flooding, which agrees with photographs and media reports released after the storm indicating that the occurrence of channel overflow and inadequate flood control measures caused major street flooding (Al-Bajal Citation2018). Smaller flooding depths and extent were produced when the other two IMERG products forced the GSSHA.
Figure 17. Flood inundation map for Makkah catchment caused by the November 23, 2018 storm. The insets highlight built areas in the Al Naseem and AlJamah neighborhoods.
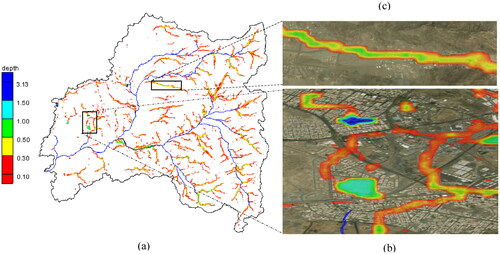
The capital witnessed a heavy flood on November 23, 2018, which blocked parts of the main roads, destroyed several vehicles, cut electricity to some neighborhoods, and damaged asphalt layers. Runoff depth estimates varied between 0.1 m and 3.13 m, with the highest values observed at flat, low-lying areas, usually preferred for early settlements. The flooding resulted in maximum inundation depths greater than 0.1 m covering approximately 6.3% of the catchment area. This affected portion sustained significant damage, especially the road network. The inundation included 8.8% of the urbanized part of the catchment, which represents 4.9% of the total area. The Wadi Al-Maghams and Ar Rashidiyyah neighborhoods were the areas most affected. The flooding depth in some low-lying residential areas such as Al Naseem and AlJamah reached 0.9 m and 2 m, respectively (). Several roads in the catchment were inundated, resulting in multiple closures that interrupted traffic during the event (). The extremely busy Second Belt Road and AL Mansur Street were inundated by water with a flooding depth of 0.14 to 2.8 m while a flooding depth of 0.1 to 0.33 m covered Al Masjid Al Haram Road and the Al Maabdah neighborhood. Al Masjid Al Haram, the holiest site in Makkah, was not affected due to its efficient drainage system. However, flooding depths of 0.13 to 0.42 m were observed in some nearby neighborhoods such as Al Ju'ranah. The Al Abdeyah neighborhood, where Umm Al Qura University is located, was also affected by this event with a flooding depth of 0.1 to 0.9 m. Wadi Al-Maghams, located east of Makkah Al-Mukarramah, witnessed flooding during this event which caused closure of the road leading to Masher Arafat and resulted in falling light poles, wearing of the asphalt layer on the main road, and damage to numerous vehicles.
Summary and conclusions
This paper describes the use of satellite products to simulate flooding in a 1,725-km2 arid catchment with very limited ground observations. The three IMERG products of GPM were used as rainfall input data to force the physically based, fully distributed hydrologic GSSHA model to simulate a recent flood event in the Makkah region. Peak discharge estimates from high-water marks for two events in 2010 and 2018 were used to calibrate and validate the hydrologic model. A third event was simulated to examine the details of the inundation in the urbanized areas in the catchment’s outlet.
Comparison of the three IMERG products (Early, Late, and Final) showed significant differences in terms of the total half-hour accumulation and spatial patterns for three events. In general, when forced by the IMERG Early run product, the GSSHA model predicted peak discharge values much closer to estimates based on high-water marks than predictions driven by the other two products. In particular, the Final run product resulted in a very significant underestimation of the estimated peak. A method of minimizing the bias of IMERG rainfall estimates was developed, resulting in better predictions of the peak discharge for all three products.
Although the IMERG products' performance during the calibration and validation was good, their accuracy is associated with significant uncertainties, especially the differences among the products in the spatial patterns. In this study, it was not possible to verify the storms' temporal patterns, as the rain gauge data was measured on a daily basis. The findings of this study indicate that careful attention should be paid when using IMERG products to predict precipitation in mountainous regions like those in this study area. In such an environment, it is ideal to have several ground stations with enough temporal and spatial resolutions to enable proper verification of the satellite rainfall estimate.
This study demonstrates the advantage of using the GSSHA model for areas with natural complex topography, such as the Makkah region. The GSSHA model has the ability to compute the remaining water on the surface, which cannot be estimated when using the conceptual models, leading to poor estimation of the observed hydrograph. Also, the flood velocity and flood depths at any location inside the catchment can be easily determined. The model results provided detailed information about the residential areas and roads that were inundated during the events. Simulation of the three events indicated widespread over-bank flooding, and a significant fraction of the runoff was observed to cover the lowlands after the events.
For most of the year, and sometimes for many years, the study area does not receive any significant precipitation. The detailed information on runoff production and movement produced by the model can be used to guide innovative flood mitigation and countermeasures such as managed aquifer recharge (MAR, Dillon et al. Citation2019) to capture and store excess runoff from these sporadic events rather than building expensive recharge dams that can enhance evaporation and encourage water overuse. Authorities can acquire open spaces to implement MAR and other non-structural countermeasures. Model results can also help land use planning for future development in flood-prone areas. However, measures such as flood-proofing (Veerbeek et al. Citation2012) may be needed for the holy site and some densely built residential areas.
Urbanization is rapidly increasing in Makkah Province, and this will exacerbate floods and their impacts, especially during religious events when hundreds of thousands of people visit Makkah. Citizens are often not prepared for these sporadic extreme rainfall events, and this necessitates a flood risk information strategy that includes measure such as early flood warning, flood risk mapping, dissemination of flood information (e.g., Goniewicz and Burkle Citation2019), road closure plans based on predicted flood levels and flood climatology information, and evacuation training for first responders (e.g., Thieken et al. Citation2016). A model such as GSSHA can be a primary tool to inform such a strategy and other flood prevention measures at the local community level.
Acknowledgment
The authors would like to acknowledge the support provided by King Fahd University of Petroleum and Minerals (KFUPM) to complete this study.
Data availability statement
Data sharing is not applicable to this article as no new data was created or analyzed in this study.
References
- Abdelkarim A, Gaber AFD. 2019. Flood risk assessment of the Wadi Nu’man Basin, Mecca, Saudi Arabia (during the period, 1988–2019) based on the integration of geomatics and hydraulic modeling: a case study. Water. 11(9):1887.
- Al Jabri N, Alhazmi R. 2017. Observing and monitoring the urban expansion of Makkah al-Mukarramah using the remote sensing and GIS. J Eng Sci Inform Technol. 1(II):103–125.
- Alahmadi M, Atkinson PM. 2019. Three-fold urban expansion in Saudi Arabia from 1992 to 2013 observed using calibrated DMSP-OLS night-time lights imagery. Remote Sensing. 11(19):2266.
- Al-Bajal AR. 2018. newspaper sabq date of 25 November 2018.
- Al-Baroudi M, Mirza M, Dawood G. 2013. The use of GIS in estimating the volumes of floods and the extent of their development at the lower reaches of Wadi Nu’man south of Makkah city by the application of the Snyder model and the model of digital heights. Presented at the International Geographic Conference “Geography and Contemporary Global Changes”, Medina, Saudi Arabia, 20–23 May 2013; Research Booklet C Part C. Faculty of Arts and Humanities, University of Thebes: Medina, Saudi Arabia, 2013; p. 757–783.
- Almazroui M, Islam MN, Athar H, Jones PD, Rahman MA 2012. Recent climate change in the Arabian Peninsu: annual rainfall and temperature analysis of Saudi Arabia for 1978 — 2009. Inter Journal of Climatology. 966:953–966.
- Alsumaiti TS, Hussein K, Ghebreyesus DT, Sharif HO. 2020. Performance of the CMORPH and GPM IMERG products over the United Arab Emirates. Remote Sensing. 12(9):1426.
- Anquetin S, Yates E, Ducrocq V, Samouillan S, Chancibault K, Davolio S, Accadia C, Casaioli M, Mariani S, Ficca G, et al. 2005. Natural hazards and earth system sciences the 8 and 9 September 2002 flash flood event in France: a model intercomparison. Nat Hazards Earth Syst Sci 5:741–754.
- Aquaveo. 2020. Watershed Modeling System (WMS) Version 11 Tutorial. Aquaveo, LLC: Provo, UT, USA. [accessed 2020 January 7]. www.aquaveo.com.
- Asong ZE, Razavi S, Wheater HS, Wong JS, Asong ZE, Razavi S, Wheater HS, Wong JS. 2017. Evaluation of integrated multisatellite retrievals for GPM (IMERG) over southern Canada against ground precipitation observations: a preliminary assessment. J Hydrometeorol. 18(4):1033–1050.
- Behrangi A, Khakbaz B, Jaw TC, AghaKouchak A, Hsu K, Sorooshian S. 2011. Hydrologic evaluation of satellite precipitation products over a mid-size basin. J Hydrol. 397(3-4):225–237.
- Borga M, Stoffel M, Marchi L, Marra F, Jakob M. 2014. Hydrogeomorphic response to extreme rainfall in headwater systems: flash floods and debris flows. J Hydrol. 518:194–205.
- Chintalapudi S, Sharif H, Xie H. 2014. Sensitivity of distributed hydrologic simulations to ground and satellite based rainfall products. Water. 6(5):1221–1245.
- Chintalapudi S, Sharif HO, Yeggina S, Elhassan A. 2012. Physically based, hydrologic model results based on three precipitation products. J Am Water Resour Assoc. 48(6):1191–1203.
- Dang NM, Babel MS, Luong HT. 2011. Evaluation of food risk parameters in the Day River Flood Diversion Area, Red River Delta, Vietnam. Nat Hazards. 56(1):169–194.
- Dawod GM, Mirza MN. 2012. GIS-based estimation of flood hazard impacts on road network in Makkah city, Saudi Arabia. Environ Earth Sci 67(8):2205–2215.
- Dawod G, Resrach W, Mirza MN, Elzahrany R. 2013. Projected impacts of land use and road network changes on increasing flood hazards using a 4D GIS: A case study in Makkah metropolitan area, Saudi Arabia. April 2014.
- Deng L, Mccabe MF, Stenchikov G, Evans JP, Kucera PA. 2015. Simulation of flash-flood-producing storm events in Saudi Arabia using the weather research and forecasting model. J Hydrometeorol. 16(2):615–630.
- Dillon P, Stuyfzand P, Grischek T, Lluria M, Pyne RDG, Jain RC, Bear J, Schwarz J, Wang W, Fernandez E, et al. 2019. Sixty years of global progress in managed aquifer recharge. Hydrogeol J. 27(1):1–30.
- Downer CW, Ogden FL. 2004. GSSHA: model to simulate diverse stream flow producing processes. J Hydrol Eng. 9(3):161–174.
- Downer CW, Ogden FL. 2006. System-Wide Water Resources Program Gridded Surface Subsurface Hydrologic Analysis (GSSHA) User’s Manual Version 1.43 for Watershed Modeling System 6.1.
- ESRI. 2020. (Environmental Systems Research Institute), 2020: ArcGIS: Release 10.60. Redlands, CA, USA. ArcGIS® is the intellectual property of Esri and are used herein under license. Copyright © Esri. All rights reserved. For more information about Esri® software.
- Furl C, Sharif HO, El Hassan A, Mazari N, Burtch D, Mullendore GL, Furl C, Sharif HO, Hassan A, El Mazari N, et al. 2015. Hydrometeorological analysis of tropical storm hermine and Central Texas flash flooding, September 2010. J Hydrometeorol. 16(6):2311–2327.
- Gao W, Sui C-H. 2013. A modeling analysis of rainfall and water cycle by the cloud-resolving WRF model over the western North Pacific. Adv Atmos Sci. 30(6):1695–1711.
- GAS. 2020. General Authority of Statistics, Kingdom of Saudi Arabia), 2020: “Population Characteristics Ssurveys” 2017 report. [accessed 2020 January 7]. https://www.Stats.Gov.Sa/En.
- Goniewicz K, Burkle FM. 2019. Challenges in implementing sendai framework for disaster risk reduction in Poland. Int J Environ Res Public Health. 16(14):2574.
- GPM 2018. Precipitation Measurement Missions. Global Precipitation Measurement Program, NASA.
- GSSHA Primer. 2018. Gssha/GSSHA Primer - Gsshawiki.
- Hengl T, De Jesus JM, Heuvelink GBM, Gonzalez MR, Kilibarda M, Blagotić A, Shangguan W, Wright MN, Geng X, Bauer-Marschallinger B, et al. 2017. SoilGrids250m: Global gridded soil information based on machine learning. PLoS ONE. 12(2):e0169748.
- Hou Y, Kakar RK,; Neeck S, Azarbarzin AA, Kummerow CD, Kojima M,; Oki R,; Nakamura K, Iguch T. 2014. The global precipitation measurement mission. Bull Am Meteor Soc. 95(5):701–722.
- Huffman GJ, Bolvin DT, Braithwaite D, Hsu K, Joyce R, Kidd C, Nelkin EJ, Sorooshian S, Tan T, Xie P. 2018. NASA global precipitation measurement (GPM) integrated multi-satellite retrievals for GPM (IMERG). Algorithm Theoretical Basis Document (ATBD) February 1–31.
- Hussein K, Alkaabi K, Ghebreyesus D, Liaqat MU, Sharif HO. 2020. Land use/land cover change along the Eastern Coast of the UAE and its impact on flooding risk. Geomatics Nat Hazards Risk. 11(1):112–130.
- Khairy AT, Al-Ghamdi AS, Gutub SA. 2010. Analysis and design of a deep subsurface dam. International J Civil Environ Eng. 10(03):27–35.
- Khodadoust Siuki S, Saghafian B, Moazami S. 2017. Comprehensive evaluation of 3-hourly TRMM and half-hourly GPM-IMERG satellite precipitation products. Int J Remote Sens. 38(2):558–571.
- Mahmoud MT, Al-Zahrani MA, Sharif HO. 2018. Assessment of global precipitation measurement satellite products over Saudi Arabia. J Hydrol. 559:1–12.
- Ministry of Water and Electricity (MOWE). 2021. Rain gauge summary over the Kingdom of Saudi-Arabia. https://app.mewa.gov.sa/DailyRainsNews/Rain_Dams.aspx.
- Montanari A, Koutsoyiannis D. 2012. A blueprint for process-based modeling of uncertain hydrological systems. Water Resour Res. 48(9): W09555.
- Morris J, Beedell J, Hess TM. 2016. Mobilising flood risk management services from rural land: principles and practice. J Flood Risk Manag. 9(1):50–68.
- Ogden FL, Saghafian B. 1997. Green and Ampt Infiltration with Redistribution. J Irrig Drain Eng. 123(5):386–393.
- Prakash S, Mitra AK, AghaKouchak A, Pai DS. 2015. Error characterization of TRMM Multisatellite Precipitation Analysis (TMPA-3B42) products over India for different seasons. J Hydrol. 529:1302–1312.
- Prakash S, Mitra AK, Pai DS, Aghakouchak A. 2016. Advances in Water Resources From TRMM to GPM: How well can heavy rainfall be detected from space? Adv Water Resour. 88(December 2014):1–7.
- Richards LA. 1931. Capillary conduction of liquids through porous mediums. Journal of Applied Physics, 1(5):318–333.
- Schuurmans JM, Bierkens MFP, Schuurmans JM, Effect MFPB. 2007. Effect of spatial distribution of daily rainfall on interior catchment response of a distributed hydrological model. Hydrol Earth Sys Sci 11(2):677–693.
- Sharif HO, Al-Juaidi FH, Al-Othman A, Al-Dousary I, Fadda E, Jamal-Uddeen S, Elhassan A. 2016. Flood hazards in an urbanizing watershed in Riyadh, Saudi Arabia. Geomatics Nat Hazards Risk. 7(2):702–720.
- Sharif H, Al-Zahrani M, Hassan A. 2017. Physically, fully-distributed hydrologic simulations driven by GPM satellite rainfall over an urbanizing arid catchment in Saudi Arabia. Water. 9(3):163.
- Sharif HO, Chintalapudi S, Hassan AA, Xie H, Zeitler J. 2013. Physically based hydrological modeling of the 2002 floods in San Antonio, Texas. J Hydrol Eng. 18(2):228–236.
- Sharif HO, Hassan AA, Bin-Shafique S, Xie H, Zeitler J. 2010a. Hydrologic Modeling of an extreme flood in the guadalupe river in Texas. J Am Water Resour Assoc. 46(5):881–891.
- Sharif HO, Sparks L, Hassan AA, Zeitler J, Xie H. 2010b. Application of a Distributed Hydrologic Model to the November 17, 2004, Flood of Bull Creek Watershed, Austin, Texas. J Hydrol Eng. 15(8):651–657.
- Siddique-E-Akbor AHM, Hossain F, Sikder S, Shum CK, Tseng S, Yi Y, Turk FJ, Limaye A, Siddique-E-Akbor AHM, Hossain F, et al. 2014. Satellite precipitation data–driven hydrological modeling for water resources management in the Ganges, Brahmaputra, and Meghna Basins. Earth Interact. 18(17):1–25.
- Smith M, Koren V, Reed S, Zhang Z, Seo DJ, Moreda F, Cui Z. 2006. The Distributed Model Intercomparison Project: Phase 2 Science Plan.
- Smith MB, Koren V, Zhang Z, Zhang Y, Reed SM. 2012. Results of the DMIP 2 Oklahoma experiments. Hydrology. 418–419:17–48.
- Stisen S, Sandholt I. 2010. Evaluation of remote-sensing-based rainfall products through predictive capability in hydrological runoff modelling. Hydrol Process. 24(7):879–891.
- Su F, Hong Y, Lettenmaier DP. 2008. Evaluation of TRMM multisatellite precipitation analysis (TMPA) and Its utility in hydrologic prediction in the La Plata Basin. J Hydrometeorol. 9(4):622–640.
- Sungmin O, Foelsche U, Kirchengast G, Fuchsberger J, Tan J, Petersen WA. 2017. Evaluation of GPM IMERG early, late, and final rainfall estimates with WegenerNet gauge data in southeast Austria. Hydrol. Earth Syst. Sci. 21:6559–6572.
- Tang G, Ma Y, Long D, Zhong L, Hong Y. 2016. Evaluation of GPM Day-1 IMERG and TMPA Version-7 legacy products over Mainland China at multiple spatiotemporal scales. J Hydrol. 533:152–167.
- Tekeli AE, Fouli H. 2016. Evaluation of TRMM satellite-based precipitation indexes for flood forecasting over Riyadh City, Saudi Arabia. J Hydrol. 541:471–479.
- Thieken AH, Kienzler S, Kreibich H, Kuhlicke C, Kunz M, Mühr B, Müller M, Otto A, Petrow T, Pisi S, et al. 2016. Review of the flood risk management system in Germany after the major flood in 2013. Ecol Soc. 21(2):51.
- Veerbeek W, Ashley R, Zevenbergen C, Rijke J, Gersonius B. 2012. Building adaptive capacity for flood proofing in urban areas through synergistic interventions. 1–8.
- Vergara H, Hong Y, Gourley JJ, Anagnostou EN, Maggioni V, Stampoulis D, Kirstetter P-E, Vergara H, Hong Y, Gourley JJ, et al. 2014. Effects of resolution of satellite-based rainfall estimates on hydrologic modeling skill at different scales. J Hydrometeorol. 15(2):593–613.
- Wang Z, Zhong R, Lai C, Chen J. 2017. Evaluation of the GPM IMERG satellite-based precipitation products and the hydrological utility. Atmos Res. 196(May):151–163.
- Waylen KA, Holstead KL, Colley K, Hopkins J. 2018. Challenges to enabling and implementing natural flood management in Scotland. J Flood Risk Manag. 11:S1078–S1089.
- Wood EF, Roundy JK, Troy TJ, van Beek LPH, Bierkens MFP, Blyth E, de Roo A, Döll P, Ek M, Famiglietti J, et al. 2011. Hyperresolution global land surface modeling: meeting a grand challenge for monitoring Earth’s terrestrial water. Water Resour Res. 47(5):W05301.
- Xie B, Zhang F, Xie B, Zhang F. 2012. Impacts of typhoon track and island topography on the heavy rainfalls in Taiwan associated with Morakot (2009). Mon Weather Rev. 140(10):3379–3394.
- Youssef AM, Sefry SA, Pradhan B, Alfadail EA. 2016. Analysis on causes of flash flood in Jeddah city (Kingdom of Saudi Arabia) of 2009 and 2011 using multi-sensor remote sensing data and GIS. Geomatics Nat Hazards Risk. 7(3):1018–1042.
- YtNature-Phenomena of Our World. 2018. Lightning Storm & Flooding in Mecca, Saudi Arabia (Nov 23, 2018) [Video]. https://www.youtube.com/watch?v=MFdGhXsv2gU.
- Zeweldi D, Gebremichael M. 2011. On CMORPH rainfall for streamflow simulation in a small, Hortonian watershed. Hydrometeorology. 12(3):456–466.
- Zhan X, Huang ML. 2004. ArcCN-Runoff: an ArcGIS tool for generating curve number and runoff maps. Environ Model Softw. 19(10):875–879.