
 ?Mathematical formulae have been encoded as MathML and are displayed in this HTML version using MathJax in order to improve their display. Uncheck the box to turn MathJax off. This feature requires Javascript. Click on a formula to zoom.
Abstract
People’s vulnerability, exposure and capacity are key components of a risk assessment. Index-based methodologies have proved useful to document spatial variation in risk-controlling factors. The objective of this study is to propose a methodology to derive quantitative indicators of household vulnerability, exposure and capacity to assess household’s risk and its spatial variation. The method is applied to six unions of the coastal region of Bangladesh, including three offshore islands. Field data are collected by questionnaire survey of 609 households and 6 focus group discussions. Using conventional data conversion and aggregation methods and principle component analysis (PCA), the variables are summarized into a small set of dimensions to derive vulnerability and capacity scores. Result shows that households of islands are generally more vulnerable to natural hazards than nearby onshore unions. Unions of the central coast of Bangladesh are characterized by households with higher vulnerability and lower capacities than two other parts. The fatality rate of cyclone SIDR at village level is used to validate the spatial variation of household risk for one surveyed union. The proposed methodology and produced maps could support national to local government bodies in assessing household risk and identifying locations where to implement specific risk reduction measures.
1. Introduction
Bangladesh is one of the countries expected to be most severely affected by climate change (Rawlani and Sovacool Citation2011). The magnitude and/or frequency of natural hazards will likely increase due to future changes in climate pattern (IPCC Citation2014). Vulnerability of the Bangladesh population to climate hazards has been studied at local to regional scales (Islam et al. Citation2016; Quader, Khan et al. Citation2017; Mullick et al. Citation2019). Most risk assessment studies, in Bangladesh or elsewhere around the world, are either qualitative in nature or quantitative but aggregated at the level of administrative units for which statistical data are available (De Andrade et al. Citation2010; Esnard et al. Citation2011; Islam et al. Citation2013; Poompavai and Ramalingam Citation2013; Quader, Khan et al. Citation2017). Although this scale can be useful to highlight regional patterns, it involves using average statistical indicators and might mask spatial or socio-economic disparities between individuals of a community.
The impact of disasters at a local scale has been shown to depend on characteristics of individuals and households controlling their vulnerability and resilience (Paul Citation2010; Mwale et al. Citation2015). A household is a unit of a group of people, relatives or non-relatives, who live together and are used to cook in the same kitchen (BBS Citation2011). The household’s risk can be considered as the combined effect of the probability of the hazard to occur, the household’s exposure to the hazard, its vulnerability to be negatively affected as well as its capacities to face and cope with the impacts. To assess the risk at household level, it is therefore necessary to assess each of these components of the risk equation (i.e. hazard × vulnerability × exposure/capacity). At a local spatial scale, it is reasonable however to assume that the frequency and magnitude of hydrometeorological hazards will be spatially homogeneous, and that the hazard intensity affecting an individual household is controlled by local exposure factors.
There is a growing concern of governments to minimize the negative impacts of climate-driven hazards. There is however no standard methodology to systematically document and assess the factors controlling the vulnerability of households, their exposure and their capacity to face and cope with the impacts of natural hazards. Assessment of risk at household level requires time-consuming data collection through door-to-door household survey. Such assessment and mapping are however essential in order to recommend and support implementation of relevant household-level disaster risk reduction measures.
The household vulnerability is the characteristics of the people living in a house that make them more likely to suffer from disaster and have more difficulties to recover (Chang et al. Citation2015). Quantitative assessment of the vulnerability at household level is rare, and often not spatially explicit (Tate Citation2012; Ruiter et al. Citation2017; Tran et al. Citation2017; Michellier et al. Citation2020). Few studies have proposed vulnerability assessment at household-level for climate-driven hazards using questionnaire surveys: they generally focused on documenting livelihood vulnerability based on qualitative evidence but did not map the spatial variation across inhabitants of a community (Ahsan and Warner Citation2014; Toufique and Islam Citation2014; Tran et al. Citation2017; Yadav and Barve Citation2017). Previous studies highlighted key dimensions and indicators of vulnerability at local level: the most common variables considered are related to the social and economic characteristics of the household as well as the structural condition of the house (Hossain Citation2015; Uddin et al. Citation2019). The household’s capacity to face disasters generally integrates indicators related to the knowledge of the hazard and the way to react to it, as well as measures implemented to prevent or mitigate the impact of future hazards (Rawlani and Sovacool Citation2011; Martinich et al. Citation2013).
Households living along the coastline of Bangladesh are most exposed to the direct impact of cyclones, storm surges and flooding (Akter and Mallick Citation2013; Mallick and Vogt Citation2015). In this contribution, we present and implement a quantitative method to assess the risk of individual households across six unions of the Bangladesh coast (). We specifically targeted one offshore and one onshore administrative unit (i.e. unions) in each of the three coastal zones. For each of these unions, we document indicators of vulnerability, exposure, capacity and risk of a representative set of households through a detailed field survey. We propose a methodology to derive quantitative estimates of the risk components – as defined by UNISDR (UNISDR Citation2004) – at household level based on aggregation of the documented indicators. The objective of the study is to identify and map the risk of households to natural hazards and their spatial variation across the coast of Bangladesh. The results are analyzed to document spatial patterns within, but mostly between, the six different administrative units, with specific attention for the offshore–onshore contrast. The results are finally compared to a regional level risk assessment based on average statistical indicators (Quader, Khan et al. Citation2017) and validated against the documented impacts of a recent fatal cyclone. The discussion analyzes the contribution of the different risk components to the risk of households, the factors controlling the observed spatial patterns and highlights the potential of the proposed method to support spatially differentiated disaster risk reduction approaches targeting households most at risk.
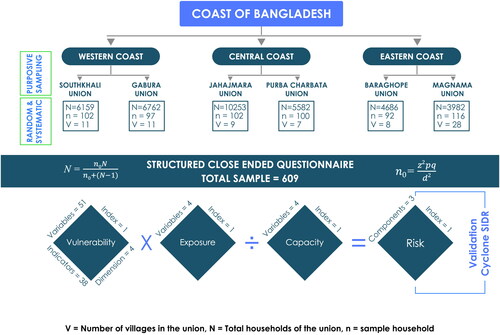
Figure 1. Flow diagram of the method implemented for the household risk assessment. Sampling methods to select the unions and households are mentioned in the green rectangles (N: total number of households, V: number of villages; n: number of surveyed households).
2. Methods
2.1. Household sampling and data collection process
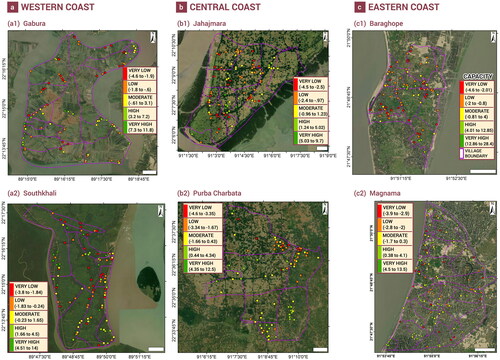
There are three coastal zones in the coastal area of Bangladesh (). Six unions have been selected as study area by purposive sampling (). The unions were identified as having a medium to very high exposure and vulnerability to cyclones () in the regional risk assessment study by Quader, Khan et al. (Citation2017). Among the two selected unions of each zone, one is an island whereas the other is a nearby coastal union from the mainland. This contrast between mainland and island unions is chosen to represent local variation in exposure and vulnerability associated with more isolated island contexts.
Figure 2. Map showing the location of the six study unions in the Bangladesh coastal area. Inset map at the topmost right is showing the location of the coast in the map of Bangladesh. Six other inset maps are showing the enlarged study unions with their surroundings. B1 and C1 are offshore islands; A1 is a riverine island. The three other unions are on the mainland. White points on each sub-map indicate the location of the surveyed households. Background images are displayed from ESRI base map of high-resolution satellite imageries.
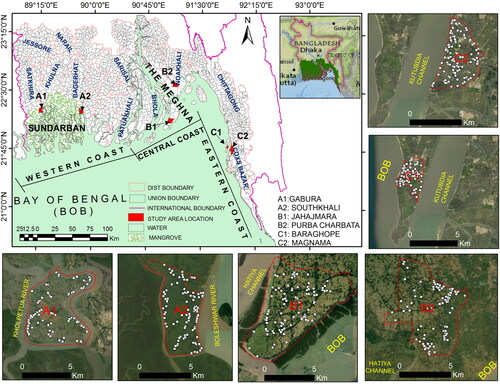
Table 1. Summary statistics of the unions selected as study areas. Gabura, Jahajmara and Baraghope are three islands, the other three are mainland unions.
We followed a mixed approach of both quantitative and qualitative data collection techniques. Six hundred and nine households were surveyed after random sampling. Two focus group discussions (FGD) were organized in each union with representatives of the local population. The detailed sampling procedures, data collection methods and data analysis process are explained in Supplementary material A.
2.2. Household vulnerability index
As arguments to define a limited number of variables to assess vulnerability at household level are lacking in the literature, it is difficult to apply a deductive approach. We, therefore, here followed an inductive data-driven approach with a wide range of indicators potentially related to vulnerability and reduced to a limited number of key dimensions (Uddin et al. Citation2019). Variables, that are used in literature to assess the social, economic, physical and demographic dimensions of the vulnerability at individual, household or administrative levels, in Bangladesh and other parts of the world, were considered (, Tate Citation2012; Chen et al. Citation2013; Rufat et al. Citation2019). We did not account for political and environmental dimensions of vulnerability assuming homogeneity of the political ecology and environmental quality indicators within our small study areas.
Table 2. Spatial variability of the mean scores of vulnerability, exposure, adaptation and risk indexes in the coast of Bangladesh calculated from average scores of surveyed households.
Indicators built up from the survey variables were analyzed using a principal component analysis. The vulnerability index per household was constructed by the weighted sum of the PCA factors with eigenvalue above 1. Further description can be found in Supplementary material B.
2.3. Household exposure index
The coast of Bangladesh is exposed to several hazards like cyclones, storm surges and coastal flooding. The extent and characteristics of these hazards can be considered homogeneous at the scale of individual union, but the intensity experienced by each household can be accounted by spatial exposure factors (Kumar et al. Citation2011). Four spatial indicators are considered to calculate the exposure of households: the distance of households to the nearest road, to the nearest cyclone shelter, to the coastline and their location relative to the embankment. As people living in the coast always looks for the nearest road and cyclone shelter to evacuate during disasters, these two variables are considered as exposure indicators (Paul Citation2009, Citation2012; Paul and Dutt Citation2010; Mallick et al. Citation2017; Hossain and Kumar Citation2018). The distance of a household to the coastline and its location relative to the embankment are relevant for the exposure to flooding induced by storm surge. Absolute elevation above sea level would also be a relevant indicator but this data is not available with a sufficient level of accuracy to be used at local scale where variations in elevation are limited (e.g. 96% of all areas within unions <10 m a.s.l; Supplementary Figures S1 and S2). Further details on data source and aggregation of the four exposure indicators is provided in Supplementary material C.
2.4. Household capacity index
The ability of a household to withstand losses, damages and recover from the impact of a disaster is termed capacity (Orencio and Fujii Citation2013; Nguyen et al. Citation2016). Structural capacity includes the physical measures to protect housing and other infrastructures. Non-structural measures include policies, preparedness plans and forecasting before natural hazard strikes. We focus on adaptation practices implemented by the coastal inhabitants and their direct community (Sarwar and Islam Citation2013). The survey documented the implementation of a series of adaptation practices, including DRR (Disaster Risk Reduction) actions in five sectors (i.e. agriculture, water resources, livelihood diversity, community level and household level) as well as the participation in union’s committees and the access to various sources of information (Rahman et al. Citation2017).
Indicators regarding the different adaptation strategies were collected in the survey and aggregated into eight indicators: Adaptation in agriculture, Adaptation in water resource, Adaptation in Livelihood, Adaptation at community level, Adaptation at own house, Members of social and hazard committees, Sources of warning messages and Plinth height. All the indicators are summed up to calculate the final capacity index. We have grouped these indicators into two dimensions namely (a) adaptation strategies and (b) access to hazard information and networking for convenience in discussion. Further details on the aggregation method are provided in Supplementary material D.
2.5. Household risk index mapping method
The equal hazard risk equation (EquationEq. 1(1)
(1) ) is applied for each household to assess the household risk. As the hazard is not considered, this risk index assumes an equal hazard probability for all households: whereas this assumption is justified within each union, it requires caution when comparing the risk values between unions facing different hazard probability. We used natural Jenks method (as it depends on the natural grouping inherent in the data) to map the degree of risk into five categories from very low to very high for each union. As we used natural Jenks method separately for each union, the class boundaries of risk of each union are not the same – this is required for correct visualization of risk pattern at local level.
(1)
(1)
A two-sample t test was applied to compare distribution of vulnerability, exposure and capacity scores between islands and mainland unions and between the three coastal zones. Equal variance in the dataset is tested by Levenes’s test.
The location of each interviewed household was documented by hand-held Garmin GPS receiver. The boundaries between villages of each union were mapped with GPS with the help of local representatives (i.e. Union Parishad Member). Villages are used to aggregate households’ risk indices and identify systematic spatial pattern across unions.
Cyclone Sidr that hit the coast of Bangladesh in November 2007 is one of the recent cyclones that had a significant impact on the Western coast of Bangladesh, and the only one for which detailed impact statistics could be obtained (Quader, Agrawal et al. Citation2017). The death list of cyclone Sidr at Southkhali union was provided by the Project Implementation Officer (PIO) of the union. A total of 578 fatalities attributed to cyclone Sidr within six weeks of the cyclone landfall was disaggregated per village and ratio of death per population of each village was calculated. This fatality ratio is compared to the average household risk value per village derived from our method as part of the external validation of the presented household risk assessment.
3. Results
3.1. A Data-driven household vulnerability index
A total of 15 factors explaining 62% of the total dataset variance among the 38 indicators surveyed for each household were extracted by PCA. To make the interpretation clearer, we regrouped these factors into four dimensions (Supplementary Table S1).
3.1.1. Physical and financial assets
The first dimension regroups seven factors including the first three of the PCA and accounts for 29% of the total dataset variance. These factors concern the households’ income, communication device and family size, physical assets, standards of living, access to insurance and banking, assets used by wealthy people, ownership of fishing tools and radio receiver and ownership of human paddled vehicles. Five factors including the first two are considered to reduce the household’s vulnerability (Supplementary Table S1) while the other two (i.e. low standard of living, lack of access to insurance and banking service) increases vulnerability in agreement with the way the respective indicators are coded (Supplementary Table S2).
Monthly income, total number of cell phones and size of the family are the determining indicators for the first factor. Livestock potential, ornaments and rice productions are the indicators that constrain the second factor. Livestock potential is a weighted indicator from the eight variables of domestic animals (Supplementary Table S2). Lack of proper sanitation plays the main role in the third factor where unhygienic toilets are considered as the highest degree of vulnerability (Islam et al. Citation2014b; Toufique and Islam, Citation2014). Absence of insurance coverage and non-accessibility to banking facilities, loaded positively to the third factor. The coverage of insurance and banking is assumed to have a positive influence on reducing vulnerability as households can rely on loans or insurance service to cope with the material damage of a disaster (Koks et al. Citation2015; Mwale et al. Citation2015). Land property and presence of a television in the house are positively loaded in the factor named ‘assets used by wealthy people’. As confirmed by the FGD participants, landless households are more vulnerable as they do not own permanent property and they are also deprived from relief after the disaster. One of our FGD respondent stated:
“A remarkable portion of the population in this union is landless. People who do not have land, do not have the access to the basic facilities (i.e., health treatment, social safety net programmes etc.) as these require national identity card. They either do not have such document or issued other location where they do not live. Therefore, they are not included in the list of relief distribution made by local representatives after disaster” (Male respondent, Mogdal, Baraghope Union, Eastern Coast).
Fishing nets and radio receivers are the two essential assets for fishermen for their livelihood and access to weather-related information. This factor six is attributed a negative sign based on the fact that having these two assets reduce the vulnerability (Alam and Rahman Citation2014; Islam et al. Citation2014a). ‘Human powered vehicles’ is the only indicator that belong to the last factor of this dimension. This indicator is a weighted composite of the three variables (i.e. van, rickshaw and bi-cycle). As this factor relates to income-generating assets it is considered to reduce the vulnerability (Supplementary Table S2).
3.1.2. Livelihood and skills
The second dimension is composed of three factors: knowledge on life saving techniques; training and diversity in livestock and vegetables and place of working. These three factors explain 12% of the total variance of the dataset. Lack of ability for climbing trees and swimming, contributing to increase the chance of death by cyclone, are the main indicators loading on the first factor of this dimension (Fakhruddin and Rahman Citation2015). The diversity of cattle and vegetable types are controlling the second factors, which is interpreted to reduce vulnerability, as a high diversity in animal and plant production provide a higher flexibility to adapt to changing conditions (Haq et al. Citation2012; Shameem et al. Citation2014). It is noteworthy that the ‘lack of training on natural hazards’ negatively loads on the same factor. The proportion of family members with distant working place (places from where one cannot reach home shortly if there is any emergency) is the indicator of the last factor of this dimension. This is considered as a positive contributor to vulnerability as the working members cannot reach home to help their family during disaster.
3.1.3. Demography
Four demography-related factors are grouped in the third dimension (14% of total variance). The two indicators of the first factor, the economic dependency ratio and life-long unmarried people, have opposite loading and are thus negatively correlated. This factor is interpreted as contributing to increase the vulnerability as economic dependency increases vulnerability (Fekete Citation2010). The contribution of bachelor (life-long unmarried person) to the vulnerability was undefined but its negative correlation with the economic dependency ratio suggests that it contributes to decrease the vulnerability. Our FGD participants in Magnama and Southkhali unions also confirmed that life-long bachelor people are free from responsibilities: having less assets to take care of, they can evacuate faster than those having a large family and may help others for evacuation and rehabilitation works.
The major indicators of the second factor are the proportion of migrants within the family (i.e. immigration of the female after marriage), and the presence of unmarried men and women in the household. This factor is assigned as positive contribution to vulnerability assuming the difficulties that migrants, less familiar with the local hazards, might face in emergency events would increase the vulnerability. The proportion of unmarried person at legal age is negatively loaded on this factor, meaning that late marriage might be associated to household with lower vulnerability. The third factor is controlled by the female-headed household. As female headed households are identified as generally more vulnerable than male headed ones in the literature (Paul and Routray Citation2011; Cutter Citation2017; Supplementary Table S2), this indicator is assumed to positively contribute to vulnerability. The indicator ‘number of years of residence’ belongs to the last factor of this dimension. This factor is assigned a negative sign as several participants of FGD confirmed that the longer the family has been living in the same place, the more experienced and capacities they have to face the hazards (Islam et al. Citation2014a).
3.1.4. Religious minority
Religious minority is the only factor that belongs to this fourth dimension, that explains 3% of the total variations among households. The indicator ‘religion’ identifies household belonging to religious minorities, i.e. non-muslim families. It is assumed that belonging to a religious minority contribute to marginalization of the household and therefore contribute to its higher vulnerability (Morrow Citation1999; Mallick et al. Citation2011; Huang et al. Citation2015).
3.2. Distribution of vulnerable households
Vulnerable households are not distributed homogeneously within each of the studied union. High and very high vulnerable households are concentrated in north eastern and south western parts of Gabura island close to the coastline (), and within the northern half of Southkhali union (). There is no spatial pattern in the distribution of high and very high vulnerable households in Jahajmara, Baraghope and Magnama unions (, c1, c2)). The high and very high vulnerability households of Purba Charbata union are agglomerated in eastern and southern parts that are closer to the coast (). Low and very low vulnerable households are spatially distributed in between households with higher vulnerability in all unions except Purba Charbata union, where low to very low vulnerability households are segregated in the western part of the union, away from the coast.
Figure 3. Maps showing the degree of vulnerability of surveyed households in six unions of the coast of Bangladesh. Location of the unions is illustrated in . Cut off point of five classes of vulnerability has been done by using natural jenks methods with different class boundaries for each union.
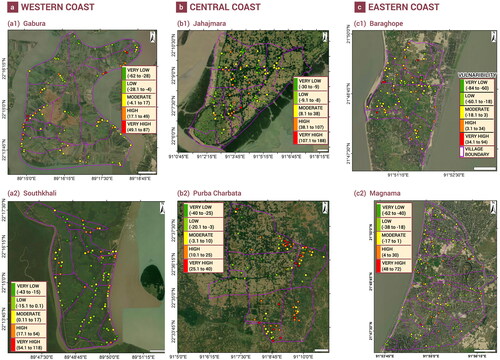
The average vulnerability of sampled households of island unions is systematically higher than the mainland union in the same coastal zone. This difference is, however, only statistically significant for the eastern coastal region (). Vulnerability scores of the central coast is significantly higher (at 99% confidence level) than the other two coastal zones, i.e., west and eastern coast. The Eastern coastal region has the lowest average vulnerability ().
3.3. Households’ exposure and spatial variability
The households’ exposure is strongly controlled by the distance to the sea () and the localization relative to the embankments, which cause household close to the coastline to be generally more exposed to hazards, e.g. in case of Baraghope and Magnama union (). There is a concentration of low and very low exposed households in the central parts of the six unions. There is a linear distribution of high and very highly exposed households along the bank of the Kholpetua river in the north eastern part of the island in western coast. This is quite logical as we considered the river as coastline in case of Gabura union. The variation in distance to road and cyclone shelters have a negligible effect compared to the other two variables, as roads and shelters are distributed quite homogeneously across each union.
Figure 4. Maps showing the degree of exposure of the surveyed households in six unions of the coast of Bangladesh. The aggregated degree of exposure of each household is calculated based on four indicators: (a) distance from the coast, (b) distance from the nearest road, (c) distance from the nearest cyclone shelter and (d) location of households in respect to the embankment. Location of the unions in respect to the sea is visible in .
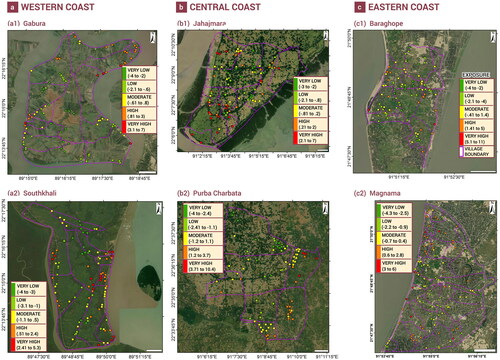
Households of islands are on average more exposed than that of mainland unions in the central and eastern coastal regions; whereas the opposite holds true for the western coast (). The eastern and central coasts have the highest and lowest mean exposure values, respectively. These differences in the mean exposure values are however not statistically significant either between island and mainland unions or among all the three coastal zones.
3.4. Assessment of capacity of household to natural hazards
3.4.1. Adaptation strategies
This dimension includes the adaptation practices in agriculture, water resource, livelihood, community and own household. Adaptation scores in agriculture and water sectors are higher in islands than in mainland unions in the three coastal zones, although these differences are not always statistically significant (). Water resource adaptation practices are significantly more common in the western coast than in the other two coastal zones. FGD participants of Gabura union noted the scarcity of drinking water due to salinity intrusions induced by storm surges, explaining the need to implement water adaptation measures. Livelihood adaptation is more practiced in the eastern coast compared to the two other zones and this difference is statistically significant. Local people of the eastern coastal zone reported the frequent loss of their livelihood due to natural hazards while discussing the impact of disasters in FGDs in Baraghope and Magnama unions. This forces them to migrate temporarily to other places for alternative livelihoods and female members of households engage themselves in cottage industry. Community level adaptation is not practiced by respondents in the Central coast zones, whereas these are significantly more common in the western zone than the eastern one. Although no statistical significance is found, adaptation scores at own house is larger in the central zone than that of the other two coastal zones. Higher adaptation practices at the residents’ own houses is mostly documented in Purba Charbata, the mainland union of the central coast. Considering the implementations of adaptation measures in all sectors together, it is noticeable that the respondents of the island unions on the Western and Eastern coasts develop a more diverse and larger number of adaptations measures than those of other unions.
Figure 5. Stacked bar charts of mean scores of adaptation practices of surveyed households in six study unions of the three coastal zones. (a) Mean adaptation scores of five adaptation sectors. (b) Access to hazard information and networking. (c) Mean plinth height. Asterisk on the bars indicates significant differences between unions and those at the right side of the graphs denotes the same among coastal zones (‘*’ and ‘**’ significant difference at 0.05 and 0.01, respectively).
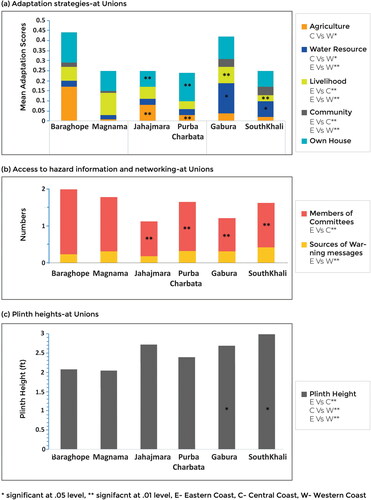
3.4.2. Access to hazard warning and networking
The participation of respondents in different committees related to hazard management and social welfare is low to very low, with limited differences between unions. The number of memberships is slightly higher in the mainland than island unions, although the difference in statistically non-significant (). People in island and mainland unions of the eastern coast have access to a similar number of warning sources, and this number is significantly higher than in the other coastal zones. In the central and western coastal zones, the number of information sources is significantly higher in mainland unions than that of islands. Average plinth height is significantly higher in the island (2.70 ft) than in the mainland (2.22 ft) union in the central coast zone. The average plinth height is nearly similar in the unions of the eastern coast and slightly higher in the mainland than the island union in the western coast ().
3.5. Capacity at household level: spatial pattern and distribution
Spatial patterns in the household capacity index are observed for some unions. Households with low to very low capacity are mostly concentrated in the villages located in the north of Gabura island and in the northern part of Purba Charbata union. No specific pattern is observed for the Southkhali, Jahajmara, Baraghope and Magnama unions (, b1, c1, 6c2)). The locations of households with high capacities to face hazards are typically surrounded by other households with similar capacity i.e., high to very high capacities in all the studied unions except in Magnama.
Figure 6. Maps showing the degree of capacity of surveyed households in six unions of the coast of Bangladesh. Capacity scores of each union are calculated from the indicators of two dimensions namely (a) adaptation strategies and (b) access to hazard information and networking.
No systematic differences are observed between average household’s capacity of island and mainland unions within each coastal zone. The mean capacity values of islands in western and eastern coastal zones are slightly higher than that of mainland, while the opposite is true for the central coastal zone (), but these differences are not significant.
The capacity of the households is significantly different at 99% confidence level between the central and eastern zones; at 95% confidence level for the other pairs (). The mean capacity score of the households in the central coast is the lowest among the three zones, and it is the highest in the western coast. People of the central coast last faced a major cyclone in 1991 (reported in FGD response in Jahajmara union). Catastrophic cyclone’s impacts have disappeared from people’s memory due to absence of recent disasters, which led to lower motivation of them to implement community level adaptation practices. The lowest capacity scores in central coast can therefore be accounted by this absence of community level adaptation (i.e. Pond Sand Filter [PSF], rainwater harvesting at community scale, afforestation etc.) ().
3.6. Risk at household level and their spatial variation
Coastal households are at different level of risk to natural hazards. The level of risk of each household is categorized into five classes in each union, based on the application of EquationEq. 1(1)
(1) . As the class boundaries of the degree of risk are different in each union based on natural Jenk’s classification, the risk maps of unions are not directly comparable. illustrates the spatial distribution of the household risk index and the average value per village within each union. The villages in the north of Gabura have few dispersed households at high and very high risk (), associated with overall high exposure but variable vulnerability and capacity values. There is only one household at high risk in the southern villages of Gabura union. The other unions do not show any spatial pattern on the distribution of high and very high risk households, nor of low and very low risk ones, except some spatial clusters in Jahajmara and Purba Charbata unions.
Figure 7. Maps showing the degree of risk of the surveyed households in six unions of the coast of Bangladesh. Risk of each household is calculated by the product of exposure and vulnerability, divided by capacity, it does not consider the difference in the frequency and magnitude of hazard affecting the different unions. Background colour is representing the degree of risk of each village calculated from the average risk scores of the surveyed households of each village.
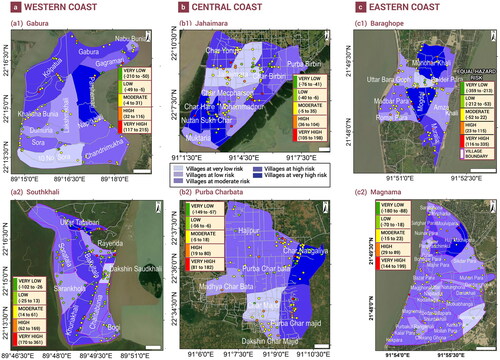
shows that the average equal hazard risk scores of the islands are higher than mainland except for the western coast. These contrasts are not statistically significant due to the high internal variability within each union but are reinforced by the fact that the hazard is also expected to be larger for islands (). The higher ‘equal hazard risk’ of the mainland union in the western coast may be accounted for by the fact that its households, despite a lower vulnerability, have a higher exposure and lower capacity. This is however not confirmed by the regional approach and can be compensated by slightly lower hazard in the mainland union. Households at high and very high risk are located in the villages distant from the Sundarban mangrove forest (the only mangrove forest in Bangladesh): this is valid both for the island and mainland union of the Western coastal zone. No spatial pattern is noted in the distribution of the high and very high risk households in the eastern coast. Low risk households are however dominantly situated in the villages in the central part of the island, far away from the coastline, suggesting that the exposure to the hazard plays a dominant role in the risk index in case of island.
Although not statistically significant, the average ‘equal hazard risk’ scores of the households located within the central coast zone are the highest among the three coastal zones and that of the eastern coast is the lowest. The latter is mainly due to the lower vulnerability values (). The average risk for the western coastal zone is almost as large as the one for the central coastal zone, due to the lower exposure but higher vulnerability of households.
Figure 8. Box plots and scatter diagrams of the calculated household risk indicator and its components. Red and green colours represent island and main land unions respectively.
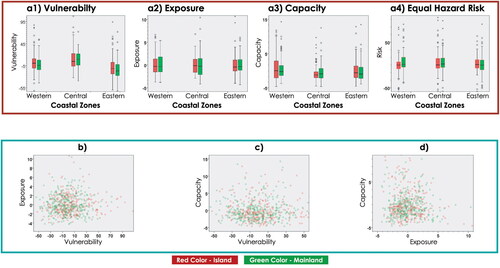
Considering all the households across the six unions, there is no statistical correlation between the three risk components, i.e. vulnerability, exposure and capacity, used to assess household risk in this research (). Correlations between the three risk components vary between the different unions and coastal zones and are systematically low to insignificant. Significant positive correlations are observed between the vulnerability and capacity components in the western and central coastal zones, but this correlation is negative in the eastern zone (). A contrast in the correlation of exposure and capacity is observed between island and mainland (i.e. more households of islands with lower exposure and higher capacity than that of mainland unions) ().
4. Relations of the risk indices and cyclone Sidr fatalities at village level
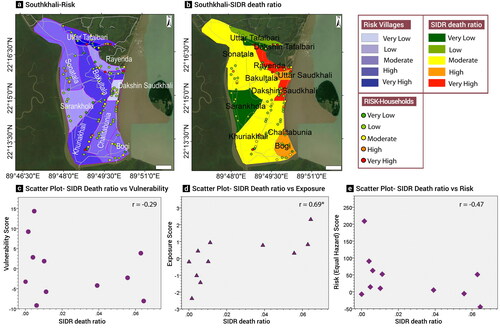
The village-level fatality ratio for the Sidr cyclone of Southkhali union is used to compare with the risk index and its components (). Visual comparison of the equal hazard risk map and death ratio map shows that the two villages in the western part of the union i.e. Sonatala, Sarankhola, are at low to very low risk and experienced low fatalities, probably due to their greater distance from the shoreline. For the rest of the union, the pattern of the death ratio is not following the one of the risk maps: the death ratio is much higher for the villages along the coastline, whereas these display an intermediate risk compared to more central villages. The death toll of cyclone Sidr per village is strongly and positively correlated with the average exposure of the households of each village (), whereas the vulnerability and risk indices show a moderate negative, but not significant, correlation. This suggests that for risk of fatality, the exposure index plays a dominant role compared to vulnerability and capacity factors that might rather affect the physical impacts and capacity of the household to cope with these impacts on the longer term.
Figure 9. Map of the death ratio from cyclone SIDR that devastated Southkhali union on 15 November 2007. (a) Risk map of the Southkhali union. (b) Death map of the Southkhali union at village level. Death ratio (total number of deaths divided by the population) is mapped and classified in five classes based on natural jenks method. (c–e) Scatter plots of the death ratio against the mean standardized vulnerability score per village (c), mean standardized exposure score per village (d) and the mean standardized risk score per village (e). Value of the correlation are given in the upper right corner of each scatter plot (‘*’ significant difference at 0.01).
5. Discussion
5.1. A Method to assess risk component at household level
Previous studies assessing vulnerability, more specifically social–economic vulnerability, used a wide variety of variables based on data available for the chosen administrative scale (Yoon Citation2012; Zanetti et al. Citation2016; Anderson et al. Citation2019). Some key variables are included in the majority of the studies i.e. age, education, income, dependency ratio etc. (Schmidtlein et al. Citation2008; Tate Citation2012; Wang & Yarnal Citation2012), others are specific to the context but generally inform about the access of the households to different resources and capitals. A majority of the 51 variables used in this study to assess the household vulnerability is used in previous studies. However, ethnicity, frequently used in vulnerability assessment, is excluded from our vulnerability index as the variation among the surveyed households is very limited leading to a low loading in the principle component analysis.
The 15 factors identified by PCA, summarizing each several variables partly contrast with results from previous vulnerability assessment. This is not surprising as our study also included variables specifically addressing the vulnerability to climate driven natural hazards at household level along the coast of Bangladesh. For example, some of the factors, i.e. physical assets, knowledge of life saving techniques, training and diversity in livestock and vegetables, are less common in other regional studies but they are important the local context of our case study. There is criticism of using statistical reduction techniques to aggregate vulnerability index as the main factors extracted highlight sets of variables that are mutually correlated with each other, irrespective of their link with vulnerability (Hinkel Citation2011). We included both variables that are used and also that are not considered in other vulnerability studies. The fact that most variables that come out of the PCA are common to previous studies is a qualitative validation for the suitability of the developed vulnerability index in this study. The variables used in this study might need to be adjusted if there are to be used in another context, but indicators and dimensions of this study can be used for household level vulnerability assessment across the coast of Bangladesh.
The strong control of the variable ‘distance to coastline’ on our exposure index is similar to the findings in the regional risk assessment by Quader, Khan et al. (Citation2017). We also considered the position of households relative to embankment in this study as an exposure indicator: households protected by embankment are indeed less likely to be impacted by storm surge and coastal flooding, except when the embankment breach (Bhuiyan & Dutta Citation2012; Auerbach et al. Citation2015). Victims of previous cyclones and floods have often resettled on the coastal embankment as temporary shelter and a portion of them cannot get back to their original residence. As one male FGD participant (age 55) of Gabura village stated,
“(With deep sorrow) We evacuated to the embankment when cyclone (referring to cyclone Aila) washed away our house and the next day we could not locate it. We built a small house with Golpata (leaf of a mangrove tree) and still living in the same place. As we do not own land and used to live in a government land before the cyclone, we cannot leave the place. But we are always scared of cyclones.”
The number of implemented adaptation practices are used as one of the variables to assess the capacity of the households in this study. Using adaptation practices aiming at multiple natural hazards and disaster risk reduction strategies together as capacity indicators, covered the most possible indicators to assess the capacity at household level. Although all the variables used for capacity assessment in this study are not systematically documented in risk assessment studies in Bangladesh, these are described as risk reduction strategies in several qualitative risk assessment research and cover all the relevant DRR strategies identified as implemented in the case studies (Ahammad et al. Citation2013; Mallick et al. Citation2017; Sattar and Cheung Citation2019; Malak et al. Citation2020).
5.2. Spatial distribution of household vulnerability, exposure, capacity and risk
The spatial distribution of the households with contrasted degrees of vulnerability, exposure, capacity and risk throughout the sampled unions shows complex spatial patterns. One has to keep in mind that the spatial pattern obtained from the surveyed households might not be representative of the spatial distribution of all households within a union. As this is the first paper with a new approach of studying risk at household level in Bangladesh, it is not possible to directly compare it with other studies of Bangladesh but analogies can be made with the complex-pattern of the risk components documented at regional scale by Quader, Khan et al. (Citation2017) and in other coastal regions (Tran et al. Citation2017).
5.2.1. Offshore vs mainland
Our results suggest that the households living on islands have, on average, a higher vulnerability than that those living in onshore unions. This contrast is less obvious for the household ‘equal hazard risk’, as some unions with highly vulnerable households have also developed more capacities to face hazards. Although the specific vulnerability of household living on islands had not been previously recognized, previous studies highlighted the lower income, higher gender disparity and the generally poor housing structure of insular population (Islam et al. Citation2014b; Hossain Citation2015; Mallick and Vogt Citation2015; Saha Citation2015; Islam and Hasan Citation2016; Mallick et al. Citation2017; Saha and James Citation2017; Rakib et al. Citation2019); poor housing structure, lower income and lower literacy rate in islands are also essential indicators in our study. In a regional scale analysis of vulnerability at union-level using census data, Quader, Khan et al. (Citation2017) also reported higher vulnerability and risk for the offshore unions than the mainland ones considered in this study (). Higher vulnerability of the islands might be attributed to the fact that islanders have larger family (Islam and Hasan Citation2016), are lacking proper sanitation (Saha Citation2015), live in house with weak structures (Hossain Citation2015), are repeatedly affected by impacts of disasters and have limited access to markets for exportation.
5.2.2. Three coastal zones
The regional risk assessment at union level by Quader, Khan et al. (Citation2017) reported that the islands of the central coast zone belong to the very high risk class, due to higher vulnerability, higher exposure and lower capacity of the population in these unions (). The same pattern is observed in our household-scale risk assessment (), although the variables used at regional and local scales are different. The central coastline is also found highly exposed to the impacts of sea level rise, tidal flooding and storm surge in literature (Sarwar Citation2013; Sarwar and Islam Citation2013). The lowest average household vulnerability and the highest exposure value observed for households of the eastern zone were also noticed at regional scale ().
The higher level of capacity to face hazards identified in this study for the households from the western coast zone can be corroborated by previous research that reported implementation of specific adaptation actions in some unions of the western coast. Techniques of food storage, increasing plinth height, digging safety holes to preserve seeds have been observed in the western coast (Paul and Routray Citation2011). Adaptation in the water sector through measures such as rainwater harvesting or pond water purification is the highest in the western zone (). This is motivated by the recent impact of two cyclones in 2007 and 2009. FGD participants of both Gabura and Southkhali unions of western coast confirmed that the salinity in drinking water and topsoil limited their access to pure drinking water and irrigation water. Several adaptation projects related to increase the drinking water availability has been implemented by NGOs in this area after 2007. Plinth height is also found highest in the western zone (). Several FGD participants of Southkhali union stated that they increase the plinth height of their houses after each cyclone based on the experience of the height of inundation due to associated storm surge. The highest plinth height might be linked with the highest number of historical cyclones that crossed this area (Quader, Khan et al. Citation2017).
5.3. Inter-dependencies of the components controlling household risk
It is interesting to note that vulnerability is not correlated with exposure at local scale when considering the entire coast. No causality relationship can be extracted from statistical link, but it has been argued in several studies around the world that less favoured households are more likely to settle in less attractive locations, including zones exposed to hazards, due to land prices, land tenure systems, easy access to livelihood, lower living cost etc. (Mutahara et al. Citation2016; Prashar and Rahman Citation2017). The significant positive relation between vulnerability and capacity observed in the Western and Central coastal zone is opposite to what was observed in previous studies that assessed risk and its component at regional scale (Esnard et al. Citation2011; Quader, Khan et al. Citation2017). This can be explained by the fact that capacity analysis at regional level generally rely on community-level indicators or proximity indicators (e.g. Proximity to road for evacuation, proximity to cyclone shelters), whereas at household level we focus on the actions taken by each family to secure its own lives, assets and livelihoods. This suggests that highly vulnerable households, although they are not provided by much capacities at community level (e.g. lower access or less capacity of cyclone shelters; Quader, Khan et al. Citation2017), are aware of their risk and do implement risk reduction measures. This also highlights the potential mismatch between risk assessment at regional and local levels, especially in terms of capacities as the measures of risk reduction are different at community and household level.
5.4. Comparison of historical cyclone death and risk
Validation of the vulnerability, exposure, capacity and risk indexes and maps are important for the end users to use them confidently in disaster risk reduction processes. There is no uniform validation method for risk assessment. The unavailability of detailed damage and long-term economic impact data from past disasters is probably the reason why such validation is lacking in most vulnerability and risk assessment studies (Esnard et al. Citation2011; Balica Citation2012). Correlation of the vulnerability and risk indices with independent past disaster data can indeed be used as a validation (Balica Citation2012; Martins et al. Citation2012). Number of fatalities recorded per village from cyclone Sidr is only available for the mainland union of Southkhali. Scatter plots of shows the poor link between cyclone death and risk index. The reasons for the mismatch between the estimated risk and the death pattern might be that the survey took place eight years after the cyclone hit the coast of Bangladesh, not properly representing the vulnerability and capacity profile of the households at the time of the disasters. Most probably, the death ratio is a poor proxy of overall damage: death is the only available damage statistics at village level, but this is one of the many impacts of cyclone i.e. loss of assets, crop damage, injuries, infrastructure damage, livestock loss etc. The most severe impacts, such as death, might be highly controlled by the intensity of the hazard and the local exposure, whereas more long-term impact on livelihood will more depend on the socio-economic vulnerability and capacity to cope of affected households (Mutahara et al. Citation2016). The strong positive association between the estimated exposure and the number of recorded fatalities confirm this interpretation. Indeed, the distance to cyclone shelters, the proximity to the sea and to the road are used as variables to assess exposure in this study. Distant cyclone shelters are reported as one of the main cause of casualties by cyclones in Bangladesh (Paul Citation2010, Citation2012; Mallick et al. Citation2017; Hossain and Kumar Citation2018). FGD participants of Southkhali union also mentioned that some of their neighbours did not evacuate to cyclone shelters due to large distance and muddy roads to reach shelters due to heavy rainfall before the cyclone. They died at their home or nearby places.
5.5. Limitations of the approaches
A robust validation of the estimated vulnerability, exposure and capacity components at household level is not possible except for the comparison with estimation of the same components derived at union-scale using a similar approach, but different indicators extracted from census data (Quader, Khan et al. Citation2017). We assumed an equal intensity of the hazards on the households across each union due to a lack of detailed data of the hazard characteristics and spatial variations (Quader, Khan et al. 2017). This approach is valid at local scale but requires caution when comparing risk values between different unions. As we did not have access to very high spatial resolution DEM (Digital Elevation Model), we could not consider elevation as an exposure indicator.
The validation of the risk map is done for one union based only on the spatial distribution of fatalities of one cyclone, as disaster impact data at village level are not available for other study unions or other cyclone events. The users of our risk map should keep in mind that we are limited to the minimum required number of samples to be statistically representative at union level. Therefore, village level risk maps might not be representative as we considered only the number of households of a union to calculate the sample size and distribute it to the villages equally.
6. Conclusion
The coast of Bangladesh is exposed to multiple natural hazards. Risk assessment is an important step of the Disaster Risk Reduction process. Bengali population’s vulnerability has been assessed at country, district and upazilla levels (Kumar and Kunte Citation2012; Zhou et al. Citation2014, Citation2015). Using administrative units as assessment unit to estimate vulnerability, however, generalize the characteristics leading to vulnerability. The same exposure and hazard intensity may result in contrasted level of risk for the different households of a union due to different degrees of capacities and vulnerability. It is, therefore, important to assess the vulnerability and the resulting risk at household level to adopt proper policies to effectively reduce the risk. This research proposes a set of variables for which data have been collected at individual and household levels, converted to a set of indicators, factors and dimensions that can be used to assess household level vulnerability. Although selection of variables and indicators could vary according to the local context, the factors and dimensions of vulnerability of this research can be used to assess the risk in other unions of the coastal Bangladesh. Variables to assess exposure as well as the capacity to mitigate and cope with the impact have also been identified. The proposed method allows a spatial assessment of the multi-component risk profile of households. Upscaling this time-consuming data-driven approach however represents a challenge in surveying representative samples of household at village level over a wide area.
Spatial contrasts in the risk components of the surveyed households were identified between offshore and onshore unions as well as between the three coastal zones of Bangladesh. Households of the central coast zone’s unions are found to be the most vulnerable and at the highest risk from climate-related hazards, consistently with regional scale assessments. The higher vulnerability of the islands indicates the necessity to consider the islanders in priority in the existing social safety net programmes and disaster risk reduction strategies at local and national level.
The proposed methods for assessing the risk components of individual households and the resultant maps are potentially relevant for policy makers working at local level to adopt and implement structural and non-structural risk reduction strategies. It can help targeting specific households, or locations, within their community based on their exposure, vulnerability or capacity profiles. The proposed method could be used for other unions of the coast of Bangladesh, maybe after adapting some variables in the vulnerability index to fit to local context, under the same dimensions and factors. The limitation of the statistical representation of the samples at village level can be overcome if the spatial data (i.e. village boundary) is available at village level and the boundary of the villages is mapped. The lack of detailed and spatially explicit data on the impacts of historical cyclones across the coastal region of Bangladesh greatly limited the validation of the proposed risk assessment approach. Further study should concentrate on the external validation of the risk maps through impact assessment or quantitative validation of the produced spatial patterns of risks with local inhabitants and stakeholders.
Supplemental Material
Download JPEG Image (538.8 KB)
Supplemental Material
Download JPEG Image (288.9 KB)
Supplemental Material
Download JPEG Image (667.6 KB)
Supplemental Material
Download MS Word (1.5 MB)Acknowledgements
The local people who participated in the questionnaire survey and focus group discussions are greatly acknowledged. We extend our gratitude to the institutions including Union Parishad Offices of the study area who provided logistical support and accommodation to host the FGDs. Mr. Abdul Malak, Assistant Professor, Department of Geography and Environment, Jagannath University, Dhaka, Bangladesh is acknowledged to support the field work in many ways. Three anonymous reviwers are acknowledged for their comments and suggestions thorugh two round of revisions to improve the manuscript greatly from its initial version. We finally give thanks to enumerators who did a tremendous job of data collecting even in a very rough weather.
Disclosure statement
The authors declare no conflict of interest.
Data availability statement
The authors confirm that the data supporting the findings of this study are available within the article and its supplementary materials.
Additional information
Funding
Related Research Data
References
- Ahammad R, Nandy P, Husnain P. 2013. Unlocking ecosystem based adaptation opportunities in coastal Bangladesh. J Coast Conserv. 17(4):833–840.
- Ahsan MN, Warner J. 2014. The socioeconomic vulnerability index: A pragmatic approach for assessing climate change led risks-A case study in the south-western coastal Bangladesh. Int. J. Disaster Risk Reduct. 8:32–49. https://doi.org/https://doi.org/10.1016/j.ijdrr.2013.12.009
- Akter S, Mallick B. 2013. The poverty-vulnerability-resilience nexus: evidence from Bangladesh. Ecol Econ. 96:114–124.
- Alam K, Rahman H. 2014. Women in natural disasters: a case study from southern coastal region of Bangladesh. Int J Disaster Risk Reduct. 8:68–82.
- Anderson CC, Hagenlocher M, Renaud FG, Sebesvari Z, Cutter SL, Emrich CT. 2019. Comparing index-based vulnerability assessments in the Mississippi Delta: implications of contrasting theories, indicators, and aggregation methodologies. Int J Disaster Risk Reduct. 39:101128.
- Auerbach LW, Goodbred SL Jr, Mondal DR, Wilson CA, Ahmed KR, Roy K, Steckler MS, Small C, Gilligan JM, Ackerly BA. 2015. Flood risk of natural and embanked landscapes on the Ganges–Brahmaputra tidal delta plain. Nat Clim Change. 5(2):153–157.
- Balica S. 2012. Approaches of understanding developments of vulnerability indices for natural disasters of vulnerability indices for natural disasters. Environ Eng Manag J. 11(5):4–12.
- BBS. 2011. Bangladesh Population and housing census 2011: socio-economic and demographic report. Dhaka: Bangladesh Bureau of Statistics (BBS), Government of Bangladesh.
- Bhuiyan MJAN, Dutta D. 2012. Analysis of flood vulnerability and assessment of the impacts in coastal zones of Bangladesh due to potential sea-level rise. Nat Hazards. 61(2):729–743.
- Chang SE, Yip JZK, Jong VZdSL, Chaster R, Lowcock A. 2015. Using vulnerability indicators to develop resilience networks: a similarity approach. Nat Hazards. 78(3):1827–1841.
- Chen W, Cutter SL, Emrich CT, Shi P. 2013. Measuring social vulnerability to natural hazards in the Yangtze River Delta region, China. Int J Disaster Risk Sci. 4(4):169–181.
- Cutter SL. 2017. The forgotten casualties redux: women, children, and disaster risk. Glob Environ Chang. 42:117–121.
- De Andrade MMN, Szlafsztein CF, Souza-Filho PWM, Araújo AdR, Gomes MKT. 2010. A socioeconomic and natural vulnerability index for oil spills in an Amazonian harbor: A case study using GIS and remote sensing. J. Environ. Manage. 91:1972–1980. https://doi.org/https://doi.org/10.1016/j.jenvman.2010.04.016
- Esnard AM, Sapat A, Mitsova D. 2011. An index of relative displacement risk to hurricanes. Nat Hazards. 59(2):833–859.
- Fakhruddin SHM, Rahman J. 2015. Coping with coastal risk and vulnerabilities in Bangladesh. Int J Disaster Risk Reduct. 12:112–118.
- Fekete A. 2010. Assessment of social vulnerability to river floods in Germany. Bonn, Germany: Institute for Environment and Human Security, United Nations University.
- Haq MZ, Robbani M, Ali M, Mainul Hasan M, Mahmudul Hasan M, Uddin MJ, Begum M, Teixeira da Silva JA, Pan X-Y, Karim MR. 2012. Damage and management of cyclone Sidr-affected homestead tree plantations: a case study from Patuakhali, Bangladesh. Nat Hazards. 64(2):1305–1322.
- Hinkel J. 2011. Indicators of vulnerability and adaptive capacity: towards a clarification of the science-policy interface. Glob Environ Chang. 21(1):198–208.
- Hossain MN. 2015. Analysis of human vulnerability to cyclones and storm surges based on influencing physical and socioeconomic factors: Evidences from coastal Bangladesh. Int J Disaster Risk Reduct. 13:66–75.
- Hossain N, Kumar S. 2018. Vulnerability factors and effectiveness of disaster mitigation measures in the Bangladesh Coast. Earth Syst Environ. 2(1):55–65.
- Huang J, Su F, Zhang P. 2015. Measuring social vulnerability to natural hazards in Beijing-Tianjin-Hebei Region. Chin Geogr Sci. 25(4):472–485.
- IPCC. 2014. Climate change, adaptation, and vulnerability. Contribution of Working Group II to the Fifth Assessment Report. UK: Cambridge University Press. http://ipcc-wg2.gov/AR5/images/uploads/IPCC_WG2AR5_SPM_Approved.pdf.
- Islam MA, Mitra D, Dewan A, Akhter SH. 2016. Coastal multi-hazard vulnerability assessment along the Ganges deltaic coast of Bangladesh – a geospatial approach. Ocean Coast Manag. 127:1–15.
- Islam MM, Sallu S, Hubacek K, Paavola J. 2014a. Migrating to tackle climate variability and change? Insights from coastal fishing communities in Bangladesh. Clim Change. 124(4):733–746.
- Islam MM, Sallu S, Hubacek K, Paavola J. 2014b. Vulnerability of fishery-based livelihoods to the impacts of climate variability and change: insights from coastal Bangladesh. Reg Environ Change. 14(1):281–294.
- Islam MR, Hasan M. 2016. Climate-induced human displacement: a case study of Cyclone Aila in the south-west coastal region of Bangladesh. Nat Hazards. 81(2):1051–1071.
- Islam MS, Swapan MSH, Haque SM. 2013. Disaster risk index: How far should it take account of local attributes? Int J. Disaster Risk Reduct. 3:76–87. https://doi.org/https://doi.org/10.1016/j.ijdrr.2012.10.001
- Koks EE, Jongman B, Husby TG, Botzen WJW. 2015. Combining hazard, exposure and social vulnerability to provide lessons for flood risk management. Environ Sci Policy. 47:42–52.
- Kumar AA, Kunte PD. 2012. Coastal vulnerability assessment for Chennai, east coast of India using geospatial techniques. Nat Hazards. 64(1):853–872.
- Kumar A, Done J, Dudhia J, Niyogi D. 2011. Simulations of Cyclone Sidr in the Bay of Bengal with a high-resolution model: Sensitivity to large-scale boundary forcing. Meteorol Atmos Phys. 114(3-4):123–137.
- Malak MA, Sajib AM, Quader MA, Anjum H. 2020. We are feeling older than our age”: vulnerability and adaptive strategies of aging people to cyclones in coastal Bangladesh. Int J Disaster Risk Reduct. 48:101595.
- Mallick B, Ahmed B, Vogt J. 2017. Living with the risks of cyclone disasters in the south-western coastal region of Bangladesh. Environments. 4(1):13.
- Mallick B, Rahaman KR, Vogt J. 2011. Coastal livelihood and physical infrastructure in Bangladesh after cyclone. Mitig Adapt Strateg Glob Change. 16(6):629–648.
- Mallick B, Vogt J. 2015. Societal dealings with cyclone in Bangladesh – a proposal of vulnerability atlas for sustainable disaster risk reduction. J Coast Zo Manag. 18(3):1–11.
- Martinich J, Neumann J, Ludwig L, Jantarasami L. 2013. Risks of sea level rise to disadvantaged communities in the United States. Mitig Adapt Strateg Glob Change. 18(2):169–185.
- Martins VN, e Silva DS, Cabral P. 2012. Social vulnerability assessment to seismic risk using multicriteria analysis: the case study of Vila Franca do Campo (Sao Miguel Island, Azores, Portugal.). Nat Hazards. 62(2):385–404.
- Michellier C, Kervyn M, Barette F, Muhindo Syavulisembo A, Kimanuka C, Kulimushi Mataboro S, Hage F, Wolff E, Kervyn F. 2020. Evaluating population vulnerability to volcanic risk in a data scarcity context: the case of Goma city, Virunga volcanic province (DRCongo). Int J Disaster Risk Reduct. 45:101460.
- Morrow BH. 1999. Identifying and mapping community vulnerability. Disasters. 23(1):1–18.
- Mullick MRA, Tanim AH, Islam SMS. 2019. Coastal vulnerability analysis of Bangladesh coast using fuzzy logic based geospatial techniques. Ocean Coast. Manag. 174:154–169.
- Mutahara M, Haque A, Khan MSA, Warner JF, Wester P. 2016. Development of a sustainable livelihood security model for storm-surge hazard in the coastal areas of Bangladesh. Stoch Environ Res Risk Assess. 30(5):1301–1315.
- Mwale FD, Adeloye AJ, Beevers L. 2015. Quantifying vulnerability of rural communities to flooding in SSA: A contemporary disaster management perspective applied to the Lower Shire Valley, Malawi. Int. J. Disaster Risk Reduct. 12:172–187.
- Nguyen TTX, Bonetti J, Rogers K, Woodroffe CD. 2016. Indicator-based assessment of climate-change impacts on coasts: A review of concepts, methodological approaches and vulnerability indices. Ocean Coast. Manag. 123:18–43.
- Orencio PM, Fujii M. 2013. A localized disaster-resilience index to assess coastal communities based on an analytic hierarchy process (AHP). Int J Disaster Risk Reduct. 3(1):62–75.
- Paul BK. 2009. Why relatively fewer people died? The case of Bangladesh’s cyclone Sidr. Nat Hazards. 50(2):289–304.
- Paul BK. 2010. Human injuries caused by Bangladesh’s cyclone Sidr: an empirical study. Nat Hazards. 54(2):483–495.
- Paul BK. 2012. Factors affecting evacuation behavior: the case of 2007 cyclone Sidr, Bangladesh. Prof Geogr. 64(3):401–414.
- Paul BK, Dutt S. 2010. Hazard warnings and responses to evacuation orders: the case of Bangladesh’s cyclone Sidr. Geogr Rev. 100(3):336–355.
- Paul SK, Routray JK. 2011. Household response to cyclone and induced surge in coastal Bangladesh: coping strategies and explanatory variables. Nat Hazards. 57(2):477–499.
- Poompavai V, Ramalingam M. 2013. Geospatial Analysis for Coastal Risk Assessment to Cyclones. J. Indian Soc. Remote Sens. 41:157–176. https://doi.org/https://doi.org/10.1007/s12524-011-0198-8
- Prashar S, Rahman MA. 2017. Integration of disaster risk reduction into land use planning: Experience of Bangladesh. In: Banba M, Shaw R, editors. Land use management in disaster risk reduction: practice and cases from a global perspective. Tokyo, Japan: Springer; p. 149–195.
- Quader MA, Agrawal S, Kervyn M. 2017. Multi-decadal land cover evolution in the Sundarban, the largest mangrove forest in the world. Ocean Coast Manag. 139:113–124.
- Quader MA, Khan AU, Kervyn M. 2017. Assessing risks from cyclones for human lives and livelihoods in the coastal region of Bangladesh. Int J Envoron Res Public Health. 14(8):831–826.
- Rahman MT, Rasheduzzaman M, Habib MA, Ahmed A, Tareq SM, Muniruzzaman SM. 2017. Assessment of fresh water security in coastal Bangladesh: an insight from salinity, community perception and adaptation. Ocean Coast. Manag. 137:68–81.
- Rakib MA, Sasaki J, Pal S, Newaz A, Bhuiyan MAH. 2019. An investigation of coastal vulnerability and internal consistency of local perceptions under climate change risk in the southwest part of Bangladesh. J Environ Manage. 231:419–428.
- Rawlani AK, Sovacool BK. 2011. Building responsiveness to climate change through community based adaptation in. Mitig Adapt Strateg Glob Change. 16(8):845–863.
- Rufat S, Tate E, Emrich CT, Antolini F. 2019. How valid are social vulnerability models? Ann Am Assoc Geogr. 109(4):1–23.
- Ruiter MC, De Ward PJ, Daniell JE, Aerts JCJH. 2017. Review article: a comparison of flood and earthquake vulnerability assessment indicators. Nat Hazards Earth Syst Sci. 17(7):1231–1251. https://doi.org/https://doi.org/10.5194/nhess-17-1231-2017.
- Saha CK. 2015. Dynamics of disaster-induced risk in southwestern coastal Bangladesh: an analysis on tropical Cyclone Aila 2009. Nat Hazards. 75(1):727–754.
- Saha SK, James H. 2017. Reasons for non-compliance with cyclone evacuation orders in Bangladesh. Int J Disaster Risk Reduct. 21:196–204.
- Sarwar MGM. 2013. Sea-level rise along the coast of Bangladesh. In: Shaw R, Mallick F, Islam A, editors. Disaster risk reduction approaches in Bangladesh. Tokyo: Springer Japan; p. 217–234.
- Sarwar MGM, Islam A. 2013. Multi hazard vulnerabilities of the coastal land of Bangladesh. In: Shaw R, Mallick F, Islam A, editors. Climate change adaptation actions in Bangladesh. Tokyo: Springer Japan; p. 121–142.
- Sattar MA, Cheung KKW. 2019. Tropical cyclone risk perception and risk reduction analysis for coastal Bangladesh: Household and expert perspectives. Int J Disaster Risk Reduct. 41:101283–101218.
- Schmidtlein MC, Deutsch RC, Piegorsch WW, Cutter SL. 2008. A sensitivity analysis of the social vulnerability index. Risk Anal. 28(4):1099–1114.
- Shameem MIM, Momtaz S, Rauscher R. 2014. Vulnerability of rural livelihoods to multiple stressors: A case study from the southwest coastal region of Bangladesh. Ocean Coast Manag. 102:79–87.
- Tate E. 2012. Social vulnerability indices: a comparative assessment using uncertainty and sensitivity analysis. Nat Hazards. 63(2):325–347.
- Toufique KA, Islam A. 2014. Assessing risks from climate variability and change for disaster-prone zones in bangladesh. Int J Disaster Risk Reduct. 10:236–249.
- Tran H, Nguyen Q, Kervyn M. 2017. Household social vulnerability to natural hazards in the coastal Tran Van Thoi District, Ca Mau Province, Mekong Delta, Vietnam. J Coast Conserv. 21(4):489–503.
- Uddin MN, Saiful Islam AKM, Bala SK, Islam GMT, Adhikary S, Saha D, Haque S, Fahad MGR, Akter R. 2019. Mapping of climate vulnerability of the coastal region of Bangladesh using principal component analysis. Appl Geogr. 102:47–57.
- UNISDR. 2004. Living with risk: a global review of disaster reduction initiatives. Vol. II. Geneva, Switzerland: The United Nations International Strategy for Disaster Reduction, United Nations.
- Wang C, Yarnal B. 2012. The vulnerability of the elderly to hurricane hazards in Sarasota. Nat Hazards. 63(2):349–373.
- Yadav DK, Barve A. 2017. Analysis of Socioeconomic Vulnerability for Cyclone-Affected Communities in Coastal Odisha, India. Int. J. Disaster Risk Reduct. 22:387–396. https://doi.org/https://doi.org/10.1016/j.ijdrr.2017.02.003
- Yoon DK. 2012. Assessment of social vulnerability to natural disasters: a comparative study. Nat Hazards. 63(2):823–843.
- Zanetti VB, Carbel W, de SJ, Freitas DMD. 2016. A climate change vulnerability index and case study in a Brazilian Coastal City. Sustainability. 8(8):811.
- Zhou Y, Li N, Wu W, Wu J. 2014. Assessment of provincial social vulnerability to natural disasters in China. Nat Hazards. 71(3):2165–2186.
- Zhou Y, Liu Y, Wu W, Li N. 2015. Integrated risk assessment of multi-hazards in China. Nat Hazards. 78(1):257–280.