
 ?Mathematical formulae have been encoded as MathML and are displayed in this HTML version using MathJax in order to improve their display. Uncheck the box to turn MathJax off. This feature requires Javascript. Click on a formula to zoom.
Abstract
In the recent few decades, climate variability had severely affected the socio-economic and environmental conditions worldwide. Frequent shifts in the atmospheric circulation patterns affect large parts of the globe, predominantly the arid and semi-arid regions facing severe to moderate droughts. Therefore, precursors of drought events and their associated mechanisms are important to understand. This study explores the possible cycles and precursor conditions that might be employed for predicting upcoming droughts in Pakistan. Standardize precipitation index and the single Z-index are used to detect and rank the drought years. Moreover, composite analysis is carried out to explore the large-scale circulation anomalies related to extreme drought events. Results demonstrate that extreme drought events are highly correlated with wind patterns and intrinsic weather system in the Pacific and Indian Oceans. This study analyzed air temperature, sea level pressure and geopotential height in the average time-period of January to March, sea surface temperature from October to December, and wind vectors in March to May as precursors that could be employed to predict the occurrence of droughts in Pakistan. This information is of significance for policymakers to plan climate change adaptive measures accordingly.
1. Introduction
Droughts are among the most intricate natural hazards (Portela et al. Citation2015) that generally initiate with a rainfall deficit and further result in enormous losses in water resources (Zhang et al. Citation2015), agricultural production (Al-Kaisi et al. Citation2013) and economy of the region (Khan et al. Citation2019; Xu et al. Citation2018). In the past few decades, many severe droughts have occurred all over the World. For instance, Texas drought in the USA (2012), drought in California (2012-2015), droughts in East Africa (2010-2011), drought in Balochistan Pakistan (1997–2003), droughts in China (1994, 1997, 2002), the Tibetan Plateau drought in (1997–2000), Indian subcontinent drought (2002), the worst drought in Papua (1997-1998) and the Australian Millennium drought (1997–2010) (McVicar and Bierwirth Citation2001; Prabhakar and Shaw Citation2008; Sheffield et al. Citation2009; van Dijk et al. Citation2013; Zhang et al. Citation2013; Ahmed et al. Citation2016; Hao et al. Citation2018). The regions most exposed to prolonged and severe droughts during 1951–1970 were the Central United States, the Argentinian Pampas, Russia, and Central Australia; during 1971–1990 they were Southern Chile, the Sahel, and Siberia; during 1991–2010 they were the Amazon Forest, the Congo River Basin, Mongolia, North Eastern China, and Borneo (Spinoni et al. Citation2014). These large-scale droughts have caused colossal damage to the agriculture sector, devastatingly declining water supply and crop production (Nielsen-Gammon Citation2011; Peterson et al. Citation2012; Dutra et al. Citation2013; Hoerling et al. Citation2014). These impacts are more intense in a country like Pakistan that is among the most susceptible countries to droughts and famines, considering its massive agricultural dependency.
Climatologically, most parts of Pakistan are arid to semi-arid, with significant spatial and temporal variability in climatic parameters. Monsoon rains are considered as a dominant hydro-meteorological resource for Pakistan as it contributes approximately 59% of annual rainfall. According to the climate risk index (CRI), Pakistan ranked in the 5th position among the 10 most-affected countries to climate change from 1999 to 2018 (Eckstein et al. Citation2020). Over the past decade, various studies reported variations in precipitation pattern (Syed et al. Citation2010; Latif and Syed Citation2016; Latif et al. Citation2017) and warming trend of 0.1 °C per decade from 1960 to 2010 in Pakistan has been documented (Farooqi et al., Citation2005; Afzaal et al. Citation2009; Wang et al. Citation2011; Salma et al. Citation2012; del Rio et al. Citation2013; Shakoor et al. Citation2015; Khan et al. Citation2019). The year 1997-98 was marked by strong El Niño Southern Oscillation (ENSO), and this strong ENSO induced a five-year drought from 1998-2002 in the southwest Asia, including Pakistan, which experienced the most severe drought conditions in the last 50 years (Barlow et al. Citation2002; Rasul et al. Citation2008; Ahmad et al. Citation2010; Ahmad et al. Citation2014). Given the close relationship between atmospheric circulation patterns and climatic variables, extreme weather phenomena like drought and flood can be attributed to variations of atmospheric circulation patterns (Omidvar et al. Citation2016).
Future changes in the climate of Pakistan projected by most global climate models would cause a major impact on water resources, and subsequently affect food supply, health and ecosystem sustainability. Problems will most likely arise in southern parts of the country where the water resources are already under stress because that stress would be exacerbated by changes in supply or demand associated with climate change (Shakoor et al. Citation2015; Eckstein et al. Citation2020). The extremes in the long-term precipitation variations manifest themselves in the form of large-scale floods and droughts and cause devastating human and economic losses in conjunction with other physical, social, political and economic effects (Solomon et al. Citation2008).
Recently, many scientists investigated climate change-induced extreme events like droughts in Pakistan. For instance, Khan et al. (Citation2020) provided an understanding and potential of drought prediction models in Pakistan by machine learning techniques (Khan et al. Citation2020). Jamro et al. (Citation2020) explored the Standardized Precipitation Evapotranspiration Index (SPEI) based Spatio-temporal variability of drought characteristics in Balochistan province as well as in the entire region of Pakistan (Jamro et al. Citation2019; Jamro et al. Citation2020). Qaiser et al., (Citation2021) presented a study about the evaluation of seasonal droughts using a composite drought index in Northern Punjab. Also, they described the related atmospheric dynamics (Qaiser et al. Citation2021). Hina and Saleem (Citation2019) calculated the severity and magnitude of droughts in different provinces of Pakistan and highlighted the drought-prone areas as well (Hina and Saleem Citation2019). Ahmed et al. (Citation2018) reported the impacts of climate variability on characteristics of seasonal drought in Pakistan and also studied the characterization of droughts in Kharif season (the first sowing season; starts from April to June and harvested from October to December) and Rabi seasons (the second sowing season; began in October to December and harvested from March to May) in the province of Balochistan (Ahmed et al. Citation2016; Ahmed et al. Citation2018). Another study conducted by Adnan et al., Citation2016, highlighted the shifting of precipitation and temperature trends along with drought vulnerability in agro-climatic zones in Pakistan (Adnan et al. Citation2016).
Although literature reports many studies in the region of Pakistan for drought characterization at national and regional scales (Xie et al. Citation2013; Ahmed et al. Citation2016; Haroon et al. Citation2016; Adnan et al., Citation2018; Ullah et al. Citation2021), but none of the studies mentioned above investigated the precursor conditions associated with the occurrence of droughts in the region. Therefore, it is essential to conduct new research analyzing the climatic parameters, some months prior to the summer season with the aim of using their status as a prediction tool for droughts. This study is designed to (Portela et al. Citation2015) detect the severity and recurrence of drought events in Pakistan (Zhang et al. Citation2015) identify and ascertain the statistical relationship among summer rainfall of extreme drought years and meteorological parameters like circulation patterns, geopotential height, air temperature, sea surface temperature (SST), and sea level pressure (SLP) prior to rainfall season and (Al-Kaisi et al. Citation2013) to figure out the drought precursors in Pakistan to anticipate the occurrence of droughts ahead of time.
2. Data and methods
This study is planned to infer Pakistan's rainfall behaviour using ground station precipitation data and deduce the relationship between local precipitation and regional climatic parameters to determine the drought precursors.
The monthly rainfall (mm) data covering the period of 37 years (1981-2017) was obtained from the Pakistan Meteorological Department (PMD). The names of weather stations together with their latitude, longitude and elevation are presented in . The rain gauge data was used for time series and return level analysis to figure out the general rainfall and drought patterns.
Table 1. List of weather stations in Pakistan.
Moreover, to isolate and categorize the drought years based on severity, SPI and single Z-Index were used as themost appropriate method for subsequent analysis.
After the isolation and classification of drought years, the rainfall received during drought years was correlated with regional meteorological parameters to anticipate Pakistan's droughts a few months earlier.
Regional meteorological parameters including air temperature, SST, SLP, wind variables and geopotential height were sourced from the National Center for Environmental Prediction and National Center for Atmospheric Research NCEP-NCAR reanalysis data (with a horizontal resolution of 2.5° × 2.5°), during 1981-2017. A domain covering the region between latitudes 20-140° E and longitude 0-80° N was selected, considering that it is sufficient to cover the influence of circulation patterns responsible for occurrence of droughts in Pakistan (Khan et al. Citation2019). The detailed methods are presented in the following sections ().
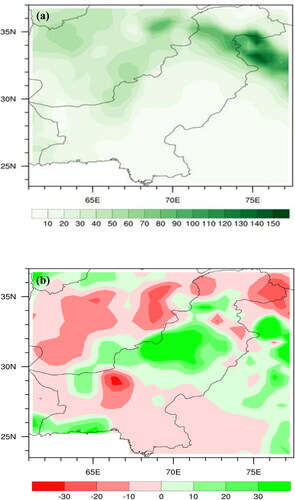
Figure 1. (a) Spatial rainfall distribution map of Pakistan (1981-2017), (b) Anomalous precipitation patterns in Pakistan (1981–2017).
2.1. General rainfall behaviour
Pakistan receives less rainfall in comparison with other regions of South Asia and hence predominantly sensitive to rainfall variability (Lu et al. Citation2020). The average precipitation of Pakistan ranges between 30 and 400 mm/year from south to north with a maximum gradient of 900-1800 mm in the sub-mountainous area (Adnan et al. Citation2016). The months from June to September are considered as monsoon season in Pakistan which contributes nearly 57% of the total annual rainfall (Hussain and Lee Citation2016). During summer monsoon season, rainfall is much greater in the northern parts of Pakistan than the southern parts (Hanif et al. Citation2013). For the purpose of showing the rainfall behavior and to deduce the dry and wet years, the time series of summer rainfall from 1981 to 2017 was plotted ().
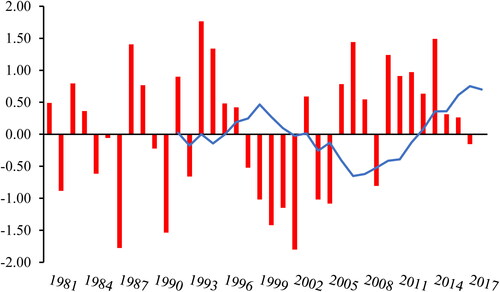
Figure 2. Pakistan's standardized total rainfall for June-August from 1981 to 2017. The solid blue line represents 11-year running mean.
2.2. Drought indices
In order to isolate and categorize the drought years in the region, two drought indices have been calculated in this study. A brief description of the indices is presented as follows.
2.2.1. Standardized precipitation index (SPI)
SPI index has been widely used to calculate the rainfall deficit and subsequent droughts during a certain time-period in the area of interest (McKee et al. Citation1993). It can be estimated for different timescales, including monthly, quarterly, biannually and annually (McKee Citation1995). The SPI well separates the wet and dry years (Soro et al. Citation2014). According to Mishra & Singh, SPI can be employed for short-term (soil moisture) as well as long-term (streamflow) water resources management (Mishra and Singh Citation2010).
For the SPI calculation, the long-term precipitation record for a desired period is fitted to a probability distribution, which is then transformed into a normal distribution so that the mean SPI for the location and desired period is zero (McKee et al. Citation1993; Edwards Citation1997). Positive SPI values indicate greater than median precipitation, and negative values indicate less than median precipitation. Since SPI is normalized, wetter and drier climates can be represented in the same way.
Thom (Citation1958) found the gamma distribution to fit well to the climatological precipitation time series. The gamma distribution is defined by its frequency or probability density function:
(1)
(1)
in which α and β are the shape and scale parameters respectively, x is the precipitation amount and Γ(α) is the gamma function. Parameters α and β of the gamma pdf are estimated for each station and for each time scale of interest (1,3, 6, 9, 12 months, etc.). Maximum likelihood estimations of α and β are:
(2)
(2)
and n is the number of observations.
The resulting parameters are then used to find the cumulative probability of an observed precipitation event for the given month and time scale for the location in question. Since the gamma function is undefined for x = 0 and a precipitation distribution may contain zeros, the cumulative probability becomes:
(3)
(3)
in which q is the probability of zero precipitation and G(x) is the cumulative probability of the incomplete gamma function. If m is the number of zeros in a precipitation time series, then q can be estimated by m/n. The cumulative probability H(x), is then transformed to the standard normal random variable z with mean zero and variance of one (Abramowitz Citation1964), which is the value of the SPI.
(4)
(4)
In the above-mentioned equation, X is seasonal precipitation at the ith rain gauge and jth observation, is long-term seasonal mean and
is the standard deviation.
Generally, monthly precipitation is not normally distributed so a transformation is performed such that the derived SPI values follow a normal distribution. The SPI is the number of standard deviations that the observed value would deviate from the long-term mean, for a normally distributed random variable (Tigkas et al. Citation2015). One interpretation of the resultant values is presented in .
Table 2. Standard Single Z-Index criteria for categorizing years based on the severity of floods or droughts.
2.2.2. Single Z-Index
China Z-index or single Z-index is a drought index introduced by China Meteorological Administration (CMA) in early 1990s to monitor drought and flood. Z-index was adopted by its used for grading dry/wet (flood) spells as well as their intensity. The single Z-index had been used for drought and flood monitoring in different areas of China (Sun and Gao Citation2000; Wu et al. Citation2001). The single Z-index is a statistical measure to identify the frequency of droughts and floods of certain severity that will likely to occur. The seasonal mean rainfall data June to August (JJA) has been used to compute the single Z-index.
The formula for grading dry/wet years is as follows:
(5)
(5)
where Zij is Single Z-Index, i is the timescale, that could be 1, 2, 3,…, 72 months; and j is the current month. The parameter i has not been used in this study because only the Z values for average seasonal rainfall are needed.
Csi denotes the coefficient of skewness and ϕij represents normalized variables and are defined as:
(6)
(6)
(7)
(7)
where xi represents seasonal rainfall (mm) for j month for i period, stands for mean rainfall (mm), σ is the standard deviation, and n represents the number of years under study.
The severity grades and the corresponding probability of occurrence are presented in .
2.3. Isolating drought years
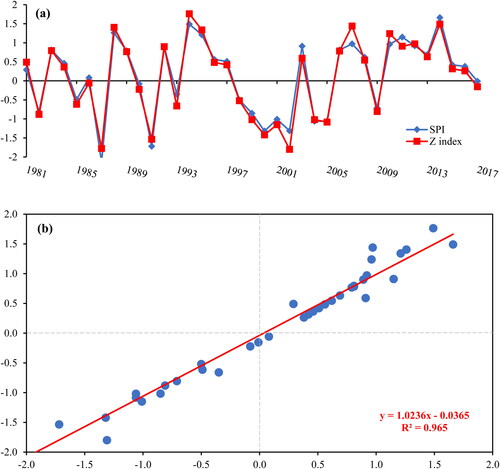
For the purpose of isolating the drought years, the Single Z-Index and SPI grading analysis were used. Both the indices were computed to determine drought years and their severity. Afterward, these indices were correlated, and one index had been selected for subsequent analysis. Positive values of indices referred to wet years, whereas negative values stated dry years. Linear regression among the SPI and single Z-index was also carried out. Moreover, Pearson correlation coefficients for Single Z-Index versus SPI were calculated and an excellent relationship (r = 0.96) has been obtained (). Moreover, the Single Z-Index has been selected for further analysis as it has picked larger values in both wet and dry conditions compared to SPI. In addition to this, the SPI index couldn't pick the severity of the year 2002 (a drought year) as considerably captured by the Single Z-Index (). The year 2002 was among the most severe drought years in the region (Hina and Saleem Citation2019).
Figure 3. (a) Time series of the SPI and Single Z-Index on Pakistan's rainfall. (b) Scatter diagram of the SPI and Z score for Pakistan's rainfall (1981-2017). Positive values indicate wetter than normal, negative values drier than normal.
2.4. Composite analysis
The composite analysis method has been used to discover the spatial patterns of Pakistan's summer rainfall (JJA) throughout the composite drought summers. The single Z-index-derived drought years (severe and extreme) used in this study are 1987, 1991, 2000, 2001, 2002, and 2005. These drought years grouped together and further investigated as a single variable. This technique has been widely used by many scientists all over the World (Adler et al. Citation2003; Bauer and Del Genio Citation2006; Thomas and Martin Citation2007; Nangombe et al. Citation2018). The composite method has been opted to demonstrate the more pronounced patterns of variables and minimize the number of plots associated with the study (Nangombe et al. Citation2018). Drought anomalies were calculated and further processed to create composite drought spatial distribution maps.
2.5. Correlation analyses
The statistical relationship among summer rainfall of extreme drought years and meteorological parameters prior to composite drought rainfall season was determined through correlation analysis. The correlation region between 0°S, 80°N and 20°E, 140°W was selected to correlate against Pakistan's JJA rainfall of composite drought years.
Regional meteorological parameters including 2 meter air temperature, SST, SLP, wind variables and geopotential height were sourced from monthly NCEP-NCAR reanalysis data at various levels for the period of 37 years from 1981 to 2017. These meteorological parameters were further subjected to correlation analysis against average JJA rainfall of composite drought years and used to investigate the most correlated parameter and months that could be used as a potential parameter for drought prediction. The geopotential height and wind parameters were investigated at low to middle levels (850,500 and 300 hPa) to assess the depth and strength of convection clouds and circulation systems (Nangombe et al. Citation2018). The main supposition for this study was to identify the prevailing conditions prior to the rainy season to be used as a drought alert to inform all related stakeholders before heading.
3. Results
3.1. Pakistan rainfall variability
3.1.1. Inter-annual rainfall structure
Pakistan receives less precipitation compared to the other South Asian countries; hence it is predominantly sensitive to rainfall variability. For that reason, several studies have been conducted to understand the variability and spatiotemporal features of Pakistan's rainfall (Adnan et al. Citation2016; Hussain and Lee Citation2016; Latif et al. Citation2017).
The seasonal climate of Pakistan is based on four symmetric divisions of a year: winter (December–February or DJF), spring (March–May or MAM), summer (June–August or JJA), and fall (September–November or SON). The annual average precipitation ranges between 30 and 400 mm from south to north with a maximum gradient of 900-1800 mm in sub-mountainous area (Adnan et al. Citation2016; Arshad et al. Citation2021). Almost 57% of the annual rainfall is due to summer monsoon rains; a dominant hydro-meteorological resource for Pakistan. Summer monsoon rain fall contributes 57%, winter precipitation contributes 30%, and remaining 13% is received by tropical cyclones (Hussain and Lee Citation2009; Saeed et al. Citation2011). The Southern Himalayan Mountains receive 200 mm/month precipitation during the summer monsoon and winter precipitation in the form of snow. Melting of this accumulated snow and ice during summer keeps the rivers perennial throughout the year. Precipitation caused by western disturbances in winter provides critical mass to glaciers and snowpacks (Moors and Stoffel Citation2013). The country's remaining extents receive very little precipitation (20–30 mm/month) during the year (Farooqi et al., Citation2005).
To give insight into Pakistan's summer precipitation patterns, rainfall analysis was carried outfrom the monthly rainfall data of 30 weather observatories (1981 to 2017) and rainfall spatial distribution map was produced. displays the spatial rainfall distribution map of Pakistan and from this map, it is witnessed that northern highlands of Pakistan receive more rainfall than southern areas. Moreover, the precipitation anomalies were also calculated for the same time-period and presented in . The positive anomalies can be observed in core monsoon regions of Pakistan (central and some northern areas), whereas in the southern areas, the strong negative anomaly has been witnessed. Most of the southern and some of the country's extreme northern parts were most hit by droughts with precipitation anomaly of −30 mm.
On interannual timescale, the upper tropospheric cyclonic or anticyclonic anomalies over West Asian region are closely associated to less or more rainfall over Pakistan and India (Saeed et al. Citation2011; Hong and Lu Citation2016; Latif et al. Citation2017; Yadav Citation2017). These tropospheric cyclonic or anticyclonic anomalies are closely linked with the two teleconnection patterns over the Eurasian continent (Zhou et al. Citation2019) including circumglobal teleconnection (CGT) or Silk Road Pattern (SRP) (Lu et al. Citation2002; Ding and Wang Citation2005). The CGT and summer North Atlantic Oscillation (SNAO) affect the summer rainfall in North of Pakistan and the Northwest of India (Ding and Wang Citation2005; Syed et al. Citation2012). The positive phases of CGT and SNAO are related to excessive rainfall during the summer season over Pakistan. The water vapour transportation (Arabian Sea to South Asia) associated with the monsoon trough, is critical for dry and wet conditions over Pakistan during summer season (Bollasina and Nigam Citation2011).
Some studies have revealed that these tropical and extratropical interactions have a key role in causing extreme rainfall events in Pakistan and South Asia (Hong et al. Citation2011; Vellore et al. Citation2016).
3.1.2. Summer rainfall variability
Pakistan, situated at the northernmost edge of the Asian monsoonal region, experiences intricate climate variability in summer rainfall (Lu et al. Citation2020). The time-period from June to September is categorized as the summer monsoon season and yields about 60% of total rainfall in Pakistan (Hussain and Lee Citation2016). Summer precipitation in Pakistan demonstrates strong interannual variability, mostly related to the seasonal rainfall. According to Hussain and Lee (Citation2016), the coefficient of variance for summer rainfall is 26% for Pakistan.
Lu et al. (Citation2020), investigated the interannual variation of monthly summer precipitation (June to September) in Pakistan and concluded that July and August are the months of pronounced rainfall compared to June and September. Moreover, the monthly rainfall patterns (JJA) are similar in the upper and lower troposphere (Lu et al. Citation2020).
The time series of standardized total summer rainfall over Pakistan for JJA is presented in for the study period of 37 years (1981- 2017). The standardized rainfall value of 1.5 is considered as the threshold value for extreme above-normal and extreme below-normal rainfall.
According to this threshold value, the years 1994 and 2014 are categorized as the extreme above-normal rainfall years, whereas 1987, 1991, and 2002 fall into the extreme below-normal rainfall rank.
The periodic variability of Pakistan's summer rainfall can be better characterized as quasi-periodic oscillation with non-random rainfall characteristics on decadal basis, as shown in . This compares well with the past regional study of dry and wet years in Pakistan (1981-2017), which had also shown that dry years were dominated in the first two decades, whereas the last two decades displayed the dominance of wet years (Hina and Saleem Citation2019). This oscillation could be understood by closely inspecting , which presented the time series of Pakistan's standardized rainfall for JJA from 1981-2017. On this time series, 11 years running mean has also been calculated. According to this running mean, positive peak nodes have been observed in 1999, 2014 and 2017, whereas negative peak nodes can be seen in 2002 and 2007.
In the first decade of the study period (1981-1990), Pakistan receives below and much below rainfall (1982, 1985, and 1987) whereas the succeeding decade had 5 years of above-normal rainfall among which only the year (1994) has much above-normal rainfall. The third decade has the dominance of below and much below-rainfall, especially in the first three consecutive years (2001, 2002, 2003), which were ENSO years in the region. Many studies had also confirmed this time-period as severe drought (Barlow et al. Citation2002; Barlow et al. Citation2016). Finally, in the last decade, the above-normal rainfall dominance (2011, 2012, 2013) can be observed, whereas 2014 had much above-normal rainfall. However, this analysis revealed that how Pakistan's rainfall pattern evolved over nearly 40 years, it is essential to opt for more robust and verified indices that will provide better understanding of moisture deficit. Henceforth, in this study, the Single Z-Index has been used to isolate dry and wet years along with their severity.
3.2. Drought indices for isolating drought years
To isolate the wet and dry years, the Single Z-Index and SPI were statistically computed and compared to select which one is more appropriate for the subsequent analysis. presenting a time series of both indices capturing the same drought years (1987, 1991, 2000, 2001, 2005) with almost the same severity. But Single Z-Index well-captured the whole drought cycle in contrast to SPI with more robust results (1987, 1991, 2000, 2001, 2002 and 2005). presents a scatter plot analysis between the Single Z-Index and SPI. From this plot, an excellent relationship (r = 0.96) can be investigated. Moreover, it is also observed that the Single Z-Index has picked larger values in both wet and dry conditions. In previous studies, many authors have also compared the robustness of SPI and Single Z-Index and chosen the Single Z-Index (Naresh Kumar et al. Citation2009; Nangombe et al. Citation2018). The main reason is, although the SPI picked out the same drought and wet years but it couldn't pick the severity of wet and dry years as robustly as Single Z-Index. SPI's failure to investigate the considerable severity was consistent with the study conducted by Naresh Kumar et al. (2009), who stipulated that SPI underestimated the intensity of wetness and dryness when the rainfall is too high or too low, respectively. In addition to this, the SPI index couldn't pick the severity of the year 2002 (a drought year) as considerably captured by the Single Z-Index (Naresh Kumar et al. Citation2009). The year 2002 was among the most severe drought years in the region (Hina and Saleem Citation2019). According to another study conducted by Jain et al. (Citation2015), Single Z-Index can capture the dry conditions that SPI cannot spot (Jain et al. Citation2015).
3.3. Pakistan's drought years
In this section, the entire study period (1981-2017) has been graded into normal, flood and drought years, using the Single Z-index. The results presented in have revealed that 2.7% and 5.4% fall into an extreme flood and extreme drought categories, respectively. Overall, 27.1% of the years are categorized as normal years, 40.5% years as flood years and 32.4% as drought years out of 37 years of the study period. Furthermore, the severe and extreme drought and flood years have equal probability, i.e., 16.2%.
Table 3. Grading of 1981 – 2017 period into flood, normal and drought years based on Pakistan's average summer rainfall and their probabilities.
From the , the drought years (years in the severe and extreme drought categories) identified are 1987, 1991, 2000, 2001, 2002, and 2005.
3.4. Precursor conditions to drought years
Investigation of drought precursor conditions is imperative for the prediction of drought events prior to their inception and hence can be used for the early warning system. The changes in climatic parameters occurring few months before the summer drought seasons behave differently and can be used as forecast. Henceforth, it can subsequently be used to prepare against droughts. The precursor period includes the winter months preceding the summer season. For this study, JJA has been chosen as summer season as these are the months receiving maximum rainfall throughout the year. Any fluctuation in rainfall received within these 3 months can subsequently affect the amount of summer season rainfall. The deficit in the summer monsoon rainfall caused moisture stress and impacted the crop yield in the region (Qaiser et al. Citation2021).
In Pakistan, major crops are grown in two cropping seasons, namely "Kharif" and "Rabi". Kharif, the first sowing season, starts from April to June and is harvested during the months from October to December. The major Kharif crops include rice, maize, soybean, cotton, sugarcane, jowar and bajra. The second sowing season Rabi, began in October to December and is harvested from March to May. Wheat, oat, barley, potato, tomato and onion are major Rabi crops (Ain et al. Citation2020). The summer monsoon improves the moisture stress during the Kharif season and meets the water demand for Rabi crops (Adnan et al., Citation2018). Hence any variability in the rainfall received during summer can negatively impact the GDP of an agriculture-based economy like Pakistan (Latif and Syed Citation2016).
The correlation coefficients derived from correlation analyses between Pakistan composite drought JJA rainfall and meteorological parameters precursor period are presented in .
Table 4. Correlation coefficients of Pakistan JJA composite droughts and selected meteorological parameters. The correlations are significant at 95%confidence level. All the values with asterisks are considered to be significant at 95% confidence interval. Shaded cells are chosen for further analysis.
The precursor period is defined as 3-month averages of OND, NDJ, DJF, JFM, FMA, MAM representing Oct to November, November to January, December to February, January to March, February to April and March to May, respectively. Based on extreme and severe drought grading, the years 1987, 1991, 2000, 2001, 2002, and 2005 were identified as the composite drought years.
The regional meteorological parameters, including air temperature, SST, SLP, wind variables and geopotential height, were averaged over the domain 0°S, 80°N and 20°E, 140°W to correlate against Pakistan's JJA rainfall of composite drought years. The specified domain (0°S, 80°N; 20°E, 140°W) for this study covers both land oceans that have a direct influence on Pakistan's rainfall.
From , it is depicted that air temperature (2 m), SLP, and geopotential height (500 hPa) have the highest correlations (-0.32, −0.71, and −0.49, respectively) in the JFM period. However, the SLP also had a good correlation (>0.5) during FMA and MAM. SST also revealed a good correlation in all of the periods under study and showed a significant value (0.83) in OND. The correlation coefficients for zonal wind are good in the periods of NDJ, DJF, JFM, FMA, but the highest correlation was found in MAM. Whereas for meridional wind, the period of OND and MAM has shown a significant correlation.
3.4.1. Air temperature
Air temperature is among the various significant physical drivers used to deduce the extreme climatic conditions and is generally negatively related to the rainfall in the South Asian region. Hence, air temperature can be used as a proxy indicator for below-normal rainfall events. Trenberth and Shea (Citation2005) suggested that both the temperature and rainfall records must be interpreted by considering the robust co-variability among them (Trenberth and Shea Citation2005). Chang (Citation1997) has used temperature to investigate the teleconnections among droughts and spatial patterns that might be responsible for drought event mechanism during summer (Chang Citation1997).
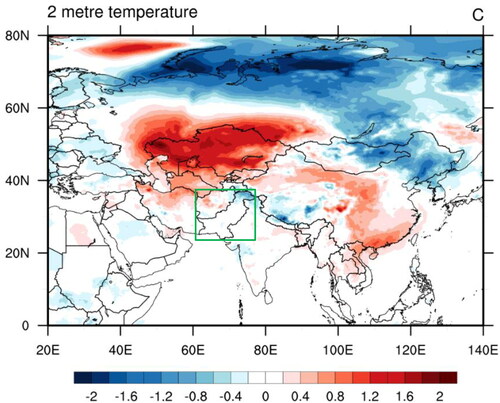
The anomalous patterns of 2-meter air temperature during JFM indicate the lowest negative anomalies over most regions over Pakistan and India, as depicted in . The JFM period has been chosen for composite analysis as it has a significant correlation as compared to other periods. However, the OND and MAM periods also have a good correlation. The results also have shown that during the JFM period, there is remarkably cooler than normal weather in the south Asian regions, including Pakistan. These low temperatures can inhibit the convection activity and henceforth disturb normal rainfall in the region. In addition to this, another major driver (ENSO) is responsible for affecting the summer monsoon rainfall (Azad and Rajeevan Citation2016; Gadgil et al. Citation2004; Saleem et al. Citation2021; Sein et al. Citation2021). Still, local temperature variations have more significant effect on frequency and intensity of extreme rainfall spells over Indian region. Therefore, the local atmospheric warming can be considered another vital process that influences extremes' characteristics (Sharma and Mujumdar Citation2019).
Figure 4. January to March (JFM) 2 m air temperature anomaly for composite drought years (units: °C).
3.4.2. Sea level pressure
The interannual variability of summer monsoon in south Asia is associated with large-scale atmospheric and oceanic variability, particularly ENSO and Indian Ocean Dipole (IOD) (Mishra, Citation2020a; Fan et al. Citation2017; Mishra, Citation2020a). ENSO influences rainfall deficits over South Asia; an earlier signal of highly positive SLP anomalies has shown a connection to droughts in the sub-region.
The spatial patterns of JFM composite mean sea level pressure anomalies for drought years are presented in . The spatial pattern portrays a substantial high-pressure system (positive anomalies) over the Himalayan region in the north of Pakistan. In contrast to northern region, there is a negative anomaly trend over some parts of Pakistan's southern region.
Figure 5. January to March (JFM) mean sea level pressure anomaly for composite drought years (units: Pa).
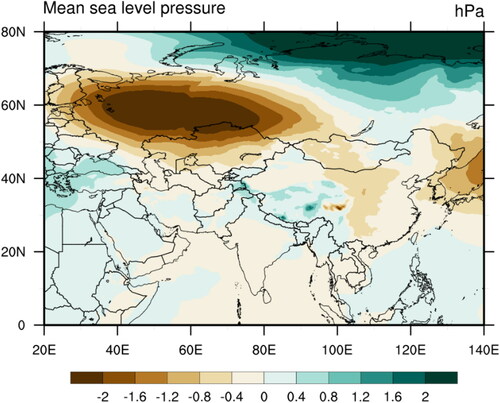
The monsoon trough (extended low-pressure zone over the Indo-Gangetic Plains from the northwest Indian region up to the Bay of Bengal) controls the region's precipitation distribution. The substantial increasing trend in SLP from northwest India up to the Bay of Bengal suggests a weakening of monsoon trough resulting in subdued precipitation activity over northern parts of the India region (Preethi et al. Citation2017).
Moreover, a very high negative SLP anomaly can be seen over the East Asian region (55-65 N, 40-70 E). North Pacific Subtropical High (NPSH) also plays a significant role in the year-to-year variation of the interface between East and South Asian monsoons (SASM) (Cao et al. Citation2012). The anomalous eastward (westward) location of this interface is associated with a strong East Asian monsoon and a weak South Asian Monsoon (vice -versa).
3.4.3. Sea surface temperature (SST)
SST is one of the most important oceanic climate variables that can be employed to interpret the interaction among various oceanic and atmospheric phenomena (Wmo, n.d; Bojinski et al. Citation2014; Reynolds et al. Citation2007). Various studies have reported that variations in SST have triggered drought events in different parts of the World (Fan et al. Citation2017; Rajagopalan et al. Citation2000; Lu and Delworth Citation2005; Feng et al. Citation2008; Annamalai et al. Citation2013; Tefera et al. Citation2020).
ENSO is the predominant phenomenon that can influence the global climate, especially South Asian summer monsoon. Several previous studies have addressed the relationship among ENSO and SASM (Grove Citation1998; Krishnamurthy and Goswami Citation2000; Fan et al. Citation2010). Given the fact that ENSO influences SASM through the Walker circulation (east–west displacement), the variation in spatial distribution of SST anomalies results in the transformation of the position and strength of Walker circulation anomalies, that subsequently alters the spatial configurations of precipitation anomalies over the South and Southeast Asia (Roxy, Ritika, Terray, Masson Citation2015; Roxy, Ritika, Terray, Murtugudde, et al. Citation2015). This might also elucidate why climate scientists nowadays rely on the status of ENSO for seasonal rainfall prediction (Nangombe et al. Citation2018).
In this section, the SST anomalies have been presented for the period of OND, derived from the . The trends in SST anomalies during composite dry years over the Indo-Pacific region have been displayed in . The red contours display positive SST anomalies designating warm pools whereas blue contours show negative anomalies (cool pools). The OND SST anomaly shows an increasing trend and a warm pool in the Arabian Sea and Bay of Bengal. The warming trend over Arabian Sea has a high magnitude (exceeding 0.3 °C) compared to the Bay of Bengal. This suggests the development of convection in the Arabian Sea, contrary to the Bay of Bengal that might be a reason for the precipitation deficit and consequently cause severe droughts in the Indian subcontinent (Preethi et al. Citation2017). The trends of SST anomalies reported here agree with the findings of Barlow et al. (Citation2016). According to Barlow, SST anomalies (cold) in the central and eastern Pacific and pattern of SST anomalies (warm) in the western Pacific and eastern Indian Ocean are relative to severe droughts. Moreover, the large-scale climate variability, predominantly La Niña, seems to play a vital role in regional droughts, including the most severe drought episode of the last 50 years (1999–2001) (Barlow et al. Citation2016).
Figure 6. October to December (OND) mean sea level pressure anomaly for composite drought years (units: °C).
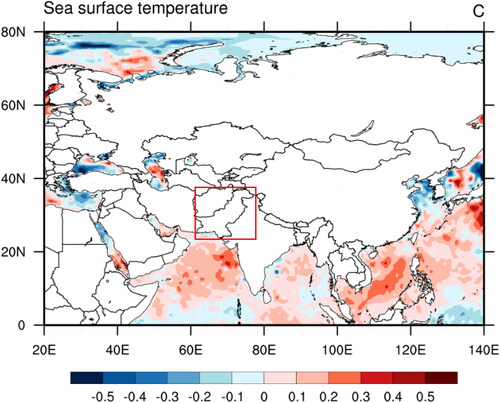
Annamalai et al. (Citation2013) also suggested that the increasing SST trend over the West Pacific has altered atmospheric circulation over the Bay of Bengal that led to additional cool and dry air from the northeast region, resulted in higher rainfall over the west Pacific and reduced over South Asia (Annamalai et al. Citation2013).
3.4.4. Geopotential height
To investigate the role of geopotential height for droughts' prediction, the geopotential height anomalies of the extreme and severe dry years (1987, 1991, 2000, 2001, 2002, and 2005) have been calculated from Jan to Mar (JFM). The spatial trends of geopotential height anomalies at the middle and low levels (850, 500 & 300 hPa) are investigated, but the geopotential height anomaly trend at 850 hPa tends to be weak and hence not presented in the paper.
Geopotential height anomalies for composite dry years at 500 hPa and 300 hPa are presented in and b. A strong positive anomaly with a magnitude of 5 gpm, has been seen over the north of Pakistan with an eastward extension at both 500 and 300 hPa levels (). Anticyclones or positive height anomalies are associated with fine, dry, and settled weather, consequently producing a descending air motion (Vellore et al. Citation2016). This anticyclone over northern Pakistan fetched cold, dry air from the northeast that resulted in dry conditions. Moreover, there is a strong negative high anomaly (< −5 gpm) with the cyclonic flow that can be observed over most parts of Pakistan, which in turn transport moisture out of the region and cause dry weather. Henceforth, the presence of dipole-like structure having positive/negative anomalies over the north/east of Pakistan might be associated with drought events.
Figure 7. January to March (JFM) geopotential height anomalies at 500 hPa (a) and 300 hPa (b) for composite drought years (units: gpm).
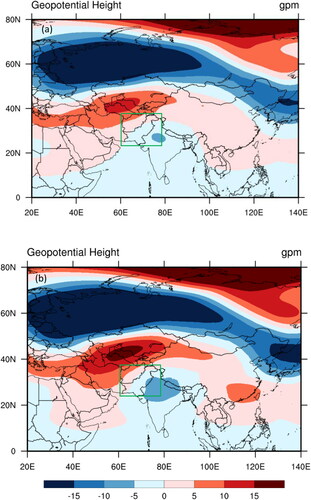
The results of this section are well consistent with the studies conducted by Qaiser et al. (Citation2021), Ahmed et al. (Citation2020) and Ain et al. (Citation2020).
3.4.5. Wind circulation
In this section, the wind anomaly has been derived from zonal and meridional (U & V-wind) wind components in the lower and middle levels (300 hPa, 500 hPa & 850 hPa), but the result of low-level analysis (850 hPa) is not shown here (weak patterns). For both of the wind components (U-wind & V-wind), correlation analysis has been done for different periods, as presented in . The U-wind component has a good correlation with Pakistan's JJA rainfall in all periods (NDJ, DJF, JFM, FMA & MAM) except OND. In contrast, the V-wind component has a good correlation in OND, FMA & MAM periods. The MAM period is selected to acquire wind vector for this study, as this is the period where both of the wind components have shown a significant correlation.
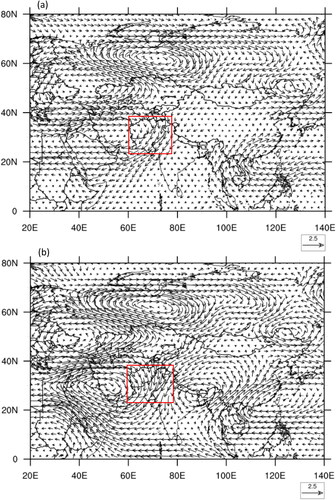
shows March to May (MAM) wind vector anomalies at 500 hPa (a) and 300 hPa (b) for composite drought years. The outflow of wind vectors from Pakistan is observed at both levels (500 hPa & 300 hPa) that has been caused by strong wind anomalies (clockwise circulation) over the region. Such an outward flow of wind vectors from the Indian subcontinent, inhibit moisture transport and cause a dry condition in the region. Such a circulation system indicates enhanced sinking motions associated with precipitation suppuration and, consequently, led to drought conditions. The above-mentioned results are consistent with some previous studies (Ain et al. Citation2020; Qaiser et al. Citation2021).
Figure 8. March to May (MAM) wind vector anomalies at 500 hPa (a) and 300 hPa (b) for composite drought years (units: m2 s-2).
4. Discussion
Understanding drought risk in an agricultural country like Pakistan is vital to combat water scarcity, food security and economic challenges. Although literature reports many studies of drought characterization in the region of Pakistan (Xie et al. Citation2013; Ahmed et al. Citation2016; Haroon et al. Citation2016; Adnan et al., Citation2018) yet it is still unclear how the occurrence of extreme droughts in the observed climate will change under the warming climate. The extreme droughts in Pakistan had posed serious threats to all spectrum of lives, whereas little is known about their characteristics and drivers under changing climate.
Pakistan is situated at the northernmost edge of the Asian monsoonal region and experiences intricate climate variability in summer rainfall (Lu et al. Citation2020). The time-period from June to September is categorized as the summer monsoon season and yields about 57% of total rainfall in Pakistan (Hussain and Lee Citation2016). The spatial rainfall distribution map of Pakistan has shown more rainfall over northern highlands as compared to southern areas (). The positive Rainfall anomalies () can be observed in core monsoon regions of Pakistan (central and some northern area) whereas a strong negative anomaly has been witnessed in southern regions.
Most of the southern and some of the country's extreme northern parts were most hit by droughts with precipitation anomaly of −30 mm. In view of global warming, changes in precipitation patterns due to large-scale atmospheric phenomena including South Asian summer monsoon and western disturbances might have caused severe droughts in Pakistan. The monsoon precipitation has been significantly increased in the north of Pakistan (Hanif et al. Citation2013; Ahmed et al. Citation2018), whereas a substantial decline has been reported over some western and southern parts of the country that are already declared as drought-prone areas (Salma et al. Citation2012; Hina and Saleem Citation2019).
In this paper, we tried to explore the possible cycles and precursor conditions of upcoming droughts in Pakistan. Therefore, in this study, first, we detected the severity and recurrence of drought events in Pakistan, then statistical relationship among summer rainfall of extreme drought years and meteorological parameters (air temperature, SST, SLP, wind variables and geopotential height) prior to rainfall season had been calculated, and finally, drought precursors in Pakistan were figured out to anticipate the occurrence of droughts ahead of time. In order to isolate and categorize the drought years based on severity, SPI and single Z-Index were calculated, and the single Z-index was selected for subsequent analysis. The key reason is that the single Z-Index can capture the dry conditions that cannot be spotted by SPI (Jain et al. Citation2015). The severe and extreme drought years identified in this study are 1987, 1991, 2000, 2001, 2002, and 2005 (). Similar drought years were also found in various other Pakistan studies (Hina and Saleem Citation2019; Ain et al. Citation2020).
The statistical relationship among summer rainfall of extreme drought years and meteorological parameters prior to rainfall season was determined through correlation analysis () and used to investigate the most correlated parameter and months that could be used as a potential parameter for drought prediction. The drought years obtained from single Z-Index have been grouped together and further investigated as a single variable (Adler et al. Citation2003; Bauer and Del Genio Citation2006; Thomas and Martin Citation2007). The region between 0°S, 80°N and 20°E, 140°W was selected to correlate regional meteorological parameters against Pakistan's JJA rainfall of composite drought years. Drought anomalies were calculated and further processed to create composite drought spatial distribution maps.
It was supposed that the atmospheric circulation patterns and associated weather systems few months before the drought summer seasons behave differently from those before the normal or wet seasons. Hence, climatic fluctuations occurring before the dry summer season can be taken into account to forecast droughts well in advance. The results demonstrated that 2 m air temperature sea level pressure, and geopotential height had the highest correlations in JFM period. In contrast, sea surface temperature and the wind had significant correlations in OND and MAM, respectively.
Air temperature is considered as a significant physical driver for extreme climatic conditions and generally negatively correlated with South Asian rainfall; it hence might be used as proxy indicator for the onset of drought in some cases. This study established that temperature status in JFM period in Pakistan can be employed to predict the nature of the upcoming season. The anomalous air temperature patterns in JFM () indicated remarkably cooler than normal weather in the south Asian regions, including Pakistan. These low temperatures can inhibit the convection activity and henceforth disturb normal rainfall in the region. In addition to this, the local atmospheric warming can be considered as another vital process that influences the character of weather extremes (Sharma and Mujumdar Citation2019).
The analysis of sea level pressure in JFM period is presented in . The spatial pattern portrays a substantial high-pressure system (positive anomalies) over the Himalayan region in the north of Pakistan while low-pressure system (negative anomalies) over some parts of Pakistan's southern region. ENSO influences rainfall deficits over South Asia, and an earlier signal of positive SLP anomalies has shown a connection to droughts in the sub-region (Mishra, Citation2020a). The substantial increasing trend in SLP from northwest India up till the Bay of Bengal suggests a weakening of monsoon trough compares well with the study conducted by Preethi et al. (Citation2017) and could result in subdued precipitation activity over northern parts of the India region (Preethi et al. Citation2017).
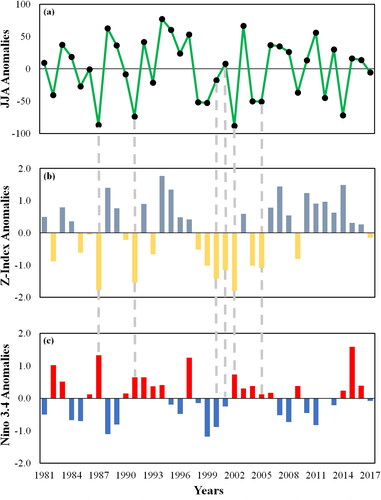
SST is a key climate variable that defines the interaction among oceanic and atmospheric phenomena (Wmo, n.d; Bojinski et al. Citation2014), and SST variations had triggered many drought events worldwide (Fan et al. Citation2017; Tefera et al. Citation2020). The OND SST anomalies () showed increasing trend and a warm pool in the Arabian Sea and Bay of Bengal which proposes development of convection in Arabian Sea that might be a reason of precipitation deficit which consequently cause severe droughts in the Indian subcontinent (Preethi et al. Citation2017). The trends of SST anomalies in this study agree with the study conducted by Barlow et al. (Citation2016). Literature reported that ENSO influences SASM through the Walker circulation (east–west displacement), the changes in SST anomalies can result in the change in the strength and position of Walker circulation anomalies, that subsequently alter the spatial configurations of precipitation anomalies over the South and Southeast Asia (Roxy, Ritika, Terray, Masson Citation2015; Roxy, Ritika, Terray, Murtugudde, et al. Citation2015). The composite dry years in this study were under the influence of ENSO, confirming the upshot of ENSO in causing droughts in the study area. From the six drought years (1987, 1991, 2000, 2001, 2002, and 2005), five of them were under the influence of ENSO conditions and only one year (1991) was categorized as neutral year (see ).
Figure 9. Hot and dry extremes over Pakistan during the core monsoon season (JJA) and associated links with the ENSO during 1981-2017. (a) Three-month (June to August) precipitation anomalies, (b) the single Z-index anomalies, (c) Nino 3.4 SST anomalies during the same time period. Grey vertical bars denote the dry monsoon anomalies associated with the 6 most severe and extreme drought years.
For geopotential height anomaly in JFM (), a strong Anticyclone has been seen over the north of Pakistan with an eastward extension. In contrast, a strong negative high anomaly with the cyclonic flow can be observed over most parts of Pakistan, which in turn transport moisture out of the region and cause dry weather. These results are consistent with the findings of previous studies (Qaiser et al. Citation2021; Ain et al. Citation2020).
The wind circulation patterns in and around Pakistan in the middle levels can also be used as a precursor of drought. Notably, during the MAM period of composite dry years, the outflow of wind vectors from Pakistan is observed at both levels (500 hPa & 300 hPa) that has been caused by strong wind anomalies (clockwise circulation) over the region. Such an outward flow of wind vectors from the Indian subcontinent inhibits moisture transport and cause a dry condition in the region.
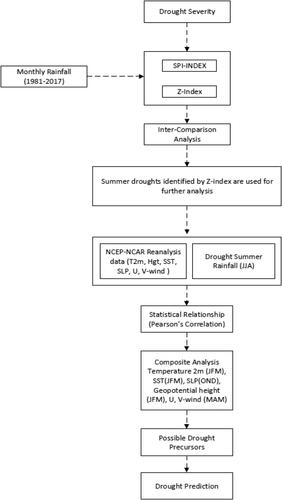
In summary, this study identified the periods at which the patterns of various meteorological parameters could be employed to forecast seasonal changes (weather patterns) a few months in advance (see ). Hence, the inception of drought events can be assessed.
Figure 10. Schematic diagram of drought severity assessment and drought prediction.
5. Conclusion
Drought is a complex phenomenon that must be investigated more comprehensively under climate change. There are many studies regarding the characterization of droughts in Pakistan and their relation to large-scale atmospheric dynamics. Yet, there is a lack of studies concerning the precursor conditions responsible for the dry (wet) spells in the region. The severity and recurrence of drought events have been investigated, along with its precursors for the region of Pakistan, and the following conclusions can be made:
The spatial patterns of Pakistan's annual summer rainfall anomalies have shown positive anomalies over core monsoon regions of Pakistan (central and northern areas), whereas in the southern areas, a strong negative anomaly has been witnessed.
The years 1994 and 2014 are categorized as the extreme wet years, whereas 1987, 1991, and 2002 fall into the extreme dry years, ranked on the basis of standardized total summer rainfall threshold value. The Single Z-index also well captures the dry episodes during 1987, 1991, 2000, 2001, 2002 and 2005, and is a good indicator for the identification of dry (wet) spells in the region.
The JFM air temperature anomalies of composite dry years have been remarkably cooler than normal weather in the study region that may inhibit the convection activity and consequently disturb the normal rainfall.
The spatial pattern of SLP for JFM period portrays a substantial high-pressure system (positive anomalies) over the Himalayan region and a negative anomaly over southern parts of Pakistan. The substantial increasing trend in SLP from northwest India up to the Bay of Bengal suggests a weakening of monsoon trough resulting in subdued precipitation.
The OND SST anomaly shows an increasing trend and a warm pool in the Arabian Sea and Bay of Bengal. The warming trend over the Arabian Sea has a high magnitude (exceeding 0.3 °C) compared to the Bay of Bengal. This suggests the development of convection in the Arabian Sea, contrary to the Bay of Bengal that might be a reason for the precipitation deficit and consequently cause severe droughts in the Indian subcontinent.
Geopotential height anomalies of JFM for composite dry years show a strong positive anomaly (anticyclone) over the north of Pakistan that can fetch cold, dry air from the northeast and resulted in dry conditions.
The outflow of wind vectors (during the MAM period of composite dry years) from Pakistan is observed at both levels (500 hPa & 300 hPa). Such an outward flow of wind vectors from the Indian subcontinent inhibits moisture transport and causes a precipitation suppuration that consequently led to drought conditions.
The present study results, including drought characteristics, trends, periodicity, and associations with large-scale climatic variables, are useful for recognizing the drought mechanism at a regional scale and will offer the scientific basis to develop an early warning system to mitigate and adapt against the drought impacts.
Acknowledgements
The authors gratefully acknowledge the CAS-TWAS President's PhD Fellowship Program. We thank the Pakistan Meteorological Department for providing the datasets for the study. We are also grateful for the selfless guaidance of Professor Dr. Riyu Lu and financial support by The Second Tibetan Plateau Scientific Expedition and Research (STEP) program.
Data availability statement
The monthly reanalysis data sets that support the findings of this study are publically availabl at: https://www.ecmwf.int/en/forecasts/datasets/reanalysis-datasets/era5
The station data was obtained from Pakista meterological department https://www.pmd.gov.pk/en/
Correction Statement
This article has been republished with minor changes. These changes do not impact the academic content of the article.
Additional information
Funding
References
- Abramowitz M. 1964. Handbook of mathematical functions. Applied Mathematics Series. National Bureau of Standards, Dover Publications, New York. (55)
- Adler RF, Huffman GJ, Chang A, Ferraro R, Xie P-P, Janowiak J, Rudolf B, Schneider U, Curtis S, Bolvin D, et al. 2003. The version-2 global precipitation climatology project (GPCP) monthly precipitation analysis (1979–present). J Hydrometeor. 4(6):1147–1167.
- Adnan S, Ullah K, Shouting G. 2016. Investigations into precipitation and drought climatologies in South Central Asia with special focus on Pakistan over the period 1951–2010. J Climate. 29(16):6019–6035.
- Adnan S, Ullah K, Shuanglin L, Gao S, Khan AH, Mahmood R. 2018. Comparison of various drought indices to monitor drought status in Pakistan. Clim Dyn. 51(5-6):1885–1899.
- Afzaal M, Haroon MA, Ul Zaman Q. 2009. Interdecadal oscillations and the warming trend in the area-weighted annual mean temperature of Pakistan. Pakistan J Meteorol. 6(11): 13–19.
- Ahmad I, Ambreen R, Sultan S, Sun Z, Deng W. 2014. Spatial-temporal variations in January precipitation over the period of 1950-2000 in Pakistan and possible links with global teleconnections: geographical perspective. AJCC. 03(04):378–387.
- Ahmad I, Zhaobo S, Weitao D, Ambreen R. 2010. Trend analysis of January temperature in Pakistan over the period of 1961-2006: Geographical perspective. Pakistan J Meteorol. 7(13): 11–22.
- Ahmed F, Adnan S, Latif M. 2020. Impact of jet stream and associated mechanisms on winter precipitation in Pakistan. Meteorol Atmos Phys.. 132((2)):225–238..
- Ahmed K, Shahid S, bin Harun S, Wang X-j. 2016. Characterization of seasonal droughts in Balochistan Province, Pakistan. Stoch Environ Res Risk Assess. 30(2):747–762.
- Ahmed K, Shahid S, Nawaz N. 2018. Impacts of climate variability and change on seasonal drought characteristics of Pakistan. Atmos Res. 214:364–374.
- Ain NU, Latif M, Ullah K, Adnan S, Ahmed R, Umar M, Azam M. 2020. Investigation of seasonal droughts and related large-scale atmospheric dynamics over the Potwar Plateau of Pakistan. Theor Appl Climatol. 140(1-2):69–89.
- Al-Kaisi MM, Elmore RW, Guzman JG, Hanna HM, Hart CE, Helmers MJ, Hodgson EW, Lenssen AW, Mallarino AP, Robertson AE, et al. 2013. Drought impact on crop production and the soil environment: 2012 experiences from Iowa. J Soil Water Conserv. 68(1):19A–24A.
- Annamalai H, Hafner J, Sooraj K, Pillai P. 2013. Global warming shifts the monsoon circulation, drying South Asia. J Climate. 26(9):2701–2718.
- Arshad M, Ma X, Yin J, Ullah W, Ali G, Ullah S., …, Ullah I. 2021. Evaluation of GPM-IMERG and TRMM-3B42 precipitation products over Pakistan. Atmospheric Research. 249, 105341.
- Azad S, Rajeevan M. 2016. Possible shift in the ENSO-Indian monsoon rainfall relationship under future global warming. Sci Rep. 6(1):1–6.
- Barlow M, Cullen H, Lyon B. 2002. Drought in central and southwest Asia: La Niña, the warm pool, and Indian Ocean precipitation. J Climate. 15(7):697–700.
- Barlow M, Zaitchik B, Paz S, Black E, Evans J, Hoell A. 2016. A review of drought in the Middle East and southwest Asia. J Climate. 29(23):8547–8574.
- Bauer M, Del Genio AD. 2006. Composite analysis of winter cyclones in a GCM: Influence on climatological humidity. J Climate. 19(9):1652–1672.
- Bojinski S, Verstraete M, Peterson TC, Richter C, Simmons A, Zemp M. 2014. The concept of essential climate variables in support of climate research, applications, and policy. Bull Am Meteorol Soc. 95(9):1431–1443.
- Bollasina M, Nigam S. 2011. The summertime “heat” low over Pakistan/northwestern India: evolution and origin. Clim Dyn. 37(5-6):957–970.
- Cao J, Hu J, Tao Y. 2012. An index for the interface between the Indian summer monsoon and the East Asian summer monsoon. J Geophys Res. 117(D18).
- Chang WYB. 1997. Enso: extreme climate events and their impacts on Asian Deltas 1. J Am Water Resources Assoc. 33(3):605–614.
- del Rio S, Anjum Iqbal M, Cano‐Ortiz A, Herrero L, Hassan A, Penas A. 2013. Recent mean temperature trends in Pakistan and links with teleconnection patterns. Int J Climatol. 33(2):277–290.
- Ding Q, Wang B. 2005. Circumglobal teleconnection in the Northern Hemisphere summer. J Climate. 18(17):3483–3505.
- Dutra E, Magnusson L, Wetterhall F, Cloke HL, Balsamo G, Boussetta S, Pappenberger F. 2013. The 2010–2011 drought in the Horn of Africa in ECMWF reanalysis and seasonal forecast products. Int J Climatol. 33(7):1720–1729.
- Eckstein D, Künzel V, Schäfer L, Winges M. 2020. Global climate risk index. Bonn: Germanwatch.
- Edwards DC. 1997. Characteristics of 20th century drought in the United States at multiple time scales. Air Force Inst of Tech Wright-Patterson AFB OH.
- Fan F, Dong X, Fang X, Xue F, Zheng F, Zhu J. 2017. Revisiting the relationship between the South Asian summer monsoon drought and El Niño warming pattern. Atmos Sci Lett. 18(4):175–182.
- Fan F, Mann ME, Lee S, Evans JL. 2010. Observed and modeled changes in the South Asian summer monsoon over the historical period. J Climate. 23(19):5193–5205.
- Farooqi AB, Khan AH, Mir H. 2005. Climate change perspective in Pakistan. Pakistan J Meteorol. 2(3): 11–21
- Feng S, Oglesby RJ, Rowe CM, Loope DB, Hu Q. 2008. Atlantic and Pacific SST influences on medieval drought in North America simulated by the community atmospheric model. J Geophys Res. 113(D11)
- Gadgil S, Vinayachandran P, Francis P, Gadgil S. 2004. Extremes of the Indian summer monsoon rainfall, ENSO and equatorial Indian Ocean oscillation. Geophys Res Lett. 31(12).
- Grove RH. 1998. Global impact of the 1789-93 El Niño. Nature. 393(6683):318–319.
- Hanif M, Khan AH, Adnan S. 2013. Latitudinal precipitation characteristics and trends in Pakistan. J Hydrol. 492:266–272.
- Hao Z, Singh VP, Xia Y. 2018. Seasonal drought prediction: advances, challenges, and future prospects. Rev Geophys. 56(1):108–141.
- Haroon MA, Zhang J, Yao F. 2016. Drought monitoring and performance evaluation of MODIS-based drought severity index (DSI) over Pakistan. Nat Hazards. 84(2):1349–1366.
- Hina S, Saleem F. 2019. Historical analysis (1981-2017) of drought severity and magnitude over a predominantly arid region of Pakistan. Clim Res. 78(3):189–204.
- Hoerling M, Eischeid J, Kumar A, Leung R, Mariotti A, Mo K, Schubert S, Seager R. 2014. Causes and predictability of the 2012 Great Plains drought. Bull Am Meteorol Soc. 95(2):269–282.
- Hong CC, Hsu HH, Lin NH, Chiu H. 2011. Roles of European blocking and tropical‐extratropical interaction in the 2010 Pakistan flooding. Geophys Res Lett. 38(13).
- Hong X, Lu R. 2016. The meridional displacement of the summer Asian jet, Silk Road pattern, and tropical SST anomalies. J Climate. 29(10):3753–3766.
- Hussain MS, Lee S. 2009. A classification of rainfall regions in Pakistan. Journal of the Korean Geographical Society. 44(5):605–623.
- Hussain MS, Lee S. 2016. Investigation of summer monsoon rainfall variability in Pakistan. Meteorol Atmos Phys. 128(4):465–475.
- Jain VK, Pandey RP, Jain MK, Byun H-R. 2015. Comparison of drought indices for appraisal of drought characteristics in the Ken River Basin. Weather Clim Extremes. 8:1–11.
- Jamro S, Channa FN, Dars GH, Ansari K, Krakauer NY. 2020. Exploring the Evolution of Drought Characteristics in Balochistan. Pakistan. Appl Sci. 10(3):913.
- Jamro S, Dars GH, Ansari K, Krakauer NY. 2019. Spatio-temporal variability of drought in Pakistan using standardized precipitation evapotranspiration index. Appl Sci. 9(21):4588.
- Khan N, Sachindra D, Shahid S, Ahmed K, Shiru MS, Nawaz N. 2020. Prediction of droughts over Pakistan using machine learning algorithms. Adv Water Resour. 139:103562.
- Khan N, Shahid S, Chung E-S, Kim S, Ali R. 2019. Influence of surface water bodies on the land surface temperature of Bangladesh. Sustainability. 11(23):6754.
- Khan N, Shahid S, Ismail T, Ahmed K, Nawaz N. 2019. Trends in heat wave related indices in Pakistan. Stoch Environ Res Risk Assess. 33(1):287–302.
- Krishnamurthy V, Goswami B. 2000. Indian monsoon–ENSO relationship on interdecadal timescale. J Climate. 13(3):579–595.
- Latif M, Syed F. 2016. Determination of summer monsoon onset and its related large-scale circulation characteristics over Pakistan. Theor Appl Climatol. 125(3-4):509–520.
- Latif M, Syed F, Hannachi A. 2017. Rainfall trends in the South Asian summer monsoon and its related large-scale dynamics with focus over Pakistan. Clim Dyn. 48(11-12):3565–3581.
- Lu J, Delworth TL. 2005. Oceanic forcing of the late 20th century Sahel drought. Geophys Res Lett. 32(22).
- Lu R, Hina S, Hong X. 2020. Upper-and Lower-tropospheric Circulation Anomalies Associated with Interannual Variation of Pakistan Rainfall during Summer. Adv Atmos Sci. 37(11):1179–1190.
- Lu R-Y, Oh J-H, Kim B-J. 2002. A teleconnection pattern in upper-level meridional wind over the North African and Eurasian continent in summer. Tellus A Dyn Meteorol Oceanogr. 54(1):44–55.
- McKee TB, Doesken NJ, Kleist J. editors. 1993. The relationship of drought frequency and duration to time scales. Proceedings of the 8th Conference on Applied Climatology; Boston.
- McKee TB, editor. 1995. Drought monitoring with multiple time scales. Proceedings of 9th Conference on Applied Climatology, Boston.
- McVicar T, Bierwirth P. 2001. Rapidly assessing the 1997 drought in Papua New Guinea using composite AVHRR imagery. Int J Remote Sens. 22(11):2109–2128.
- Mie Sein ZM, Ullah I, Syed S, Zhi X, Azam K, Rasool G. 2021. Interannual Variability of Air Temperature over Myanmar: The Influence of ENSO and IOD. Climate. 9(2):35.
- Mishra V. 2020b. Long-term (1870–2018) drought reconstruction in context of surface water security in India. J Hydrol. 580:124228.
- Mishra V. 2020a. Relative contribution of precipitation and air temperature on dry season drying in India, 1951–2018. J Geophys Res Atmos. 125(15):e2020JD032998.
- Mishra AK, Singh VP. 2010. A review of drought concepts. J Hydrol. 391(1-2):202–216.
- Moors EJ, Stoffel M. 2013. Changing monsoon patterns, snow and glacial melt, its impacts and adaptation options in northern India: Synthesis. Sci Total Environ. 12(1):468–469.
- Nangombe S, Madyiwa S, Wang J. 2018. Precursor conditions related to Zimbabwe’s summer droughts. Theor Appl Climatol. 131(1-2):413–431.
- Naresh Kumar M, Murthy C, Sesha Sai M, Roy P. 2009. On the use of Standardized Precipitation Index (SPI) for drought intensity assessment. Met Apps. 16(3):381–389.
- Nielsen-Gammon J. 2011. The 2011 Texas drought: A briefing packet for the Texas legislature.
- Omidvar K, Fatemi M, Narangifard M, Hatami Bahman Beiglou K. 2016. A study of the circulation patterns affecting drought and wet years in central Iran. Adv Meteorol. 2016:1–14.
- Peterson TC, Stott PA, Herring S. 2012. Explaining extreme events of 2011 from a climate perspective. Bull Amer Meteor Soc. 93(7):1041–1067.
- Portela MM, dos Santos JF, Silva AT, Benitez JB, Frank C, Reichert JM. 2015. Drought analysis in southern Paraguay, Brazil and northern Argentina: regionalization, occurrence rate and rainfall thresholds. Hydrol Res. 46(5):792–810.
- Prabhakar S, Shaw R. 2008. Climate change adaptation implications for drought risk mitigation: a perspective for India. Clim Change. 88(2):113–130.
- Preethi B, Mujumdar M, Kripalani R, Prabhu A, Krishnan R. 2017. Recent trends and tele-connections among South and East Asian summer monsoons in a warming environment. Clim Dyn. 48(7-8):2489–2505.
- Qaiser G, Tariq S, Adnan S, Latif M. 2021. Evaluation of a composite drought index to identify seasonal drought and its associated atmospheric dynamics in Northern Punjab, Pakistan. J Arid Environ. 185:104332.
- Rajagopalan B, Cook E, Lall U, Ray BK. 2000. Spatiotemporal variability of ENSO and SST teleconnections to summer drought over the United States during the twentieth century. J Climate. 13(24):4244–4255.
- Rasul G, Dahe Q, Chaudhry Q. 2008. Global warming and melting glaciers along southern slopes of HKH ranges. Pakistan J Meteorol. 5(9): 63–76.
- Reynolds RW, Smith TM, Liu C, Chelton DB, Casey KS, Schlax MG. 2007. Daily high-resolution-blended analyses for sea surface temperature. J Climate. 20(22):5473–5496.
- Roxy MK, Ritika K, Terray P, Masson S. 2015. Indian Ocean warming–the bigger picture. Bull Amer Meterol Soc. 96(7):1070–1072.
- Roxy MK, Ritika K, Terray P, Murtugudde R, Ashok K, Goswami B. 2015. Drying of Indian subcontinent by rapid Indian Ocean warming and a weakening land-sea thermal gradient. Nat Commun. 6(1):1–10.
- Saeed S, Müller WA, Hagemann S, Jacob D, Mujumdar M, Krishnan R. 2011. Precipitation variability over the South Asian monsoon heat low and associated teleconnections. Geophys Res Lett. 38(8).
- Saleem F, Zeng X, Hina S, Omer A. 2021. Regional changes in extreme temperature records over Pakistan and their relation to Pacific variability. Atmos Res. 250:105407.
- Salma S, Shah M, Rehman S. 2012. Rainfall trends in different climate zones of Pakistan. Pakistan J Meteorol. 9(17): 37–47.
- Shakoor U, Saboor A, Baig I, Afzal A, Rahman A. 2015. Climate variability impacts on rice crop production in Pakistan. Pakistan J Agric Res. 28(1): 19–27.
- Sharma S, Mujumdar P. 2019. On the relationship of daily rainfall extremes and local mean temperature. J Hydrol. 572:179–191.
- Sheffield J, Andreadis K, Wood EF, Lettenmaier D. 2009. Global and continental drought in the second half of the twentieth century: Severity–area–duration analysis and temporal variability of large-scale events. J Climate. 22(8):1962–1981.
- Solomon A, Shin S-I, Alexander MA, McCreary JP. 2008. The relative importance of tropical variability forced from the North Pacific through ocean pathways. Clim Dyn. 31(2-3):315–331.
- Soro G, Anouman D, Bi TG, Srohorou B, Savane I. 2014. Caractérisation des séquences de sècheresse météorologique à diverses échelles de temps en climat de type soudanais: cas de l’extrême nord-ouest de la Cote d’Ivoire. LARHYSS J. (18): 107–124.
- Spinoni J, Naumann G, Carrao H, Barbosa P, Vogt J. 2014. World drought frequency, duration, and severity for 1951–2010. Int J Climatol. 34(8):2792–2804.
- Sun A, Gao B. 2000. A diagnostic analyses of serious flood/drought during summer season in the North China Plane. Chin J Atmos Sci. 24(3):393–402.
- Syed FS, Giorgi F, Pal J, Keay K. 2010. Regional climate model simulation of winter climate over Central–Southwest Asia, with emphasis on NAO and ENSO effects. Int J Climatol J R Meteorol Soc. 30(2):220–235.
- Syed FS, Yoo JH, Körnich H, Kucharski F. 2012. Extratropical influences on the inter-annual variability of South-Asian monsoon. Clim Dyn. 38(7-8):1661–1674.
- Tefera A, Ayoade J, Bello N. 2020. Analyses of the relationship between drought occurrences and their causal factors in Tigray Region, Northern Ethiopia. Tellus A Dynamic Meteorol Oceanogr. 72(1):1–18.
- Thom HC. 1958. A note on the gamma distribution. Mon Wea Rev. 86(4):117–122.
- Thomas BC, Martin JE. 2007. A synoptic climatology and composite analysis of the Alberta Clipper. Weather and Forecasting. 22(2):315–333.
- Tigkas D, Vangelis H, Tsakiris G. 2015. DrinC: a software for drought analysis based on drought indices. Earth Sci Inform. 8(3):697–709.
- Trenberth KE, Shea DJ. 2005. Relationships between precipitation and surface temperature. Geophys Res Lett. 32(14).
- Ullah I, Ma X, Yin J, Asfaw TG, Azam K, Syed S, …, Shahzaman M. 2021. Evaluating the meteorological drought characteristics over Pakistan using in situ observations and reanalysis products. Int J Climatol. 2021; 1–23.
- van Dijk AIJM, Beck HE, Crosbie RS, de Jeu RAM, Liu YY, Podger GM, Timbal B, Viney NR. 2013. The Millennium Drought in southeast Australia (2001–2009): Natural and human causes and implications for water resources, ecosystems, economy, and society. Water Resour Res. 49(2):1040–1057.
- Vellore RK, Kaplan ML, Krishnan R, Lewis JM, Sabade S, Deshpande N, Singh BB, Madhura RK, Rama Rao MVS. 2016. Monsoon-extratropical circulation interactions in Himalayan extreme rainfall. Clim Dyn. 46(11-12):3517–3546.
- Wang SY, Davies RE, Huang WR, Gillies RR. 2011. Pakistan's two‐stage monsoon and links with the recent climate change. J Geophys Res. 116(D16)
- Wmo G. n.d. Status of the global observing system for climate.
- Wu H, Hayes MJ, Weiss A, Hu Q. 2001. An evaluation of the Standardized Precipitation Index, the China‐Z Index and the statistical Z‐Score. Int J Climatol. 21(6):745–758.
- Xie H, Ringler C, Zhu T, Waqas A. 2013. Droughts in Pakistan: a spatiotemporal variability analysis using the Standardized Precipitation Index. Water Int. 38(5):620–631.
- Xu L, Chen N, Zhang X, Chen Z. 2018. An evaluation of statistical, NMME and hybrid models for drought prediction in China. J Hydrol. 566:235–249.
- Yadav RK. 2017. Midlatitude Rossby wave modulation of the Indian summer monsoon. QJR Meteorol Soc. 143(706):2260–2271.
- Zhang Z, Chen X, Xu C-Y, Hong Y, Hardy J, Sun Z. 2015. Examining the influence of river–lake interaction on the drought and water resources in the Poyang Lake basin. J Hydrol. 522:510–521.
- Zhang M, He J, Wang B, Wang S, Li S, Liu W, Ma X. 2013. Extreme drought changes in Southwest China from 1960 to 2009. J Geogr Sci. 23(1):3–16.
- Zhou F, Zhang R, Han J. 2019. Relationship between the circumglobal teleconnection and Silk Road pattern over Eurasian continent. Sci Bull. 64(6):374–376.