
 ?Mathematical formulae have been encoded as MathML and are displayed in this HTML version using MathJax in order to improve their display. Uncheck the box to turn MathJax off. This feature requires Javascript. Click on a formula to zoom.
Abstract
In this study, two novel hybrid models namely Bagging-based Rough Set (BRS) and AdaBoost-based Rough Set (ABRS) were used to generate landslide susceptibility maps of Son La hydropower reservoir basin, Vietnam. In total, 186 past landslide events and twelve landslides affecting factors (slope degree, slope aspect, elevation, curvature, focal flow, river density, rainfall, aquifer, weathering crust, lithology, fault density and road density) were considered in the modeling study. The landslide data was split into training (70%) and testing (30%) for the model’s development and validation. One R feature selection method was used to select and prioritize the landslide affecting factors based on their importance in model prediction. Performance of the hybrid developed models was evaluated and also compared with single rough set (RS) and support vector machine (SVM) models using various standard statistical measures including area under the curve (AUC)-receiver operating characteristics (ROC) curve. The results show that the developed hybrid model BRS (AUC = 0.845) is the most accurate model in comparison to other models (ABRS, SVM and RS) in predicting landslide susceptibility. Therefore, the BRS model can be used as an effective tool in the development of an accurate landslide susceptibility map of the hilly area.
1. Introduction
Landslide Incidents (LI) are common in hilly and mountainous areas, which cause huge losses of life and properties affecting socio-economic conditions of a region (Rossi et al. Citation2019; Chen et al. Citation2019b). Landslides are gravitational downward movement of rock/soil and ground mass (Tacconi Stefanelli et al. Citation2020). Early spatial prediction of landslides is desirable to prevent the landslides, and thus, the damages (Lombardo et al. Citation2020). Natural and anthropogenic activities usually affect the landslides occurrence (Liu et al. Citation2020). Researchers have come up with various methods to identify landslide prone areas and solutions to reduce the adverse consequences of landslides. Landslide susceptibility mapping (LSM) is one of the most appropriate methods, which helps in forecasting the landslide prone places in specific areas. Generally, it is assumed that future landslides in an area will occur under similar conditions of the past. Therefore, spatial relationship between the variables that affect the occurrence of landslides is appropriate to identify and predict the places of future landslides (Chen et al. Citation2019a; Nhu et al. Citation2020d).
LSM allows decision makers to priorities sensitive areas for better land use planning and management (Mohammady et al. Citation2012). It is important to note that the accuracy and precision of the input data is very important for any modeling, including landslide modeling (Chen and Chen Citation2021). Advances in Remote Sensing Technology (RST) and Geographic Information Systems (GIS) have improved the landslide susceptibility mapping and zoning (Tavakkoli Piralilou et al. Citation2019). There are different methods for landslide susceptibility mapping including qualitative (knowledge based), quantitative (statistical and Machine Learning) (Hussin et al. Citation2016). However, the choice of precise methods for landslide susceptibility mapping is still debatable (Dao et al. Citation2020). Statistical methods used in the LSM include Weights-of-Evidence (WoE), Evidential Belief Function (EBF) and Frequency Ratio (FR) (Dahal et al. Citation2008; Nampak et al. Citation2014; Wang et al. Citation2019). Nowadays, Machine Learning (ML) methods are frequently used in landslide studies namely Artificial Neural Network (ANN), Support Vector Machine (SVM) (Pradhan Citation2013; Jaafari Citation2018; Yan et al. Citation2019), Random Forest (RAF), Logistic Model Tree (LMT) (Guzzetti et al. Citation2012; Zare et al. Citation2013; Tsangaratos and Ilia Citation2016; Aditian et al. Citation2018; Ghorbanzadeh et al. Citation2019; Yan et al. Citation2019). Other ML algorithms used for predicting landslide susceptibility are Credal Decision Tree (CDT) and Radial Basis Function Network (RBFN); Kernel Logistic Regression, Adaptive Neuro Fuzzy Inference System (ANFIS), Gaussian process regression (GPR), Naïve Bayes Tree (NBT), Alternating DecisionTree (ADTree), Bayesian Logistic Regression (BLR), Bayesian Algorithm (BA) (Chapi et al. Citation2017; Chen et al. Citation2017, Citation2018b; Tien Bui et al. Citation2018; Zhang et al. Citation2018; Abedini et al. Citation2019b; Chen et al. Citation2019b; Dou et al. Citation2019; Nhu et al. Citation2020a).
Recently, hybrid ML methods have yielded promising results in many fields (Pham et al. Citation2018b; Nhu et al. Citation2020c) including LSM. Some of these methods are MultiBoost with Logistic Regression (Pham et al. Citation2019), Bagging with RAF (Hong et al. Citation2020), Random Subspace RAF (Pham et al. Citation2020) and Rotation Forest with Logistic Model Tree (Fang et al. Citation2021).
Improvement in the capability of prediction with different combination of ML methods is continuous process. Therefore, in this study, we have explored novel hybrid models namely Bagging-RS (BRS), AdaBoost-RS (ABRS) in the LSM of the Son La hydropower reservoir basin, Vietnam to select the best model. Performance of the models was evaluated using standard statistical methods including AUC (area under the curve)-ROC (receiver operating characteristics) curve. Results were also compared with other two good single ML methods namely rough set (RS), and SVM. The main difference of this study compared with previous works is that it is the first time the ensemble optimization techniques of Bagging and AdaBoost were used to integrate with RS for the development of hybrid models (BRS and ABRS) for exploring the possibility of better accurate LSM. In this study, we have used Weka software and GIS applications to prepare the data and generate the models.
2. Description of hydropower reservoir basin
The Son La hydropower reservoir area (21°15'15 '' to 22°17'10 '' N; 102°50'10 '' to 104°35 '15′ E) is located in the Da river basin in the north-western part of Vietnam, covering an area of 5381 km2, falling in part of Lai Chau, Dien Bien and Yen Bai provinces (). This area is prone to landslides as several incidences of landslides have been recorded in the catchment area of hydropower dam. Report of the Natural Disaster Prevention and Control (CCNDPC) indicated that 10 people were killed and 4 injured by landslides and flash floods only in the Muong La district of Son La Province, besides 258 houses were damaged, out of which, 179 completely washed away (Vietnam’s Central Steering Committee for Natural Disaster Prevention and Control 2017 report).
Figure 1. Location of the study area and past landslides.
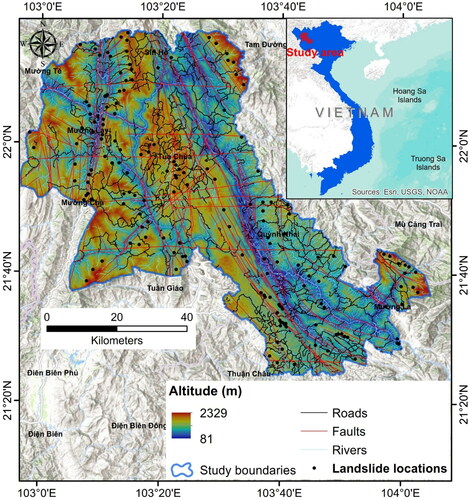
Topography of the area is hilly with narrow river valleys and wide plateaus. The hills are aligned in Northwest to Southeast direction. Geologically, the area is complex associated with folded and faulted rocks indicating tectonic activities in this region. Rock types present in the study area include magmatic metamorphic rocks (biotite gneiss, biotite-granite-cordierite-sillimanite, quartz-biotite-plagioclase-hypersthene schist, two-pyroxene gneiss, biotite-sillimanite-cordierite-granite gneiss, gneiss biotite-granite, quartz-biotite-sillimanite) and sedimentary rocks (shale, sandstone, siltstone). Major part of the area (75%) is covered by forest land.
Son La hydropower catchment area has varied climate with temperature ranging from −4.7 °C to 41.8 °C (Average temp 21.4 °C). The hottest season spreads from June to August, while the coldest one is placed between November–December. The annual average relative humidity fluctuates between 78% and 93%. There are two distinct seasons in the year: the rainy season which lasts from April to September, and the dry season from October to March of the following year. Rainfall is unevenly distributed throughout the year. Total average rainy days in the year, fluctuates from 114 to 118 days. Up to 80% of the annual rainfall falls during rainy season (May–September). June–August period has the highest rainfall (>300 mm/month). Most of the landslides occur during the months of July and August.
3. Data used
3.1. Landslide inventory
Landslide inventory is one of the prerequisites for the LSM. Landslide inventory map provides an important information regarding the following elements: landslide sites, kind of landslide, landslide modulation, causes and triggers of landslides (i.e. earthquakes, heavy rainfall and rapid snowmelt) (Tien Bui et al. Citation2019). Researchers have found that Incidence of past landslides in an area has a strong relationship with the future occurrences of landslides (Galli et al. Citation2008). Therefore, landslide inventory mapping is a significant and necessary part of landslide studies. In this study, in total 186 landslide past events were mapped in the study area with the help of Google Earth images and field studies ( and ).
Figure 2. Landslide photographs of the study area (taken by Quan Cong Nguyen, Institute of Geological Sciences; source: national project coded: VT/UD-03/13-15).
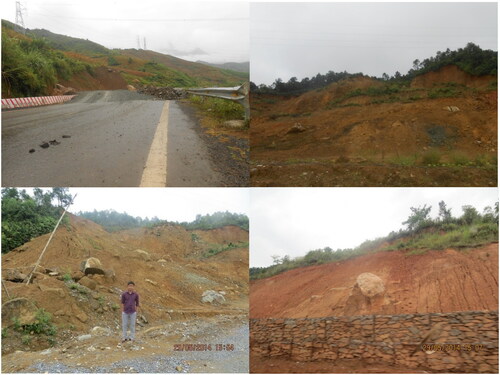
In the study area, rock, debris and mixed types of landslides have been reported. About 80% landslide in this area of small (<200 m3) and medium (200–1000 m3) size, whereas 20% landslides are of large sliding blocks (>1000 m3). For the model study, equal numbers of non-landslide points were randomly placed across the study area where no past landslide events were recorded so far. This procedure of selection the non-landslides points was made according to the literature survey (Tien Bui et al. Citation2016). These non-landslide points assigned the value ‘0’ and landslide points ‘1’ in the landslide susceptibility modeling. Landslide data was split into 70:30 ratio for training (70%) and testing/validation (30%) of the models. This split ratio was selected based on the experience and literature survey for the better accurate performance of the models (Sahin et al. Citation2020).
3.2. Landslide conditioning factors
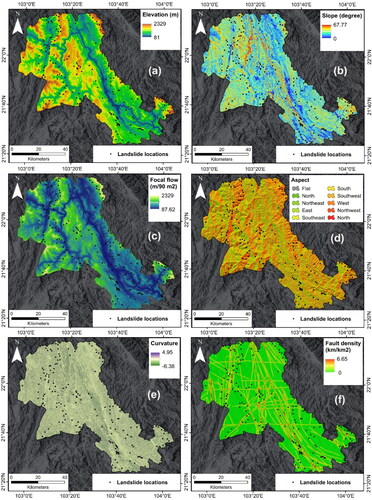
In the present study, 12 landslide affecting factors, based on the topography (slope degree, slope aspect, elevation, curvature), hydrology (river density, rainfall, aquifer), geology (weathering crust, lithology, focal flow and fault density) and man-made relevant variables (road density), were considered in the development of models. A digital elevation model (DEM) (https://search.asf.alaska.edu/) with a raster resolution of 12.5 m was used to generate the topographical factors maps. Geology and other factors thematic maps were generated from the available data of the government organization, literature and Google Earth Images. ArcGIS software was used for the development of thematic maps ().
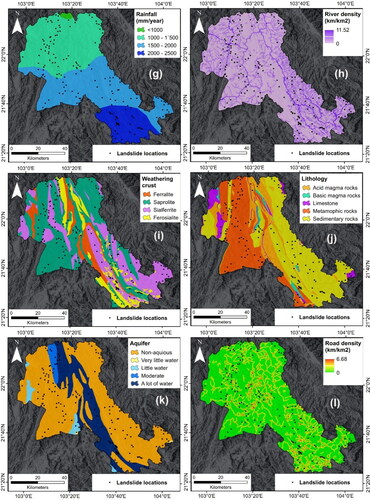
Figure 3. Factor maps: Elevation(a), Slope degree (b), Focal flow (c), Slope aspect (d), Curvature (e), Fault density (f), Rainfall (g), River density (h), Weathering crust (i), Lithology (j), Aquifer (k) and Road density (l).
3.2.1. Elevation
Elevation is one of the important factors because it affects the humidity and temperature regimes, soil moisture, rain fall patterns and weathering (He et al. Citation2012). Most of the hills having high elevations are the result of geologic tectonic activities causing deformation of the rocks, and thus, more vulnerable to landslides (Ercanoglu and Gokceoglu Citation2004). Elevation map was prepared from the DEM in GIS application ().
3.2.2. Slope degree
Slope is the angle that represent vertical change versus a horizontal change between two points on the surface of the earth or body (Moosavi and Niazi Citation2016). It is a measure of steepness of hill ore ground. Slope degree is an acting as a cause variable for landslide occurrence rate (Van Den Eeckhaut et al. Citation2006) and mostly used in the landslide studies (Reichenbach et al. Citation2018). It is one of the important factors as landslides generally occur on moderate to higher slopes due to downward gravitational effect on the sliding mass. The slope degree map was generated from DEM and divided into different classes using ‘Slope’ tool in GIS application ().
3.2.3. Focal flow
Focal flow, used to identify potential streams such as waterways and rivers (Park et al. Citation2016). The flow represents the ways water moves downward. The flow is determined by evaluating eight neighboring cells in raster image (DEM). It is one of the important factors in the identification and delineation of streams and direction of flows in the landslide study. Focal flow map of the study area was created from DEM using focal flow tools of the ArcGIS ().
3.2.4. Aspect
The aspect that is direction of the slope is one of the important factor in landslide occurrences which is related with the solar radiation and moisture condition (topographic wetness) (Chen and Chen Citation2021; Van Phong et al. Citation2020). Slope aspect of the study area was extracted from DEM and divided into nine classes: (1) flat, (2) north, (3) northeast, (4) east, (5) southeast, (6) south, (7) southwest, (8) west and (9) northwest using ‘Aspect’ tool of GIS application ().
3.2.5. Curvature
Curvature has been mostly employed in landslide research related to water flow (Mersha and Meten Citation2020; Ghasemian et al. Citation2020; Thanh et al. Citation2020). Curvature affects landslides because curvature can control the flow of water on the ground. Runoff is more on convex surface in comparison to concave surface where water accumulates more (Firth and Whitlow Citation1991). The curvature map was derived from the DEM map with different classes using ‘Curvature’ tool of GIS application ().
3.2.6. Fault density
Fault density determines the degree of rock weakness (Nampak et al. Citation2014), thus, it is important factor in the dislodging of the rock blocks from the surface causing landslides. The fault density variable parameter was created from the geological map using the ‘line density’ tool of ArcGIS ().
3.2.7. Rainfall
Rainfall is the most important factor in causing and triggering landslides (Yang and Adler Citation2008). Determination of amount and duration of the rains is essential in landslide studies. Intense rainfall can cause sudden landslides depending on the topographical and geological conditions of the ground/rock mass. Rainfall map was prepared into four classes from meteorological data of the catchment area of the dam (). Average annual cumulative rainfall data for the period 2016 − 2020 was used in the generation of rainfall map in this study. This data was obtained from 6 measuring stations located in and around the study area namely Nam Giang, Pa Tan stations (Lai Chau province), Nam He station (Dien Bien province), Quynh Nhai, Thac Vai; and Bo Sinh stations (Son La province). The mean sum of multi-annual rainfall is usually used in the landslide susceptibility studies (Chen et al. Citation2018a, Zhao et al. Citation2019).
3.2.8. River density
River density is related with fractures in tectonically disturbed areas and plays important role in the runoff and infiltration of water, and thus, in evaluating sliding stability of the area (Abedini et al. Citation2019a). River density map of the area was prepared after delineating river network and processing in GIS application using ‘density’ tool of Arc Hydrology extension ().
3.2.9. Weathering crust
Weathering crust is important in the landslide study as its nature and thickness affects the shallow landslides (Van Tu et al. Citation2016). Weathered rocks are easily eroded and vulnerable to sliding especially during rains. In this study, weathering crust map was extracted from the weathering crust map (1:100,000) of West-North map of Vietnam ().
3.2.10. Lithology
Lithology of rocks plays important role in landslide study (Segoni et al. Citation2020). Lithology represent general physical characteristics (colour, texture, grain size and mineral composition) of rocks. Weathering of rocks, porosity and permeability depends on the lithology of rock strata. Strength of rocks depends on the type of lithology besides other structural conditions. Therefore, lithology map of the study area was generated from the geology map (1:100,000) of the West North map of Vietnam for the model study ().
3.2.11. Aquifer
Water bearing permeable strata of rocks and sediments where pores are saturated with water is known as aquifer. It is important to identify aquifers in the study area. If they are located at shallow depth, they may cause heavy seepage and leakage through ground surface causing erosion of ground mass and generate pressure on slope faces, thus, can cause slope failure/landslides. In this study, aquifer map (1:100,000) of the study area was extracted from the geohydrological map of the study area ().
3.2.12. Road density
Road density is the ratio of length of road network to the area (study area). It is one of the important factors in landslide study (Nhu et al. Citation2020b). The area having high density of roads is more vulnerable to landslides as during the road construction surrounding groundmass get disturbed and creates instability of slopes. Road density map was generated from the available road maps of the area and Google Earth images ().
4. Methods used
4.1. Rough set
RS method was first introduced by Pawlak in the year 1982 (Pawlak Citation1982). It is a mathematical tool which deals with imprecise, inconsistent, incomplete information and knowledge. The RS method is now used in soft computing for data mining in many fields. RS theory helps in solving the uncertain problems. In this theory, two precise lines are established to describe the imprecise concepts. It has great potential for analogical logic modeling (Skowron and Dutta Citation2018). Regarding the subject of access of meanings over a world U1: we suppose that the concepts are perceived only through some subsets of U1, named samples. This is a generic estate in the ML, pattern recognition, or data mining ways (Zhang et al. Citation2016). It is thought to be an information system IS= (U, R) which is specified (where U⸦U1) and that for several C⸦U1 it is a complex ∏UC = C∩U. In this method, gain a decision system DTd= (U, R, d) where d(X)= 1 if x∏UC and d(x).
4.2. AdaBoost
Adaptive Boosting is an example of a group booster. In this system, various, classifiers are composed to achieve the highest exactitude for predicting a model. Based on the purpose of this method, it can be claimed that it is a duplication method, which means that in many duplications, it combines several weak classifications to create an intense and potent classifiers. AdaBoost's task is to regulate the weight of each class and the training data of the samples in each iteration. It should be noted that any ML algorithm can be used as a basic classification (Xiao et al. Citation2019). In other terms, to expand and improve ML learners and also to prevent the weakness of models in training examples, weak classes are repeated to combine and become a strong class so that errors are eliminated in each repetition and generate more emphasis strong class (Uyanık et al. Citation2020). For example, the forecast provided by AdaBoost is as follows (EquationEq. (1)(1)
(1) ) (Wan et al. Citation2013):
(1)
(1)
where, ‘F(x)=’ is the respective prognosis, ‘M=’ is the numeral of feeble classifications, the indication subordinate here is an affirmative or minus prognosis, fm(x) is a faint classifier that generates either positive or negative foresight, Cm is a ratio computed via learning weights.
4.3. Bagging
Bootstrap aggregating (Ba) is employed to enlarge inconsistency/instability extents as well as classification plots. Bagging has demonstrated by evidence or argument to be true or existing to be very sensitive to highlight the variations in training data that is contributory to boost the categorization precision of incipient intention tree classifier by decreasing variance of categorization wrong (Weber et al. Citation2020). The points to be made about the Ba algorithm note that the punctuality of the single ML algorithm is not high, so the principal ML algorithm is repeated several times to enhancement the prediction precision, as well as the final precision of the model using the results. The output of several models becomes final. Another advantage of this method is that it creates a strong classification (Yang et al. Citation2021).
4.4. Support vector machine
SVM is a most popular supervised ML algorithm since 1990 (Pisner and Schnyer Citation2020). SVM performs classification, regression and also outlier detection by drawing a straight line between two classes. SVM uses the kernel to magnify the flair spacing and quantify the homogeny of the two views (James et al. Citation2014). It detects the largest border amongst two classes in attribute, zone. A generic SVM model can be a 2*classes or poly*classes model (a syntax of a chain of 2*classes SVMm). The 2*classes SVM is the most usable used ML model (Tien Bui et al. Citation2012). In fact, it uses the origin of underestimating construct transgression.
SVM algorithms are segregated into two main categories: support vector machine classification model (SVMCM) and support vector machine regression model (SVMRM). Each of these two groups has unique characteristics. For example, SVMCM are handled to divide the data categories that are placed into diverse stages and SVMRM are operated to resolve forecasting problems, if the data are detached lineally. The equation is explained below (EquationEq. (2)(2)
(2) ):
(2)
(2)
Specimens can be preprocessed by moving specimens to a nonlinear space with high dimensions. This is the case when the data are not linearly severable. If a symmetric core of the Mercer equations is used in the low-dimensional input space, it can be considered the result of high-dimensional (relating to measurements) proliferation and considerably reduces the calculations (Burges Citation1998). In this case, the previous is changed to the next EquationEq. (3)(3)
(3) :
(3)
(3)
The k (xi, xj) subsidiary which is a single-core function, is used to create machines with various kinds of nonlinear decision lines in the internal *multiplication* data space ().
Table 1. Eqs. of diverse, kernel environs.
4.5. OneR feature selection
OneR (One Rule) is a classification algorithm which is simple and accurate. Rules are created for each predictor by constructing a frequency table against the target. One rule for each predictor is created and then rule with the smallest total error is selected as its ‘one rule’. OneR is an efficient selection method that specifies the statistical connection between an output variable and a set of selected input variables. OneR is generated separately for each component in the training data set. One-R classifies all variables according to their, significance in solving landslide prediction problems (Jain and Singh Citation2018).
In the present model study, a OneR feature selection technique is seen to pick out adequate affecting variables. Average merit (AM) generated from OneR is a criterion in variable selection that numeric distinguishes the emphasis and rating of variables. Thereafter, variables are precedence according to AM in descending arrangement.
4.6. Validation indicators
In this study, various statistical indicators including Positive Predictive Value (PPV), Negative Predictive Value (NPV), Susceptibility (SST), Specificity (SPF), Accuracy (ACC), Kappa, Area under the ROC Curve (AUC) and Root Mean Square Error (RMSE) were used to validate and compare the models. The mentioned criteria are counted on according to a stupefaction matrix that is used to classify the model output into attendance classes(≥cutoff) and non-existence classes (≥cutoff) according to a particular phenomenon, to a still (e.g. cutoff amount) (Naderpour and Mirrashid Citation2020). Out of these, the PPV mentions to the ratio of faultlessly classified landslide pixels out of all pixels categorized as landslide (LS) class whiles the NPV = is the ratio of pixels that were fittingly classified as non-landslide (NLS) class. The SST is the ratio of perfectly classified landslide pixels out all pixels that were fittingly classified as LS plus those wrongly classified as NLS. The SPF indicates the ratio of perfectly classified non-landslide pixels out of all pixels that were fittingly classified as NLS plus those wrongly classified as LS. The ACC = illustrates the overall proficiency of a predictive model and is computed as the ratio of landslide and non-landslide pixels that are rightly classified (Pham et al. Citation2018a). The RMSE metric was employed to appraise the discrepancy between apperceived/observed and guesstimated/estimated data (Costache et al. Citation2020; Nhu et al. Citation2020d). Kappa index (k) is a statistic/actuarial dial that extents the compromise between two assessors who every grade the whole numeral of landslide and non-landslide pixels into two monopolized/pre-emptive classes, LS and NLS, respectively (Costache et al. Citation2020). The ROC curve, is a graph according to the correct affirmative rate (sensitivity) and the wrong affirmative rate (1 − specificity), can be selected as the actuarial indicator of the totally efficiency of the algorithms (Cabrera and Lee Citation2019). In this article, the ROC curve will explain the ability of the algorithms to exactly forecast the incidence of the landslide history. The graphical delegation will be feasible via plotting the sensitivity on Y-axis versus the 1-specificity on X-axis. The nearby the amount of are under this curve (AUC) close to 1, indicates higher accuracy (Pallant Citation2013), the values of 0.5–0.6 show a negligible forecast algorithm, 0.6–0.7 fair, 0.7–0.8 good, 0.8–0.9 very good and >0.9 an excellent forecast algorithm (Hanley and McNeil Citation1982).
The formula for the evaluation indicators described above is given below (Eqs. (4)–(11)) (Costache et al. Citation2020; Wu et al. Citation2020):
(4)
(4)
(5)
(5)
(6)
(6)
(7)
(7)
(8)
(8)
(9)
(9)
(10)
(10)
(11)
(11)
where TP: True Positive, TN: True Negative, FP: False Positive and FN: False Negative. TP and TN are the numeral of landslide pixels that are accurately classified as, respectively, LS and NLS (Shirzadi et al. Citation2017). FP and FN are the numeral of non-landslide pixels that are wrongly classified as LS and NLS classes; Pa is the comparative perceived compromise amidst assessors and Pest is the assumptive possibility of luck compromise, XMODEL and XACT signify the modeled and factual worthiness, respectively, P is the total numeral of landslide pixels and N is the total numeral of non-landslide pixels.
5. Methodology
The main points of methodology of development of landslide susceptibility maps and evaluation of the models studied is presented below ():
Figure 4. Flowchart of the methodology used.
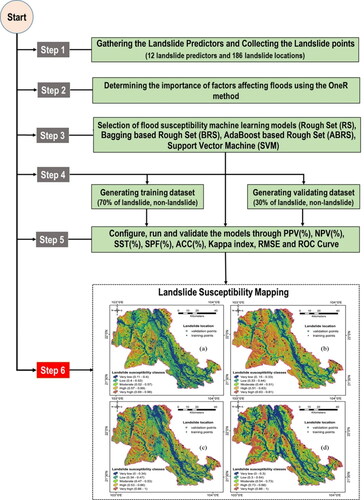
Selection of variables affecting the occurrence of landslides in the study area;
Identification and delineation of landslides (represented by points) in the study area;
Prioritization of landslide affecting factors (variables) using OneR feature selection method;
Out of the total landslide occurrence points, 70% were used for spatial modeling (ABRS, BRS, RS, SVM) and the remaining 30%, which were randomly selected, were used to evaluate and predict the accuracy of the models;
To compare the models and select the best performing model, various evaluation criteria: PPV, NPV, SPF, SST, ACC, Kappa, AUC and RMSE were used.
Computation of the landslide susceptibility maps using the hybrid and stand-alone machine learning models
6. Results and discussion
6.1. Variable selection using OneR method
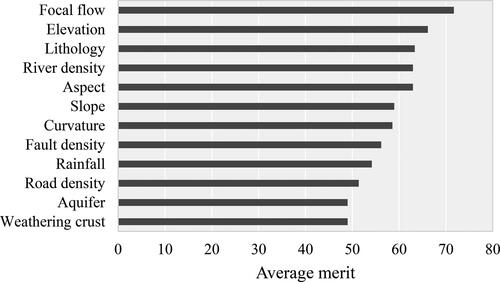
In the spatial forecasting modeling of landslide susceptibility, most important variables were selected and minor influencing variables were eliminated during the modeling process (Chen and Chen Citation2021). Ranking wise variables for the prediction of landslide susceptibility zones were presented in using OneR method. The results of the OneR selection show that the variables namely focal flow, elevation and lithology are three most important variables in the occurrence of landslide. The power to choose the most substantial variables is determined using the Average Merit (AM) (Wu et al. Citation2020). The AM is supported on a 10-fold cross-validation (Nhu et al. Citation2020d). Thus, the focal flow variable with a value of 71.71 is the most important in the occurrence of landslides of this area, followed by elevation and lithology variables with values of 66.14 and 63.35, respectively. In the study of Dai and Xu (Citation2013), elevation factor is also the most important factor affecting landslide occurrence. Depending on the geology, soil, topography, climate and land uses, landslide affecting factors may vary from region to region (Nasiri et al. Citation2019). It is important to note that most of the landslide affecting factors ranking in landslide occurrence depends on the local geo-environmental conditions. In this study, focal flow is the most important factor as this factor directly relate with the flow of the water and infiltration on the susceptible ground causing landslides where rainwater acted as triggering factor. This might be due to the fact that most of the landslides occur in this area during rainy season.
Figure 5. Ranking of the conditioning factors (variables) using OneR method.
6.2. Training and validation of the models
In this study, we have used two hybrid ML models (ABRS and BRS) and two single ML models (RS and SVM) for the development of landslide susceptibility maps. These models were trained on 70% data and validated on 30% data. In the hybrid models, the Bagging and AdaBoost were used to optimize the training dataset to train the base classifier of RS. It can be noticed that the performance of the models depends on the selection of the hyper-parameters used to train the models. In this study, we have selected the optimal values of the hyper-parameters of the models based on the trial error tests ().
Table 2. Hyper-parameters used in the models.
Validation of the models was done using various statistical indicators on both training and testing datasets ( and and ). In term of training dataset, the BRS has the highest values of PPV (89.23%) and SPF (85.71%) while the ABRS has the highest value of SST (82.09%), NPV (80.17%), ACC (82.47) and Kappa (0.65), the ABRS has the lowest value of RMSE (0.34) ( and ). With testing dataset, the BRS has the highest values of PPV (91.07%), SST (72.86%), SPF (88.10%), ACC (78.57%), Kappa (0.57) and the lowest value of RMSE (0.42) while SVM has the highest value of NPV (67.86%) ( and ).
Figure 6. Error of the models in training and validation phases.
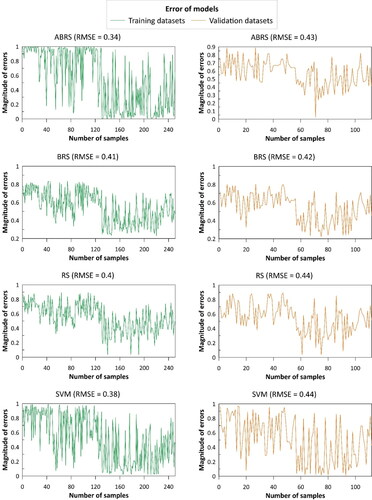
Figure 7. ROC curves and AUC values of the models: (a) training and (b) validation Phases.
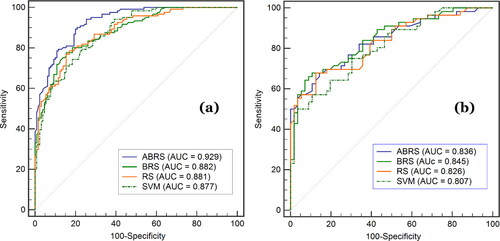
Table 3. Validation criteria of models.
Validation of ML algorithms using the ROC curve was also done as shown in . It can be observed that the ABRS has the highest value of the AUC (0.929) compared with other models namely BRS (0.882), RS (0.881), SVM (0.877) in term of training dataset while the BRS has the highest value of AUC (AUC= 0.845) compared with other models including ABRS (AUC= 0.836), RS (AUC= 0.826), SVM (AUC= 0.807) in term of testing dataset. In addition, the statistical significance of the differences between the models results was investigated through the Pair-wise comparison algorithm proposed by Hanley and McNeil (Citation1982). In this regard, the evaluation of statistical significance will assume the use of AUC values, the number of landslide and the number of non-landslide points. The main parameter which indicate the presence or absence of statiscal significant difference is p-value significance level. The statistical difference between 2 values will be indicated by a p-valuelower than .05 (Hanley and McNeil Citation1982). As can be observed in , the only statistical significants are the differences between AUC (success rate) of ABRS and the other three models.
Table 4. Statistical significance of the difference between AUC values.
From the results of this study, we can state that the use of optimization techniques like Bagging and AdaBoost can help in improving the performance of the base classifier like RS as the performance of both hybrid models ABRS and BRS is better than other two single models (RS and SVM) ( and and ). It is reasonable as these optimization techniques are able to produce the optimal training dataset for training the hybrid models using the RS as a base classifer. In this study, the BRS outperforms ABRS; therefore, the Bagging indicates as a better optimization technique than AdaBoost as this Bagging technique has several advantages such as (1) it can effectively void the instability of a classification algorithm by combining multiple base classifier; (2) It uses random sampling with replacement, which can generate multiple training datasets with the most useful information of the original training data; and (3) Using the Bagging, the multiple base classifiers are trained by the same classification algorithm, therefore, its process is not so complex (Sun et al. Citation2018). In addition, the results of this study is comparative with the published works which showed that the Bagging is more effective then AdaBoost in landslide susceptibility mapping (Bui et al. Citation2014, Citation2016).
In common, the use of statistical models during input, output and spatial analysis processes is time consuming, but ML algorithms have the advantage of spontaneously/automatically detecting relationships between afillated and autonomous variables (Yilmaz Citation2010). Many researchers around the world have used ML algorithms to landslide susceptibility map (Goetz et al. Citation2015; Pourghasemi and Rahmati Citation2018; Nam and Wang Citation2020). Howbeit, the predictive accuracy of some of these techniques is still questionable. Choosing the best model among different ML models plays a obligatory role in assessing landslide susceptibility (Javidan et al. Citation2019). Combined ML algorithms have the following advantages: (1) They automate the robotize procedures, (2) The researcher can browse several large databases and gather noteworthy awareness, (3) Instead of being confined to one classification, they duplicate a large number of classifications while randomly changing the input data, (4) Individual models can be composed into one, creating a more consistent rule or prediction scheme, compatibility with different parameters, for example different environmental conditions, is usually desired to support planning intentions, particularly in large areas with assembled lithology, topography and climate (Camilo et al. Citation2017).
6.3. Preparation of landslide susceptibility maps
Landslide susceptibility maps were prepared using ABRS, BRS, RS, SVM models. In this study, we have natural break way (NBw) method to classify landslide susceptibility indices of all pixels of the study area generated during the training of the models (Zhou et al. Citation2018; Nhu et al. Citation2020d; Wang et al. Citation2020; Youssef and Pourghasemi Citation2020). The output maps obtained from the ML algorithms were classified into five categories: very low, low, moderate, high and very high susceptibility classes ().
Figure 8. Landslide susceptibility maps produced ((a) ABRS, (b) BRS, (c) RS, (d) SVM).
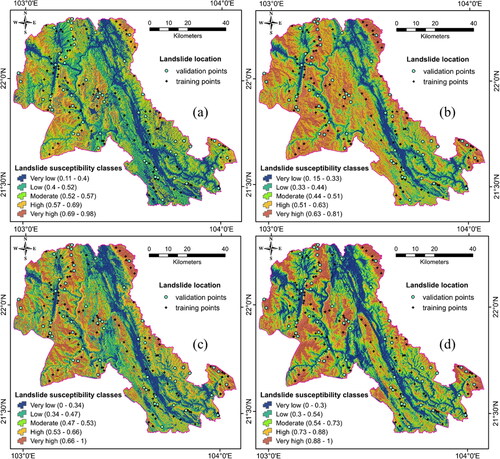
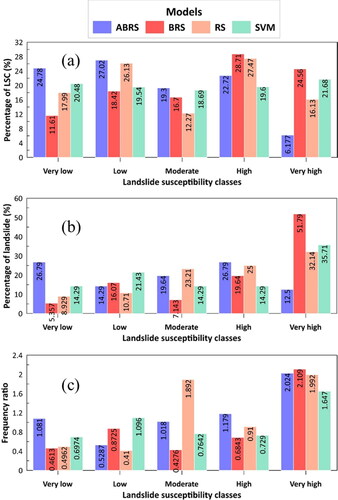
shows the results of frequency distribution analysis of landslide susceptibility classes on the maps of ABRS, BRS, RS, SVM models. It can be seen that the highest percentage of landslide susceptibility area in high and very high classes using ABRS algorithms are 22.72%, 6.177%, respectively, using BRS (28.71% and 24.56%), RS (27.47% and 16.13%) and SVM (19.6% and 21.68%). In addition, the outcomes of the third graph from show that the Frequency Ratio (FR) of landslides in the study area according to the four algorithms are ABRS= 2.024, BRS= 2.109, RS= 1.992, SVM= 1.647, the highest value is for the BRS model, which indicates that the map generated by the BRS model is better than the maps of other models (ABRS, RS and SVM).
Figure 9. Frequency distribution of landslides within susceptibility classes: (a) landslide susceptibility class (LSC) percentage; (b) percentage of landslides; (c) Frequency ratio.
7. Concluding remarks
In this study, the main objective is to develop novel hybrid ML models (BRS and ABRS) and evaluate performance of these models for accurate landslide susceptibility mapping of the Son La hydropower reservoir basin, Vietnam. OneR method was used to select and rank the considered landslide affecting factors (slope degree, slope aspect, elevation, curvature, focal flow, river density, rainfall, aquifer, weathering crust, lithology, fault density and road density) for the development of landslide susceptibility maps. Results show that focal flow factor had the greatest impact on the occurrence of landslides followed by elevation and lithology. Accuracy of maps was evaluated using several statistical measures: PPV, NPV, SPF, SST, ACC, Kappa, AUC-ROC curve method. Statistical analysis of the model performance shows that performance of the developed novel hybrid model BRC is the best (AUC = 0.845) in accurate mapping of landslide susceptibility in the study area. Therefore, this developed BRS model can be used in other areas also for the generation of accurate landslide susceptibility maps using local geo-environment conditions in other landslide prone areas.
Acknowledgment
We thank the support from the project “geological hazards assessment of Dien Bien - Lai Chau fault zone base on application machine learning, artificial intelligence”, VAST05.05/20-21.
Data availability statement
The data that support the findings of this study are available on request from the authors.
Disclosure statement
No potential conflict of interest was reported by the authors.
Additional information
Funding
References
- Abedini M, Ghasemian B, Shirzadi A, Bui D. 2019a. A comparative study of support vector machine and logistic model tree classifiers for shallow landslide susceptibility modeling. Environ Earth Sci. 78:1–15.
- Abedini M, Ghasemian B, Shirzadi A, Shahabi H, Chapi K, Pham BT, Bin Ahmad B, Tien Bui D. 2019b. A novel hybrid approach of Bayesian Logistic Regression and its ensembles for landslide susceptibility assessment. Geocarto Int. 34(13):1427–1457.
- Aditian A, Kubota T, Shinohara Y. 2018. Comparison of GIS-based landslide susceptibility models using frequency ratio, logistic regression, and artificial neural network in a tertiary region of Ambon, Indonesia. Geomorphology. 318:101–111.
- Bui DT, Ho T-C, Pradhan B, Pham B-T, Nhu V-H, Revhaug I. 2016. GIS-based modeling of rainfall-induced landslides using data mining-based functional trees classifier with AdaBoost, Bagging, and MultiBoost ensemble frameworks. Environ Earth Sci. 75:1–22.
- Bui DT, Ho TC, Revhaug I, Pradhan B, Nguyen DB. 2014. Landslide susceptibility mapping along the national road 32 of Vietnam using GIS-based J48 decision tree classifier and its ensembles. In: Cartography from pole to pole. (pp. 303–317). Springer, Berlin, Heidelberg. Germany.
- Burges CJC. 1998. A tutorial on support vector machines for pattern recognition. Data Min Knowl Discov. 2(2):121–167.
- Cabrera JS, Lee HS. 2019. Flood-prone area assessment using GIS-based multi-criteria analysis: a case study in Davao Oriental, Philippines. Water. 11:2203.
- Camilo DC, Lombardo L, Mai PM, Dou J, Huser R. 2017. Handling high predictor dimensionality in slope-unit-based landslide susceptibility models through LASSO-penalized Generalized Linear Model. Environ Modell Softw. 97:145–156.
- Chapi K, Singh VP, Shirzadi A, Shahabi H, Bui DT, Pham BT, Khosravi K. 2017. A novel hybrid artificial intelligence approach for flood susceptibility assessment. Environ Modell Softw. 95:229–245.
- Chen W, Fan L, Li C, Pham BT. 2019a. Spatial prediction of landslides using hybrid integration of artificial intelligence algorithms with frequency ratio and index of entropy in Nanzheng County, China. Appl Sci. 10(1):29.
- Chen W, Hong H, Panahi M, Shahabi H, Wang Y, Shirzadi A, Pirasteh S, Alesheikh AA, Khosravi K, Panahi S, et al. 2019b. Spatial prediction of landslide susceptibility using GIS-based data mining techniques of ANFIS with Whale Optimization Algorithm (WOA) and Grey Wolf Optimizer (GWO). Appl Sci. 9(18):3755.
- Chen W, Peng J, Hong H, Shahabi H, Pradhan B, Liu J, Zhu A-X, Pei X, Duan Z. 2018a. Landslide susceptibility modelling using GIS-based machine learning techniques for Chongren County, Jiangxi Province, China. Sci Total Environ. 626:1121–1135.
- Chen W, Shirzadi A, Shahabi H, Ahmad BB, Zhang S, Hong H, Zhang N. 2017. A novel hybrid artificial intelligence approach based on the rotation forest ensemble and naïve Bayes tree classifiers for a landslide susceptibility assessment in Langao County, China. Geomatics Nat Hazards Risk. 8(2):1955–1977.
- Chen W, Xie X, Peng J, Shahabi H, Hong H, Bui DT, Duan Z, Li S, Zhu AX. 2018b. GIS-based landslide susceptibility evaluation using a novel hybrid integration approach of bivariate statistical based random forest method. CATENA. 164:135–149.
- Chen X, Chen W. 2021. GIS-based landslide susceptibility assessment using optimized hybrid machine learning methods. CATENA. 196:104833.
- Costache R, Popa MC, Tien Bui D, Diaconu DC, Ciubotaru N, Minea G, Pham QB. 2020. Spatial predicting of flood potential areas using novel hybridizations of fuzzy decision-making, bivariate statistics, and machine learning. J Hydrol. 585:124808.
- Dahal RK, Hasegawa S, Nonomura A, Yamanaka M, Dhakal S, Paudyal P. 2008. Predictive modelling of rainfall-induced landslide hazard in the Lesser Himalaya of Nepal based on weights-of-evidence. Geomorphology. 102(3–4):496–510.
- Dai J, Xu Q. 2013. Attribute selection based on information gain ratio in fuzzy rough set theory with application to tumor classification. Appl Soft Comput. 13(1):211–221.
- Dao DV, Jaafari A, Bayat M, Mafi-Gholami D, Qi C, Moayedi H, Phong TV, Ly H-B, Le T-T, Trinh PT, et al. 2020. A spatially explicit deep learning neural network model for the prediction of landslide susceptibility. CATENA. 188:104451.
- Dou J, Yunus AP, Tien Bui D, Sahana M, Chen C-W, Zhu Z, Wang W, Thai Pham B. 2019. Evaluating GIS-based multiple statistical models and data mining for earthquake and rainfall-induced landslide susceptibility using the LiDAR DEM. Remote Sens. 11(6):638.
- Ercanoglu M, Gokceoglu C. 2004. Use of fuzzy relations to produce landslide susceptibility map of a landslide prone area (West Black Sea Region, Turkey. Eng Geol. 75(3–4):229–250.
- Fang Z, Wang Y, Duan G, Peng L. 2021. Landslide susceptibility mapping using rotation forest ensemble technique with different decision trees in the Three Gorges Reservoir area, China. Remote Sens. 13(2):238.
- Firth CR, Whitlow R. 1991. Patterns of gullying in Zimbabwe. GeoJournal. 23(1):59–67.
- Galli M, Ardizzone F, Cardinali M, Guzzetti F, Reichenbach P. 2008. Comparing landslide inventory maps. Geomorphology. 94(3–4):268–289.
- Ghasemian B, Asl DT, Pham BT, Avand M, Nguyen HD, Janizadeh S. 2020. Shallow landslide susceptibility mapping: A comparison between classification and regression tree and reduced error pruning tree algorithms. Vietnam Journal of Earth Sciences. 42:208–227.
- Ghorbanzadeh O, Meena SR, Blaschke T, Aryal J. 2019. UAV-based slope failure detection using deep-learning convolutional neural networks. Remote Sens. 11(17):2046.
- Goetz JN, Brenning A, Petschko H, Leopold P. 2015. Evaluating machine learning and statistical prediction techniques for landslide susceptibility modeling. Comput Geosci. 81:1–11.
- Guzzetti F, Mondini AC, Cardinali M, Fiorucci F, Santangelo M, Chang K-T. 2012. Landslide inventory maps: new tools for an old problem. Earth Sci Rev. 112(1–2):42–66.
- Hanley JA, McNeil BJ. 1982. The meaning and use of the area under a receiver operating characteristic (ROC) curve. Radiology. 143(1):29–36.
- He S, Ouyang C, Luo Y. 2012. Seismic stability analysis of soil nail reinforced slope using kinematic approach of limit analysis. Environ Earth Sci. 66(1):319–326.
- Hong H, Liu J, Zhu A-X. 2020. Modeling landslide susceptibility using LogitBoost alternating decision trees and forest by penalizing attributes with the bagging ensemble. Sci Total Environ. 718:137231.
- Hussin HY, Zumpano V, Reichenbach P, Sterlacchini S, Micu M, van Westen C, Bălteanu D. 2016. Different landslide sampling strategies in a grid-based bi-variate statistical susceptibility model. Geomorphology. 253:508–523.
- Jaafari A. 2018. LiDAR-supported prediction of slope failures using an integrated ensemble weights-of-evidence and analytical hierarchy process. Environ Earth Sci. 77(2):42.
- Jain D, Singh V. 2018. Feature selection and classification systems for chronic disease prediction: a review. Egypt Inform J. 19(3):179–189.
- James G, Witten D, Hastie T, Tibshirani R. 2014. An introduction to statistical learning: with applications in R. Springer Publishing Company, Incorporated.
- Javidan N, Kavian A, Pourghasemi HR, Conoscenti C, Jafarian Z. 2019. Gully erosion susceptibility mapping using multivariate adaptive regression splines—replications and sample size scenarios. Water. 11:2319.
- Liu H, Wu Y, Cao Y, Lv W, Han H, Li Z, Chang J. 2020. Well logging based lithology identification model establishment under data drift: a transfer learning method. Sensors (Basel). 20(13):3643.
- Lombardo L, Opitz T, Ardizzone F, Guzzetti F, Huser R. 2020. Space-time landslide predictive modelling. Earth Sci Rev. 209:103318.
- Mersha T, Meten M. 2020. GIS-based landslide susceptibility mapping and assessment using bivariate statistical methods in Simada area, northwestern Ethiopia. Geoenviron Disasters. 7(1):20.
- Mohammady M, Pourghasemi HR, Pradhan B. 2012. Landslide susceptibility mapping at Golestan Province, Iran: a comparison between frequency ratio, Dempster–Shafer, and weights-of-evidence models. J Asian Earth Sci. 61:221–236.
- Moosavi V, Niazi Y. 2016. Development of hybrid wavelet packet-statistical models (WP-SM) for landslide susceptibility mapping. Landslides. 13(1):97–114.
- Naderpour H, Mirrashid M. 2020. Bio-inspired predictive models for shear strength of reinforced concrete beams having steel stirrups. Soft Comput. 24(16):12587–12597.
- Nam K, Wang F. 2020. An extreme rainfall-induced landslide susceptibility assessment using autoencoder combined with random forest in Shimane Prefecture, Japan. Geoenviron Disasters. 7(1):6.
- Nampak H, Pradhan B, Manap MA. 2014. Application of GIS based data driven evidential belief function model to predict groundwater potential zonation. J Hydrol. 513:283–300.
- Nasiri V, Darvishsefat AA, Rafiee R, Shirvany A, Hemat MA. 2019. Land use change modeling through an integrated Multi-Layer Perceptron Neural Network and Markov Chain analysis (case study: Arasbaran region, Iran). J Res. 30(3):943–957.
- Nhu V-H, Janizadeh S, Avand M, Chen W, Farzin M, Omidvar E, Shirzadi A, Shahabi HJ, Clague J, Jaafari A, et al. 2020a. GIS-based gully erosion susceptibility mapping: a comparison of computational ensemble data mining models. Appl Sci. 10(6):2039.
- Nhu V-H, Mohammadi A, Shahabi H, Ahmad BB, Al-Ansari N, Shirzadi A, Geertsema M, R, Kress V, Karimzadeh S, Valizadeh Kamran KJF. 2020b. Landslide detection and susceptibility modeling on Cameron Highlands (Malaysia): a comparison between random forest, logistic regression and logistic model tree algorithms. Forests. 11:830.
- Nhu V-H, Rahmati O, Falah F, Shojaei S, Al-Ansari N, Shahabi H, Shirzadi A, Górski K, Nguyen H, Ahmad BB. 2020c. Mapping of groundwater spring potential in karst aquifer system using novel ensemble bivariate and multivariate models. Water. 12(4):985.
- Nhu V-H, Shirzadi A, Shahabi H, Singh SK, Al-Ansari N, Clague JJ, Jaafari A, Chen W, Miraki S, Dou J, et al. 2020d. Shallow landslide susceptibility mapping: a comparison between logistic model tree, logistic regression, naïve bayes tree, artificial neural network, and support vector machine algorithms. IJERPH. 17(8):2749.
- Pallant J. 2013. SPSS survival manual: a step by step guide to data analysis using IBM SPSS Maidenhead. Berkshire, England; New York, NY: McGraw Hill.
- Park DW, Lee SR, Vasu NN, Kang SH, Park JY. 2016. Coupled model for simulation of landslides and debris flows at local scale. Nat Hazards. 81(3):1653–1682.
- Pawlak Z. 1982. Rough sets. Int J Comput Inform Sci. 11(5):341–356.
- Pham BT, Jaafari A, Prakash I, Bui DT. 2019. A novel hybrid intelligent model of support vector machines and the MultiBoost ensemble for landslide susceptibility modeling. Bull Eng Geol Environ. 78(4):2865–2886.
- Pham BT, Phong TV, Nguyen-Thoi T, Parial K, K, Singh S, Ly H-B, Nguyen KT, Ho LS, Le HV, Prakash I. 2020. Ensemble modeling of landslide susceptibility using random subspace learner and different decision tree classifiers. Geocarto Int. 1–23.
- Pham BT, Prakash I, Jaafari A, Bui DT. 2018a. Spatial prediction of rainfall-induced landslides using aggregating one-dependence estimators classifier. J Indian Soc Remote Sens. 46(9):1457–1470.
- Pham BT, Prakash I, Tien Bui D. 2018b. Spatial prediction of landslides using a hybrid machine learning approach based on Random Subspace and Classification and Regression Trees. Geomorphology. 303:256–270.
- Pisner DA, Schnyer DM. 2020. Support vector machine. In: Machine learning. Academic Press. London, United Kingdom; p. 101–121.
- Pourghasemi HR, Rahmati O. 2018. Prediction of the landslide susceptibility: which algorithm which Precision? CATENA. 162:177–192.
- Pradhan B. 2013. A comparative study on the predictive ability of the decision tree, support vector machine and neuro-fuzzy models in landslide susceptibility mapping using GIS. Comput Geosci. 51:350–365.
- Reichenbach P, Rossi M, Malamud BD, Mihir M, Guzzetti F. 2018. A review of statistically-based landslide susceptibility models. Earth Sci Rev. 180:60–91.
- Rossi M, Guzzetti F, Salvati P, Donnini M, Napolitano E, Bianchi C. 2019. A predictive model of societal landslide risk in Italy. Earth Sci Rev. 196:102849.
- Sahin EK, Colkesen I, Kavzoglu TJGI. 2020. A comparative assessment of canonical correlation forest, random forest, rotation forest and logistic regression methods for landslide susceptibility mapping. Geocarto Int. 35(4):341–363.
- Segoni S, Pappafico G, Luti T, Catani FJL. 2020. Landslide susceptibility assessment in complex geological settings: sensitivity to geological information and insights on its parameterization. Landslides. 17:2443–2453.
- Shirzadi A, Bui DT, Pham BT, Solaimani K, Chapi K, Kavian A, Shahabi H, Revhaug I. 2017. Shallow landslide susceptibility assessment using a novel hybrid intelligence approach. Environ Earth Sci. 76(2):60.
- Skowron A, Dutta S. 2018. Rough sets: past, present, and future. Nat Comput. 17(4):855–876.
- Sun J, Lang J, Fujita H, Li HJIS. 2018. Imbalanced enterprise credit evaluation with DTE-SBD: decision tree ensemble based on SMOTE and bagging with differentiated sampling rates. Inf Sci. 425:76–91.
- Tacconi Stefanelli C, Casagli N, Catani F. 2020. Landslide damming hazard susceptibility maps: a new GIS-based procedure for risk management. Landslides. 17(7):1635–1648.
- Tavakkoli Piralilou S, Shahabi H, Jarihani B, Ghorbanzadeh O, Blaschke T, Gholamnia K, Meena SR, Aryal J. 2019. Landslide detection using multi-scale image segmentation and different machine learning models in the higher Himalayas. Remote Sens. 11(21):2575.
- Thanh DQ, Nguyen DH, Prakash I, Jaafari A, Nguyen V-T, Van Phong T, Pham BT. 2020. GIS based frequency ratio method for landslide susceptibility mapping at Da Lat City, Lam Dong province, Vietnam. Vietnam J Earth Sci. 42:55–56.
- Tien Bui D, Pradhan B, Lofman O, Revhaug I. 2012. Landslide susceptibility assessment in Vietnam using support vector machines, decision tree, and naïve bayes models. Math Prob Eng. 2012:1–26.
- Tien Bui D, Shahabi H, Shirzadi A, Chapi K, Pradhan B, Chen W, Khosravi K, Panahi M, Bin Ahmad B, Saro L. 2018. Land subsidence susceptibility mapping in South Korea using machine learning algorithms. Sensors. 18(8):2464.
- Tien Bui D, Shirzadi A, Shahabi H, Geertsema M, Omidvar E, Clague JJ, Thai Pham B, Dou J, Talebpour Asl D, Bin Ahmad B, et al. 2019. New ensemble models for shallow landslide susceptibility modeling in a semi-arid watershed. Forests. 10(9):743.
- Tien Bui D, Tuan TA, Klempe H, Pradhan B, Revhaug I. 2016. Spatial prediction models for shallow landslide hazards: a comparative assessment of the efficacy of support vector machines, artificial neural networks, kernel logistic regression, and logistic model tree. Landslides. 13(2):361–378.
- Tsangaratos P, Ilia I. 2016. Comparison of a logistic regression and Naïve Bayes classifier in landslide susceptibility assessments: the influence of models complexity and training dataset size. CATENA. 145:164–179.
- Uyanık T, Karatuğ Ç, Arslanoğlu Y. 2020. Machine learning approach to ship fuel consumption: a case of container vessel. Transp Res D: Transp Environ. 84:102389.
- Van Tu T, Duc DM, Tung NM, Cong VD. 2016. Preliminary assessments of debris flow hazard in relation to geological environment changes in mountainous regions, North Vietnam. Vietnam Journal of Earth Sciences. 38:277–286.
- Van Den Eeckhaut M, Vanwalleghem T, Poesen J, Govers G, Verstraeten G, Vandekerckhove L. 2006. Prediction of landslide susceptibility using rare events logistic regression: a case-study in the Flemish Ardennes (Belgium). Geomorphology. 76(3–4):392–410.
- Wan L, Tang K, Wang R. 2013. Gradient boosting-based negative correlation learning. In: International Conference on Intelligent Data Engineering and Automated Learning (pp. 358–365). Springer, Berlin, Heidelberg. Germany.
- Wang G, Lei X, Chen W, Shahabi H, Shirzadi A. 2020. Hybrid computational intelligence methods for landslide susceptibility mapping. Symmetry. 12(3):325.
- Wang Y, Hong H, Chen W, Li S, Panahi M, Khosravi K, Shirzadi A, Shahabi H, Panahi S, Costache R. 2019. Flood susceptibility mapping in Dingnan County (China) using adaptive neuro-fuzzy inference system with biogeography based optimization and imperialistic competitive algorithm. J Environ Manage. 247:712–729.
- Weber VAM, Weber F. d L, Oliveira A. d S, Astolfi G, Menezes GV, de Andrade Porto JV, Rezende FPC, Moraes P. H d, Matsubara ET, Mateus RG, et al. 2020. Cattle weight estimation using active contour models and regression trees Bagging. Comput Electron Agric. 179:105804.
- Wu Y, Ke Y, Chen Z, Liang S, Zhao H, Hong H. 2020. Application of alternating decision tree with AdaBoost and bagging ensembles for landslide susceptibility mapping. CATENA. 187:104396.
- Xiao C, Chen N, Hu C, Wang K, Gong J, Chen Z. 2019. Short and mid-term sea surface temperature prediction using time-series satellite data and LSTM-AdaBoost combination approach. Remote Sens Environ. 233:111358.
- Yan F, Zhang Q, Ye S, Ren B. 2019. A novel hybrid approach for landslide susceptibility mapping integrating analytical hierarchy process and normalized frequency ratio methods with the cloud model. Geomorphology. 327:170–187.
- Yang M, Zhang J, Lu H, Jin J. 2021. Regularized ELM bagging model for Tropical Cyclone Tracks prediction in South China Sea. Cognitive Systems Research. 65:50–59.
- Yang H, Adler R. 2008. Predicting global landslide spatiotemporal distribution: integrating landslide susceptibility zoning techniques and real-time satellite rainfall estimates. Int J Sediment Res. 23(3):249–257.
- Yang M, Zhang J, Hong L, Jin J. 2020. Regularized ELM bagging model for tropical cyclone tracks prediction in South China Sea. Cognit Syst Res.
- Yilmaz I. 2010. Comparison of landslide susceptibility mapping methodologies for Koyulhisar, Turkey: conditional probability, logistic regression, artificial neural networks, and support vector machine. Environ Earth Sci. 61(4):821–836.
- Youssef AM, Pourghasemi HR. 2020. Landslide susceptibility mapping using machine learning algorithms and comparison of their performance at Abha Basin. Asir Region, Saudi Arabia: Geoscience Frontiers.
- Zare M, Pourghasemi HR, Vafakhah M, Pradhan B. 2013. Landslide susceptibility mapping at Vaz Watershed (Iran) using an artificial neural network model: a comparison between multilayer perceptron (MLP) and radial basic function (RBF) algorithms. Arab J Geosci. 6(8):2873–2888.
- Zhang Q, Xie Q, Wang G. 2016. A survey on rough set theory and its applications. CAAI Trans Intell Technol. 1(4):323–333.
- Zhang T, Han L, Chen W, Shahabi H. 2018. Hybrid integration approach of entropy with logistic regression and support vector machine for landslide susceptibility modeling. Entropy. 20(11):884.
- Zhao Y, Wang R, Jiang Y, Liu H, Wei ZJEG. 2019. GIS-based logistic regression for rainfall-induced landslide susceptibility mapping under different grid sizes in Yueqing, Southeastern China. Eng Geol. 259:105147.
- Zhou C, Yin K, Cao Y, Ahmed B, Li Y, Catani F, Pourghasemi HR. 2018. Landslide susceptibility modeling applying machine learning methods: a case study from Longju in the Three Gorges Reservoir area, China. Comput Geosci. 112:23–37.