
 ?Mathematical formulae have been encoded as MathML and are displayed in this HTML version using MathJax in order to improve their display. Uncheck the box to turn MathJax off. This feature requires Javascript. Click on a formula to zoom.
Abstract
In the Republic of Korea (ROK), photovoltaic power stations (PPSs) are typically installed in mountainous areas because of the low levelized cost of electricity values. However, intensified precipitation due to climate change has increased landslide occurrence, threatening PPSs installed in mountainous areas. Previous studies have focussed on the possibility of landslide occurrence considering specific years, which could not generate general landslide susceptibility areas (LSAs). Therefore, this study aimed to analyze the general LSAs and compare it with PPS-installed areas to identify the potential landslide damages to the PPSs. Gangwon-do was selected as the study site and maximum entropy model was used to evaluate LSAs in multiple target years (2006, 2013, 2019, and 2020). The results showed that 3.2–10.6% of PPSs are located in LSAs during 2013–2020. Considering the government PPS installation regulations, 45% of installable areas were identified as LSAs, suggesting that new criteria are required for future PPS installation. We propose that PPS installation should be prohibited in very shallow soil, very deep soil area, areas with good drainage capacity, a slope between 10 and 30°, north aspect, and coniferous forest area. Our results can help in improving the regulatory plans and prevent reckless development of PPSs in susceptible regions.
1. Introduction
Globally, efforts to mitigate climate change are intensifying, with many countries adopting the objective of attaining net-zero emissions (Darby and Gerretsen Citation2021). Consequently, research and investment in eco-friendly energy sources are increasing worldwide (Koutra et al. Citation2018; Harkouss et al. Citation2019; Kim et al. Citation2019). As the government of Republic of Korea (ROK) is implementing a policy of reducing nuclear power generation, photovoltaic power generation has expanded more rapidly in the last decade.
However, photovoltaic power stations (PPSs) in mountainous areas in ROK have been increasingly facing landslide damages. To promote the installation of efficient PPS, the levelized cost of electricity (LCOE) is used as an important basis. The LCOE represents the average net cost of power generation over the lifetime of a power plant (Adewuyi et al. Citation2019). In the ROK, PPSs are often installed in mountainous areas because of the associated low LCOE values. Such installations involve cutting through rocks in mountainous areas, increasing the landslide susceptibility (LS) of PPSs in the ROK (Choi Citation2020). Among the 52 PPSs in the ROK that were damaged in the summer (July–September) of 2020, 20 are in mountainous areas (Kim Citation2020). Meanwhile, owing to global climate change, extreme rainfall is intensifying in many places (Fowler et al. Citation2021). The total precipitation during the rainy season in the ROK has shown an increasing trend since 1973 (Korea Meteorological Administration 2021). According to climate scenario models, the total precipitation during the rainy season will continue to increase until at least 2100 in East Asia (Knutti and Sedláček Citation2012). Several studies reported correlations between future LS and increasing rainfall (Kim et al. Citation2015; Wood et al. Citation2015; Ciabatta et al. Citation2016; Ciervo et al. 2017). Therefore, further research is needed to prevent landslide damage to the PPS area.
In the existing PPS suitable area analysis, studies were primarily conducted to determine the potential of photovoltaic light. Rediske et al. (Citation2019), for example, reported socio-environmental, geographical, economic, political, climate, and orographic factors as the principal considerations in selecting a suitable PPS location. Photovoltaic power generation depends on the solar irradiance, particularly the downward surface shortwave radiation (Jerez et al. Citation2015), with the changes in temperature and relative humidity affecting the PPS performance (Bonkaney et al. Citation2017). Therefore, in a few studies, predicted future irradiance has been employed to quantify the impact of climate change on the corresponding solar energy resource potential (Gunderson et al. Citation2015; Pérez et al. Citation2019; Yun et al. Citation2019). In other studies, snowfall is used as an alternative climate variable that can reduce the solar energy potential (Andrews et al. Citation2013). Despite the continuous increase in the number of PPSs installed in the mountainous areas, there have been no studies considering the susceptibility of landslides. However, a disaster such as landslide can completely reduce the solar potential, together with additional damage. Therefore, evaluating the susceptibility of landslides for selecting PPS installable areas is necessary.
Predicting the probability of landslide occurrence based on the scale of study site. The scale of landslide research is generally divided into various types for each study object (Corominas et al. Citation2014): national (<1:250,000), regional (1:250,000–1:25,000), local (1:25,000–1:5,000), and site-specific (>1:5,000). To evaluate landslide hazards and risk, information such as landslide type (potential or existing), characteristics of the landslides (magnitude), and characteristics of the exposed elements (e.g., linear infrastructures and urbanized areas) is required (Leroi et al. Citation2005). As these detailed data are required, landslide hazards and risks are performed on the local (1:25,000–1:5,000) and site-specific (>1:5,000) scales. On the other hand, analyzing on the regional (1:250,000–1:25,000) and local (1:25,000–1:5,000) scales supports decision-making and land-use planning from a more macro perspective. Therefore, this study focuses on analyzing the overall landslide susceptibility of the PPS installation area in Gangwon-do and improving regulations based on the result, rather than predicting the damage caused by landslides to individual facilities in detail. Therefore, LS analysis was selected as a more efficient and appropriate methodology.
Most of the previous studies on LS have focussed on a specific year (Yang, Chun, et al. Citation2007; Yang, Park, et al. Citation2007; Kim et al. Citation2012; Hong et al. Citation2016). However, when focussing only on a specific year, a landslide susceptible area (LSA) is analyzed considering the rainfall pattern of a specific year. Except for landslides caused by earthquakes, in some countries such as China and Italy (Keefer Citation2000; Yin et al. Citation2009), most landslides are caused by rainfall (Segoni et al. Citation2018). As the spatial pattern of rainfall is affected not only by the topography (Park et al. Citation2008) but also by the typhoon path, the distribution may change every year. When only the rainfall pattern of a specific year is considered, the LS assessment result has a specificity due to rainfall. In particular, when we evaluate installable area for facilities such as PPSs, it is necessary to identify general susceptible areas, and not those that are susceptible in a specific period (Sevgen et al. Citation2019).
Some previous studies have evaluated LS using long-term rainfall parameters. In China's Jiangxi Province, LS was verified using annual average rainfall of more than 50 years and based on information on landslide that occurred in 2016 (Chen et al. Citation2018). In the Gandaki region of Nepal, long-term averaged WorldClim data were used (Poudel et al. Citation2020). However, most of the landslides analyzed in these studies were primarily due to torrential rains. Therefore, when accurate rainfall data at the time of landslide occurrence are not used, the variability due to annually changing rainfall cannot be evaluated.
Analyzing LS across multiple years is generally difficult because it requires considerable time and cost to establish reliable data. To establish information on the occurrence point of a landslide, it is necessary to conduct a field survey on all occurrence points immediately after the landslide, or to analyze satellite images before and after the landslide (Oh et al. Citation2009; Yoo et al. Citation2009). Therefore, it is difficult to construct data for various years for a large area (regional and national scale).
To overcome these data constraints, the Korea Forest Service and the National Emergency Management, which are Korean government agencies, conduct an annual survey of the landslide locations for restoring landslide damage. In addition, information on landslide locations is being derived based on satellite images particularly for areas inside forests, where rapid restoration work cannot be performed due to inaccessibility. These organizations identify areas that require emergency restoration, vegetation restoration, and construction of debris barrier to prevent additional landslide damage. Korean government is spending enormous budgets on the restoration of landslide damage and data construction on the point of landslide occurrence (Korea Forest Service Citation2020a). Therefore, this study utilized the reliable landslide occurrence location database continuously established by the Korean government agencies through information disclosure system to conduct multiple year analysis, which enabled us to discover the general LSAs.
In general, when analyzing LS using a spatial distribution model, a non-occurrence point is artificially created using a methodology such as pseudo absence (Thuiller et al. Citation2009). As this method of generating non-occurrence points has high uncertainty, the reliability of the model is limited. When evaluating the LS using Maxent, there is an advantage in evaluating the LS considering various years because it is possible to predict the probability of a landslide using only the occurrence point data (Lombardo et al. Citation2016). However, it is difficult to establish reliable non-occurrence point information for past landslides. Therefore, Maxent is a more suitable model for conducting research considering various years. Since its development in the early 2000s, Maxent has been continuously used in research and evaluated as a model with high reliability (Napoli et al. Citation2021; Novellino et al. Citation2021).
Thus, this study aimed to assess general LSAs and installable area for PPSs in Gangwon-do, where the most mountainous areas are distributed in ROK and a lot of damage from landslides occurs. This study addresses that whether the regulations currently being proposed by the government of ROK and local governments can prevent PPSs from landslide damage. The detailed research objectives of the study included the following. First, identifying general characteristics of LSAs derived through LS analysis for multiple target years. Second, confirming whether the existing PPSs are in an area with high susceptibility to landslides. Third, confirming the LSAs in PPS installable areas based on the regulations of ROK and local governments for PPSs. The present results can show the LS on the current PPS locations. Furthermore, it can help in reducing landslide damage by proposing a regulatory improvement plan for selecting a proper site for PPSs. In particular, many PPSs are expected to be installed in the future to reduce climate change, and thus, reckless development of PPSs in regions of large forest areas such as East Asia or European Union can likely be prevented.
2. Materials and methods
2.1. Study approach
This study was separated into two parts (). The first part focussed on analyzing LS, and the second compared LSAs with current PPSs areas to suggest the proper site of PPS. For the first part, we established environmental variables and conducted correlation analysis to exclude variables with high coefficient. The landslide occurrence point data for four target years (2006, 2013, 2019, and 2020) were established, and subsequently, we analyzed LS for the four target years using Maxent model.
Figure 1. Flowchart illustrating the approach pursued in the present study.
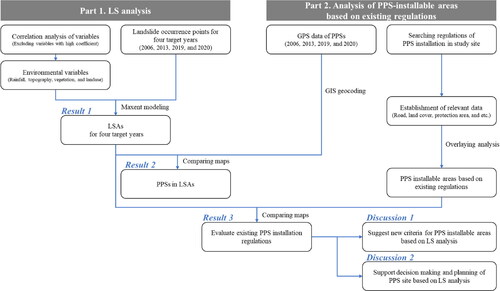
In the second part, we established GPS data of existing PPSs for four target years (2006, 2013, 2019, and 2020). The existing PPS location map was made by geocoding to compare it with the LSAs of each target year. Afterward, we searched the regulations of PPS installation in the study site and established relevant data to analyze installable sites for PPS based on the regulations. The PPS installable sites with present regulation was compared with the LSAs for each target year. Based on the results, we have discussed examples of PPSs in LSAs and provided suggestions for new criteria for proper site of PPS based on the LS analysis.
2.2. Study area
Gangwon-do is located in the Middle East of ROK, from 37° 2′ to 38° 37′ north latitude and from 127° 5′ to 129° 22′ east longitude (). Gangwon-do's east–west length is approximately 150 km, north–south length is approximately 243 km, and the east is approximately 314 km, forming a coastline. The total area of Gangwon-do is 20,569 km2, and the land use is categorized as follows. The mountainous area is 13,783.68 km2, which is 81.7%, the agricultural land is 1,625.22 km2 (or 9.7%), and the urbanized area and the rest of the land use is 1,457.49 km2 (or 8.6%).
Figure 2. Map of Korea highlighting the location of Gangwon-do. Source: Kakaomap (https://map.kakao.map)
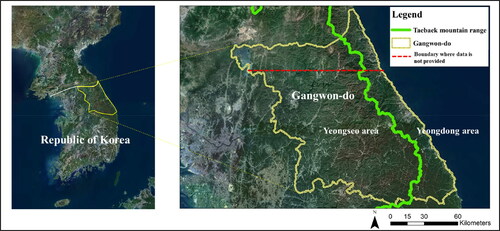
Most of Gangwon-do consists of mountainous areas and is divided into Yeongdong in the east and Yeongseo in the west based on the Taebaek mountain range, the largest mountain range in ROK (). The Yeongdong area is a steep slope with a monotonous coastline and poor continental shelf development. In contrast, the Yeongseo area is an eroded mountainous area, and there are significant differences in topography such as plateaus, hills, and eroded basins (Gangwon province Citation2021). Erosion basins are located on both slopes of the Taebaek mountain range, and the lowlands of the region are formed of granite and metamorphic rocks. In the southern region of Gangwon-do, limestone is widely distributed, thereby leading to the development of karst topography with scattered lime caves (Yoo Citation2004).
The study site is located in the temperate zone, characterized as cold and dry under the influence of high temperature and high humidity in summer and cold and dry continental high pressure in winter. Gangwon-do has peculiar climates in the Yeongdong area and Yeongseo area, which are caused by the Taebaek Mountains. The Yeongdong area descends along the steep slope of the mountain range and is connected to the sea, exhibiting many weather characteristics close to the maritime climate; the area also experiences little change in temperature, high humidity, and ample clouds and precipitation. In contrast, the Yeongseo area is located in the central inland of ROK, showing characteristics close to the continental climate. In addition, the mountainous area on the top of the Taebaek mountain range has characteristics of the mountainous climate; the temperature and pressure are low, insolation is high, and the local differences in climate are large (Gangwon province Citation2021).
Gangwon-do is an area with considerable landslide damage and PPS. The installation of PPSs has been recently increased in mountainous areas of the study site, which may be due to relatively low land prices. In Gangwon-do, most landslides are shallow and associated with heavy rainfalls and typhoons in the summer. In the present study, most landslides occurred between June and August, and we only considered PPSs that were installed before August. The northern part of Gangwon-do was excluded because this is a military-controlled area near North Korea, for which spatial information for the generation of environmental variables was unavailable ().
2.3. Data used and source
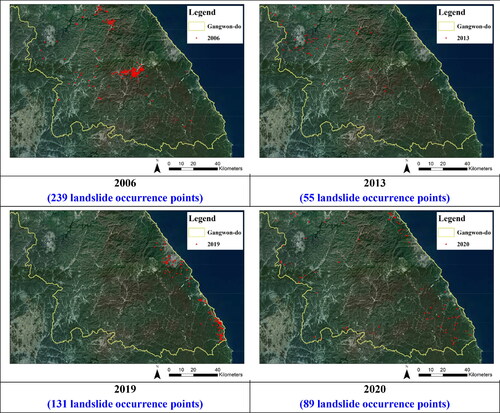
Landslide occurrence point data were collected from Korea Forest Service through information disclosure system. The temporal scope of the present study targeted the years 2006, 2013, 2019, and 2020, with the frequency of landslides being 239, 55, 131, and 89 in the respective years, as depicted in (Korea Forest Service 2020b). ESRI ArcGIS 10.5 was used to make landslide occurrence maps and landslide factors. The landslide occurrence location data were constructed in two ways: first, through field investigations by local government officials, which are conducted immediately after a landslide occurs. However, as it is impossible to conduct field investigations in all landslide areas, investigations are primarily conducted in those areas where human and property damages have occurred. Second, government agencies use satellite image data every year to estimate the location of landslides and produce a database. A reliable database of landslide occurrences is established through two methods. According to the data construction method, the landslide site is investigated as close as possible to the trigger point where the landslide starts.
Figure 3. Maps showing the frequency and distribution of landslides in Gangwon-do in 2006, 2013, 2019, and 2020. Source: Kakaomap (https://map.kakao.map).
We used rainfall, topography, and land use/cover data to analyze LS and PPS installable area. The rainfall data were collected from Korea Meteorological Administration (2021). Topography factor was separated into two categories. The first category contained elevation, slope, and aspect, which were made from three digital elevation models with different production years (National Geographic Information Institute Citation2000, Citation2012, Citation2015). The second category contained soil depth and soil drainage from Korea Water Resources Corporation (Korea Water Resources Corporation Citation2008). Korea Water Resources Corporation selected representative survey sites across Korea and conducted a survey on the depth of soil, drainage capacity, soil particle size, and base material through field surveys on those sites. Soil information was built with a scale of 1:25,000 and has been provided since 2008 at a resolution of 30 m × 30 m. The forest type and land-use data for LS were made using two land cover maps with different production years (Ministry of Environment Citation2010, Citation2019). For identifying PPS-installable areas, we used road data (Ministry of Land Infrastructure and Transport 2020a) and land area and district (Ministry of Land Infrastructure and Transport 2020b) maps as well as 2019 land use data. All data were acquired at the 30 m × 30 m scale and used for analysis at the 90 m × 90 m scale.
2.4. Landslide susceptibility factors
We selected environmental landslide factors based on previous studies on LS analysis. Because landslides in Gangwon-do are caused by rainfall, we primarily reviewed those studies that considered rainfall as the cause of landslides, and the variables of those studies were selected. Among primarily selected factors, the factor whose correlation coefficient between other factors exceeded 0.6 were excluded (Kim et al. Citation2018). However, in the case of rainfall variables, even when the correlation coefficient was high, it was finally used in the model. This is because the three rainfall variables have different detailed characteristics, and when certain variables are excluded, the reliability of the model could be lowered. Specifically, ‘maximum daily rainfall’ represents the intensity in units of days, ‘maximum rainfall per hour’ represents the intensity in units of time, and ‘frequency of rainfall exceeding 150 mm/d’ represents the frequency. Hence, rainfall variables have different detailed characteristics related to landslides, and all were used for good model reliability. In addition, variables with considerably low contribution to the model were excluded. Finally, 10 landslide factors classified into 4 factors (rainfall, topography, vegetation, and land use) were selected ().
Table 1. Summary of environmental variables exploited in the present study.
The rainfall factor comprised the maximum daily rainfall (Glade et al. Citation2000; Kirschbaum et al. Citation2015), frequency of rainfall exceeding 150 mm/d (Floris and Bozzano Citation2008; Sengupta et al. Citation2010; Kim et al. Citation2015), and maximum rainfall per hour (Brand et al. Citation1984; Dhakal and Sidle Citation2004). The maximum daily rainfall reflects the annual rainfall intensity, frequency of rainfall >150 mm/d represents the annual concentration of torrential rains, and maximum rainfall per hour is a variable linked to the daily rainfall intensity.
The topography factor involved the elevation (Gritzner et al. Citation2001; Saleem et al. 2019), slope (Aniya Citation1985; Pike Citation1988; Devoli et al. Citation2007), soil depth (Tangestani Citation2004; Kavzoglu et al. Citation2015; Viet et al. Citation2017), soil drainage capacity (Lee and Min Citation2001; Gorsevski et al. Citation2006; Althuwaynee et al. Citation2014), and aspect (Gritzner et al. Citation2001; Ohlmacher and Davis Citation2003; Armas Citation2012). These variables were selected to assess topographical conditions capable of increasing the landslide occurrence probability during torrential rains. The soil depth data produced nine grades, with Grade 1 representing the deepest (> 100 cm) and Grade 9 indicating the shallowest (0 cm) soil depth. The soil drainage capacity data produced seven grades, with Grade 1 denoting very good drainage and Grade 7 indicating very poor drainage.
The vegetation factor was used to characterize forests as comprising either broad-leaved trees, coniferous trees, or mixed. In previous studies, the LS reportedly varied according to these three forest types (S. Lee et al. Citation2006; Lee Citation2007; Lee et al. Citation2017). Therefore, vegetation was included as a categorical variable to demonstrate the landslide occurrence probability associated with the forest types.
The land use factor was introduced as a categorical variable comprising the following seven types: 1) urban, 2) agricultural, 3) forest, 4) grassland, 5) wetland, 6) bare land, and 7) water. This was done because the landslide occurrence probability increase with development and cultivation activities in areas adjacent to forests (Tasser et al. Citation2003; Pereira et al. Citation2012; Reichenbach et al. 2014).
2.5. LS analysis
The LS analysis was performed using the Maxent model. We used Maxent software ver. 3.4.1, which was downloaded from http://biodiversityinformatics.amnh.org/opensource/maxent. This is a machine learning model that can estimate the probability of landslide events based on location data. Maxent is a general-purpose model for analyzing predictions from insufficient information. The Maxent model results are more reliable than those created using other spatial distribution models such as logistic regression, multiple adaptive regression splines, and classification and regression trees (Felicísimo et al. Citation2013). Although the Maxent model was initially developed as a species distribution model (Phillips et al. Citation2004), its usage has been extended to evaluate LS prediction in association with the frequency ratio method (Raso et al. Citation2020) and the analysis of LS in combination with the support vector machine (Pandey et al. Citation2020).
The origin of Maxent is statistical mechanics (Jaynes Citation1957) that applies to various fields such as statistical physics, astronomy, image reconstruction, and signal processing. The concept of Maxent is to analyze a probability distribution by finding the probability distribution of maximum entropy (i.e., the most spread out) according to constraints representing incomplete information about the target distribution (Phillips et al. Citation2006). When Maxent is applied to occurrence-only landslide distribution modelling, the pixels of the study site make up the space on which the Maxent probability distribution is defined. Subsequently, cells with known landslide occurrence records constitute the sample points, and the factors such as rainfall, topography, vegetation, and land use can be considered.
Maxent can help to provide the best approximation when approximating an unknown probability distribution. Jaynes (Citation1957) argued that the best approach for the best approximation is to ensure that the approximation satisfies the constraints on the unknown distribution as we it is known, and that the distribution should have maximum entropy under these constraints. This is the maximum entropy principle. In our study, the unknown probability distribution, denoted by π, is above the finite set X, which is the set of pixels in the study area (Phillips et al. Citation2006). The individual elements of X are called points. The probability distribution π assigns a non-negative probability π(x) to each point X, and the sum of these probabilities becomes 1. The approximate value of π is also a probability distribution, expressed as The entropy of
is defined as follows:
where ln is the natural logarithm. The entropy is not negative, and it is the natural log of the number of elements in X. This approach can be described as modelling landslide distributions (Phillips et al. Citation2004). As explained above, X is a set of discrete grid cells and represents some geographic region of interest. X contains a set of points x1, x2,…, xm, each representing a locality where the landslide has occurred and been recorded. Finally, we are provided with a set of environmental variables defined on X, such as rainfall and elevation. Based on these input data, we can estimate the range of the LSAs. More detailed explanations and mathematical interpretations of Maxent's machine learning, sequential-update algorithm, and regularization are difficult to deal with in this study; more detailed description can be found in previous studies (Jaynes Citation1957; Phillips et al. Citation2004, Citation2006; Phillips and Dudík Citation2008).
For the Maxent model running option, the model creation involved five iterations for each target year to measure variability. In the analysis of each period, only the locations of landslides that occurred in the respective period were used, so that the statistical relationship analysis between the rainfall variable at each period and the landslide occurrence point was properly done. During the five iterations, five-fold cross-validation was carried out to minimize the errors that occurred in the process of extracting training data for landslide locations. The landslide occurrence point data for each target year were divided into 5 folds, of which 1 was set as the test data to evaluate the performance of the model. The remaining 4 folds were used as training data for model development. The performance of models was assessed based on the area under curve (AUC) value of receiver operating characteristic (ROC) curve analysis. The AUC value makes it easy to compare the performance of one model to another and is useful for evaluating multiple Maxent models. An AUC value of 0.5 indicates that it is not better than random, while a value close to 1.0 indicates better model performance (Phillips et al. Citation2006).
The contributions of the variables were computed using the Jackknife technique in Maxent modelling. Furthermore, response curves produced using the variables data served in establishing the characteristics of the LSAs. The LSAs were constructed by converting the landslide occurrence probability derived from the Maxent model into a binary format based on a threshold value. This threshold value was obtained by averaging the ‘maximum training sensitivity and specificity’ values of the model for each target year.
2.6. Analysis of PPS-installable areas based on existing regulations
We analyzed the PPS installable areas based on the existing regulations of the Gangwon-do administration. Regulations related to limiting PPS installation areas were found for 16 districts, and so, we selected those that were present in at least four districts (). These regulations involved buffer areas in relation to different land use types, and we employed average buffer lengths based on the number of administrative districts. We then developed the regulations-prohibiting installation areas using land cover, road, land area and district map. These prohibited regions were then excluded in determining PPS installable areas within the study area.
Table 2. Regulations for limiting PPS installation in the study area.
3. Results
3.1. Model evaluation
The model reliability and variable contribution data for each target year are presented in Table 3, and the reliability data follows the order 2019 > 2006 > 2020 > 2013. According to previous studies, a reliability value of 1.0 represents perfect accuracy, while a value ≥ 0.9 is described as high predictive accuracy, and values between 0.7–0.9 are denoted as appropriate accuracy (Franklin Citation2009). Therefore, the values of ≥ 0.8 obtained for the target years reflect a high prediction accuracy for the 2006 and 2019 models and an adequate accuracy for the 2013 and 2020 models. The frequency of rainfall exceeding 150 mm/d is the variable showing high contributions in all years. Meanwhile, the altitude, land use, and forest type exhibit high contributions in three target years, while the other variables display different contributions for each target year.
3.2. LSAs and PPS locations
Maps of the LSAs and installed PPS locations for different target years are shown in . The LSAs derived from the Maxent model are areas with high landslide occurrence probability based on the relationships between previous landslide occurrence locations and environmental variables such as rainfall. Accordingly, the LSAs were 234.89 km2 in 2006, 338.38 km2 in 2013, 89.17 km2 in 2019, and 320.07 km2 in 2020. In 2006, the LSAs were concentrated in the central and north regions of Gangwon-do, whereas in 2013, these were mainly in the north and south regions. Meanwhile, in 2019, the LSAs were principally in the east coastal area of Gangwon-do, while in 2020, these involved the east coast, north, and south areas. Considering that landslides in the ROK are often associated with torrential rains accompanied by typhoons and that the rainy season is in the summer, weather conditions characterized the areas with high landslide probabilities. The difference in areas affected by torrential rains between the target years’ accounts for the LSA variation.
Figure 4. Maps showing LSAs and PPS locations for different target years. The red in the maps highlights LSAs, while the yellow dots represent PPSs located within the LSAs, and the blue dots show PPSs located outside the susceptible areas. Source: Kakaomap (https://map.kakao.map).
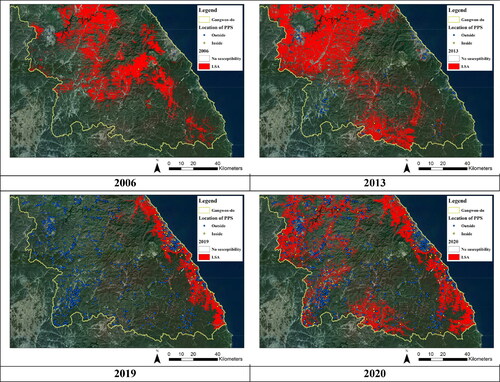
The number of PPSs installed before August 2006, 2013, 2019, and 2020 are 3, 125, 2268, and 2290, respectively. PPS installations significantly increased by 2,143 between 2013 and 2019. The number of PPSs located within LSAs increased continuously (). In 2006, in the early stage of photovoltaic power generation development, just one out of three PPSs was in a susceptible area. In 2013, 4 out of 125 PPSs were in susceptible areas, representing 3.2%, while 77 out of 2,268 in 2019 account for 3.4%, and 242 out of 2,290 in 2020 represent 10.6%.
Figure 5. Plot showing the PPSs distribution relative to the LSA for various target years.
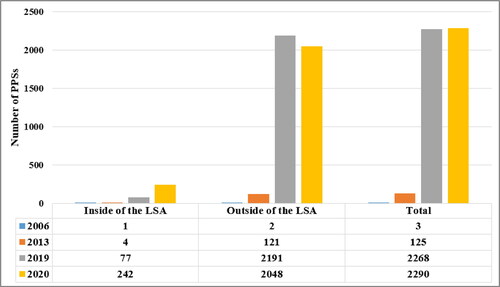
In 2020, because of the high frequency of torrential rains, the LSAs expanded, causing PPS locations in susceptible areas to increase significantly. In fact, relative to 2019, a year earlier, the PPS locations in susceptible areas more than tripled from 77 to 242. Although the LSA in 2013 is wider compared to that in 2020, the PPS installations in susceptible areas represented just 3.2% relative to 10.6% in 2020. Therefore, at present, for a LSA similar to that of 2013, a significantly higher number of PPSs will likely be affected because of the indiscriminate installation.
3.3. LS of existing PPS installable areas
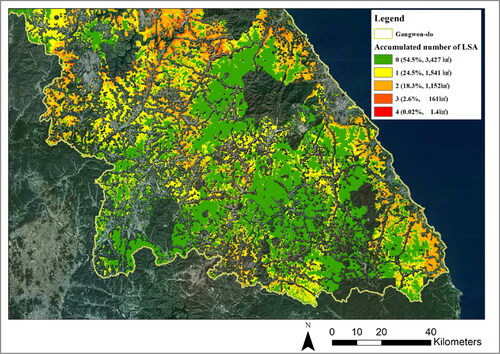
The estimated PPS installable areas considering the existing regulations in Gangwon-do is approximately 6,284 km2, which represents 37.2% of the study area. Comparison of the PPS installable area and LSAs show approximately 45.4% of the installable areas at least once in LSAs (). This means that, henceforth, if reliant on the existing regulations, 45.4% of PPSs can be installed in LSAs. The present PPS installable areas, which occurred three or four times within susceptible areas, are mostly around valleys, mountains, roads, and residential areas in north Gangwon-do. The existing regulations do not consider geophysical criteria for mitigating landslide damage. Subsequently, geophysical variables associated with LS, which can serve as criteria in regulations for minimizing the impact of landslides on PPS installations in Gangwon-do in the future are examined.
Figure 6. Combined map of accumulated number of LSA for 4 target years and the PPS installable areas.Source: Kakaomap (https://map.kakao.map) .
4. Discussion
4.1. Suggest new criteria for PPS installable areas based on LS analysis
Solar energy exploitation is an important strategy for mitigating climate change. However, in some areas such as Gangwon-do, some PPS facilities are exposed to landslide damage, and such damage will likely increase in the future because of climate change. In the ROK, the highest proportion of mountains are in Gangwon-do, highlighting high LS for the PPSs in the area. In fact, the PPSs installed in LSAs increased by 28 times from 2013 (19 stations) to 2020 (545 stations). This implies that these stations can amplify the damages of landslides by contributing to the debris flows and injuries to humans. Climate change is reported to account for the increasing heavy rainfall intensity and frequency in many areas (Kim et al. Citation2015), suggesting a potential for higher contributions to LS in the future. Therefore, identifying PPS installable areas in LSAs and improving the regulations for their installation by incorporating this susceptibility analysis data is important.
However, the existing regulations for PPS installation in the mountainous Gangwon-do region exhibit limitations for LS. These regulations are rather focussed on social issues related to land use. Therefore, new criteria for PPS installation sites should be incorporated into the regulations. We suggest including soil, topography, and vegetation criteria in the new regulations so that they can be used consistently regardless of changes in rainfall. In the current study, geophysical features including the soil depth, soil drainage capacity, slope, aspect, forest type, land use, and elevation were used to propose new criteria for new regulations based on response curves of each variable for four target years.
For the soil depth and drainage, LSAs are associated with the very shallow (< 20 cm) and very deep (>100 cm) soil areas and the very good (Grade 1) and good (Grade 2) soil drainage capacity areas. Although there might be other perspectives on interpreting the characteristics of soil depth in the LSA, the present results could be interpreted as follows based on related references. In areas with thick (>100 cm) soil layers, the hydrostatic pressure could be high because of the difficulty to drain stored water (Choe Citation2001). Conversely, in shallow soil areas (<20 cm), easy soil saturation could promote soil movement off slopes (Park et al. Citation2005). Meanwhile, in high soil drainage capacity areas, rainfall easily penetrates the soil, creating water films between the soil layers (Y. Lee et al. Citation2006; Nam et al. Citation2016). When comprehensively reviewing the results of this study and previous studies, it is recommended that the installation of PPS be prohibited in areas with a soil depth of <20 cm or >100 cm and areas with good and very good soil drainage capacity, as they are highly susceptible to landslides.
For the slope variable, LSAs were associated with 10–22° slope in 2006, 13–30° in 2013, 10–27° in 2019, and 10–26° in 2020. According to previous studies, the standard of slope, which is judged to be sensitive to landslides, appears slightly different. For example, in (Lee and Min Citation2001), the range of the highest landslides probabilities is 15–24°, while 18–27° is reported in (Son et al. Citation2009). In these studies, no landslide is associated with areas showing slopes exceeding 30°. Considering the results of this study and those of previous studies, it is judged that an area with 10–30° slope of is highly susceptible to landslides, and thus a regulation prohibiting the installation of PPS in such areas should be considered.
Aspect is also an important variable suggested for introduction in the regulations because it is related to the soil depth and slope. The most vulnerable aspect exhibited as the north is consistent with previous studies on Gangwon-do (Jo et al. Citation2003; Son et al. Citation2009; Yoo et al. Citation2011). In Gangwon-do, the highest slopes and deepest soil layers are in the north, making the area highly susceptible to landslides (Jo and Jang Citation2007). Therefore, when PPS is installed on the northern slope in Gangwon-do, it should be included in the installation regulation that special attention should be paid to potential landslides.
For the elevation variable, LSAs were associated with 200–450 m elevation. However, this range is wide, and there is a limit to grasping the exact cause that makes the area susceptible to landslides. For the distribution of elevation in forests in Gangwon-do, areas with 100–500 m account for 43.1% of the total area (Yoo Citation2004). The elevation range identified as susceptible to landslides in this study also falls within that range. Therefore, the fact that it occupies a large proportion of the elevation of mountainous areas in Gangwon-do is interpreted as the cause of the high susceptibility to landslides. According to previous studies, the contribution of the elevation on landslide susceptibility is significantly different (Kornejady et al. Citation2017; Javidan et al. Citation2021). Therefore, it is difficult to directly reflect the elevation in the PPS installation regulation.
The next variable proposed for insertion in the regulations for PPS installation is the forest type. In the present study, the Coniferous trees were found to be inappropriate for PPS installation because of the root characteristics of the plants. Landslides are common in areas where old and large-diameter pines and firs are present . Coniferous trees characterized by shallow tree roots are vulnerable to landslides because of the weak support by the roots (Lee and Yoo Citation2009; Son et al. Citation2009). Therefore, the installation of PPS in coniferous forests can cause landslide damage, and special care regarding this should be included in the PPS installation regulation.
In the case of land-use variables, the majority of landslides occurred in the forests, making them the most susceptible to landslides. Other than the forest areas, urbanized areas and agricultural areas adjacent to the forest were found to be susceptible to landslides. Therefore, when PPS is installed in a forest area, it is necessary to consider the susceptibility of landslides, and caution is required to prevent landslide damage to adjacent urbanized areas and agricultural lands.
As reported in previous studies, rainfall is very closely linked to LS (Kim et al. Citation2013; Oh and Park Citation2013; Um et al. Citation2014; Kim et al. Citation2015; Hong et al. Citation2016). However, the distribution and intensity of rainfall variables for the four years used in this study were not constant every year. As such, rainfall cannot be easily reflected in the installation regulation due to its characteristics that change every year. Alternatively, to prevent the occurrence of landslides, efforts are required to come up with a method that strongly recommends installing facilities (such as debris barrier and vegetation restoration) to prevent landslide damage caused by torrential rains when installing PPS in areas with high susceptibility to landslides. In addition, research should be conducted to predict future LSAs based on climate change scenarios for developing future installation regulations. However, there are many uncertainties in the prediction of future LSAs, and these limitations need to be clearly understood and addressed for regulatory improvement (Kim et al. Citation2018).
4.2. Support decision making and planning of PPS site based on LS analysis
The comprehensive map () of LS can help decision makers in the mid- to long-term PPS installation regulation establishment process. Most decision makers who formulate and implement policies to respond to forest disasters are not experts on landslides. Therefore, providing them with spatial LSA information can be a huge advantage. However, in establishing mid- to long-term countermeasures, it is difficult to consider only LSAs in a specific target year. Therefore, as shown in , despite the different rainfall distributions for each year, information on regions that are continuously susceptible to landslides can be utilized. Considering the different rainfall distributions, the areas identified as LSAs multiple times can be interpreted as areas where environmental variables other than rainfall variables have a high influence on the probability of landslide occurrence. Therefore, data shown in can be used in the decision-making process, as it can spatially show areas that are continuously susceptible to landslides even when rainfall changes.
In addition, multi target year analysis is effective to explore LS of facilities that rapidly increase over time, such as PPSs. Recently, PPSs in Gangwon-do have been increasing rapidly, and as a result, areas with high LS among PPS installation areas have also increased rapidly. The multi target year analysis confirmed that it is urgent to prepare a regulation for the installation of PPS considering LS, and this can serve as evidence to persuade decision makers. It is difficult to confirm this urgency with only LS analysis for a specific time period. Nevertheless, we should be careful to interpret the multi target year result (), as the combined area of LSAs for previous years cannot be interpreted as an area that is continuously susceptible to landslides in the future.
Based on the identified range values of environmental variables in the LSA, new criteria (reference values) and recommendations should be included in the PPS installation regulation in the future. The results derived from this study are expected to be used as scientific basis for decision makers to improve the PPS installation regulation. In particular, the results of this study can be used as a basis for preparing standards for mid- to long-term land use plans related to the establishment of PPS. As a matter of caution, the susceptibility linked to variables could be different by region in the ROK (Ko et al. Citation2014). Therefore, to improve the PPS installation regulation, it is necessary to conduct a LS assessment by target region.
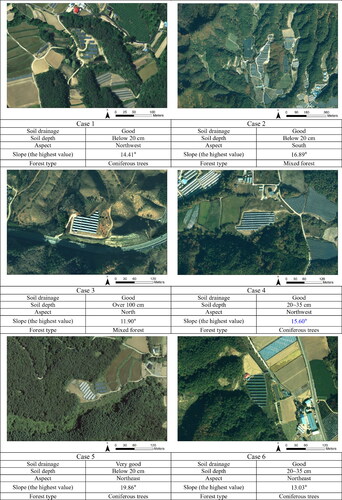
In the present study, some PPSs featured in LSAs more than three times out of four target years (). These installations displayed consistent soil, topography, and forest type characteristics. Therefore, these stations are highly susceptible to landslides and require future damage mitigation measures such as the installation of debris barriers, slope restoration, and landslide monitoring (Kim et al. Citation2018). However, the crucial consideration for future susceptibility reduction is to incorporate landslide vulnerability criteria in the decision-making steps associated with the installation of PPS. Considering that the PPS network in many countries will expand as energy demands increase (Kannan and Vakeesan Citation2016), including the suggested criteria in regulations, especially for installation in mountainous areas, will reduce the LS.
Figure 7. Examples of PPSs that featured in LSAs 3 or 4 times in the four target years. Source: Kakaomap (https://map.kakao.map).
5. Conclusions
The purpose of the present study was to analyze the LS of PPSs in Gangwon-do based on four target years. In addition, the PPS installation regulations adequacy was evaluated to highlight issues that require attention. The results revealed that LS was insufficiently considered in the existing regulations, indicating the need for urgent regulatory improvement. According to the LSAs that were derived for the target years, the number of PPS locations in LSAs increased over time, reaching the maximum in 2020 (3.2% in 2013 and 10.6% in 2020). It shows the necessity and importance of multi target year analysis. Meanwhile, when analyzing installable areas considering existing regulations, 45.4% of areas were evidently included in areas with high susceptibility to landslides. Thus, PPS installation regulation should consider LS factors such as soil depth, soil drainage capacity, aspect, slope, and forest type. These criteria can be developed by considering climate change scenario for mid- to long-term regulations. This study demonstrates that although PPS are installed for climate change mitigation, these stations can be destroyed by landslides, a disaster increasingly promoted by climate change. Therefore, future climate change disasters require consideration when developing renewable energy infrastructures. This study highlights the urgency and need to incorporate LS in PPS installation regulations in other countries with many PPSs in mountainous regions. In countries with many mountainous regions, such as China and some regions of the European Union, it is essential to establish a plan that can prevent the reduction of solar power generation efficiency, destruction of power generation facilities, and damage to people and property due to landslides. The framework for linking the multi target year LS analysis and PPS proper site analysis proposed in this study can be used to prevent landslide damage in these countries. In particular, our data can be used to improve the PPS installation regulations in consideration of LSAs and are expected to help prevent landslide damage in the mid- to long-term.
Disclosure statement
No potential conflict of interest was reported by the authors.
Data availability statement
The data that support the findings of this study are available on request from the corresponding author, [Chae Yeon Park]. The data are not publicly available due to their containing information that could compromise the privacy of research participants.
Additional information
Funding
References
- Adewuyi OB, Lotfy ME, Akinloye BO, Howlader HOR, Senjyu T, Narayanan K. 2019. Security-constrained optimal utility-scale solar PV investment planning for weak grids: short reviews and techno-economic analysis. Appl Energy. 245:16–30.
- Althuwaynee OF, Pradhan B, Park H-J, Lee JH. 2014. A novel ensemble bivariate statistical evidential belief function with knowledge-based analytical hierarchy process and multivariate statistical logistic regression for landslide susceptibility mapping. Catena. 114:21–36.
- Andrews RW, Pollard A, Pearce JM. 2013. The effects of snowfall on solar photovoltaic performance. Sol Energy. 92:84–97.
- Aniya M. 1985. Landslide-susceptibility mapping in the Amahata river basin, Japan. Ann Assoc Am Geogr. 75(1):102–114.
- Armas I. 2012. Weights of evidence method for landslide susceptibility mapping, Prahova Subcarpathians, Romania. Nat Hazards. 60(3):937–950.
- Bonkaney AL, Madougou S, Adamou R. 2017. Impact of climatic parameters on the performance of solar photovoltaic (PV) module in Niamey. SGRE. 08(12):379–393.
- Brand EW, Premchitt J, Phillipson HB. 1984. Relationship between rainfall and landslides in Hong Kong. In Proceedings of 4th International Symposium on Landslides, Vol. 1; [place unknown]. p. 276–284.
- Choe G. 2001. Landslide occurrence status and causes of Republic of Korea. Korean Soc Hazard Mitig. 1(3):7–14.
- Choi H. 2020. Solar power in 272 areas of environmental protection and landslide risk. Chosun Ilbo. https://www.chosun.com/economy/industry-company/2020/10/07/NMCE7Z323RHETACRNXW7SNAQ5M/. (2021.05.09)
- Ciabatta L, Camici S, Brocca L, Ponziani F, Stelluti M, Berni N, Moramarco T. 2016. Assessing the impact of climate-change scenarios on landslide occurrence in Umbria Region, Italy. J Hydrol. 541:285–295.
- Chen W, Peng J, Hong H, Shahabi H, Pradhan B, Liu J, Zhu A-X, Pei X, Duan Z 2018. Landslide susceptibility modelling using GIS-based machine learning techniques for Chongren County, Jiangxi Province, China. Sci Total Environ. 626:1121–1135.
- Ciervo F, Rianna G, Mercogliano P, Papa MN. 2017. Effects of climate change on shallow landslides in a small coastal catchment in southern Italy. Landslides [Internet]. 14(3):1043–1055.
- Corominas J, van Westen C, Frattini P, Cascini L, Malet JP, Fotopoulou S, Catani F, Van Den Eeckhaut M, Mavrouli O, Agliardi F, et al. 2014. Recommendations for the quantitative analysis of landslide risk. Bull Eng Geol Environ. 73(2):209–263.
- Darby M, Gerretsen I. 2021. Which countries have a net zero carbon goal? Clim home news. https://www.climatechangenews.com/2019/06/14/countries-net-zero-climate-goal/ (2021.05.09)
- Devoli G, Strauch W, Chávez G, Høeg K. 2007. A landslide database for Nicaragua: a tool for landslide-hazard management. Landslides. 4(2):163–176.
- Dhakal AS, Sidle RC. 2004. Distributed simulations of landslides for different rainfall conditions. Hydrol Process. 18(4):757–776.
- Felicísimo ÁM, Cuartero A, Remondo J, Quirós E. 2013. Mapping landslide susceptibility with logistic regression, multiple adaptive regression splines, classification and regression trees, and maximum entropy methods: a comparative study. Landslides [Internet]. 10(2):175–189.
- Floris M, Bozzano F. 2008. Evaluation of landslide reactivation: a modified rainfall threshold model based on historical records of rainfall and landslides. Geomorphology. 94(1–2):40–57.
- Fowler HJ, Lenderink G, Prein AF, Westra S, Allan RP, Ban N, Barbero R, Berg P, Blenkinsop S, Do HX, et al. 2021. Anthropogenic intensification of short-duration rainfall extremes. Nat Rev Earth Environ. 2(2):107–122.
- Franklin J. 2009. Mapping species distributions. Cambridge: Cambridge University Press.
- Gangwon Province. 2021. Natural environment of Gangwon-do. https://www.provin.gangwon.kr/gw/portal/sub03_01_01. (2021.05.09)
- Glade T, Crozier M, Smith P. 2000. Applying probability determination to refine landslide-triggering rainfall thresholds using an empirical Antecedent Daily Rainfall Model. Pure Appl Geophys. 157(6–8):1059–1079.
- Gorsevski PV, Gessler PE, Foltz RB, Elliot WJ. 2006. Spatial prediction of landslide hazard using logistic regression and ROC analysis. Trans GIS. 10(3):395–415.
- Gritzner ML, Marcus WA, Aspinall R, Custer SG. 2001. Assessing landslide potential using GIS, soil wetness modeling and topographic attributes, Payette River, Idaho. Geomorphology. 37(1–2):149–165.
- Gunderson I, Goyette S, Gago-Silva A, Quiquerez L, Lehmann A. 2015. Climate and land-use change impacts on potential solar photovoltaic power generation in the Black Sea region. Environ Sci Policy. 46:70–81.
- Harkouss F, Fardoun F, Biwole PH. 2019. Optimal design of renewable energy solution sets for net zero energy buildings. Energy. 179:1155–1175.
- Hong M-H, Kim J-H, Jung G-J, Jeong S-S. 2016. Rainfall threshold (ID curve) for landslide initiation and prediction considering antecedent rainfall. J Korean Geotech Soc. 32(4):15–27.
- Javidan N, Kavian A, Pourghasemi HR, Conoscenti C, Jafarian Z, Rodrigo-Comino J. 2021. Evaluation of multi-hazard map produced using MaxEnt machine learning technique. Sci Rep. 11(1):1–20.
- Jaynes ET. 1957. Information theory and statistical mechanics. Phys Rev. 106(4):620–630.
- Jerez S, Tobin I, Vautard R, Montávez JP, López-Romero JM, Thais F, Bartok B, Christensen OB, Colette A, Déqué M, et al. 2015. The impact of climate change on photovoltaic power generation in Europe. Nat Commun. 6(1):10014.
- Jo Y-C, Jang T-U. 2007. Characteristics of landslides in Gangneung area caused by typhoon “Rusa” - focusing on the frequency of occurrence according to the shape and slope direction of the landslide. In: Proceedings of KSEEG Conference; [place unknown]. p. 319–321.
- Jo Y-C, Kim K, Lee C, Chae B, Kim W. 2003. Characteristics of landslide triggered by typhoon “Rusa” in Gangneung Area. Proc Korean Soc Econ Environ Geol. 2003(0):21–26.
- Kannan N, Vakeesan D. 2016. Solar energy for future world - a review. Renew Sustain Energy Rev. 62:1092–1105.
- Kavzoglu T, Sahin EK, Colkesen I. 2015. Selecting optimal conditioning factors in shallow translational landslide susceptibility mapping using genetic algorithm. Eng Geol. 192:101–112.
- Keefer DK. 2000. Statistical analysis of an earthquake-induced landslide distribution—the 1989 Loma Prieta, California event. Eng Geol. 58(3–4):231–249.
- Kim H. 2020. There were only 12 cases… solar power destruction once a day this summer. Chosun Ilbo. https://www.chosun.com/politics/2020/09/08/MAMOEI3L7VFKDBK3G75QWM3GV4/. (2021.05.09)
- Kim H, Lee D-K, Mo Y, Kil S, Park C, Lee S. 2013. Prediction of landslides occurrence probability under climate change using MaxEnt Model. J Environ Impact Assess. 22(1):39–50.
- Kim HG, Lee DK, Park C. 2018. Assessing the cost of damage and effect of adaptation to landslides considering climate change. Sustainability. 10(5):1–22.
- Kim HG, Lee DK, Park C, Ahn Y, Kil SH, Sung S, Biging GS. 2018. Estimating landslide susceptibility areas considering the uncertainty inherent in modeling methods. [place unknown]: Springer Berlin Heidelberg. https://doi.org/https://doi.org/10.1007/s00477-018-1609-y
- Kim HG, Lee DK, Park C, Kil S, Son Y, Park JH. 2015. Evaluating landslide hazards using RCP 4.5 and 8.5 scenarios. Environ Earth Sci. 73(3):1385–1400.
- Kim M-H, Kim D, Heo J, Lee D-W. 2019. Techno-economic analysis of hybrid renewable energy system with solar district heating for net zero energy community. Energy. 187:115916.
- Kim S-W, Chun K-W, Kim J-H, Kim M-S, Kim M-S. 2012. Characteristics of heavy rainfall for landslide-triggering in 2011. J Korean Soc for Sci. 101(1):28–35.
- Kirschbaum D, Stanley T, Zhou Y. 2015. Spatial and temporal analysis of a global landslide catalog. Geomorphology. 249:4–15.
- Knutti R, Sedláček J. 2012. Robustness and uncertainties in the new CMIP5 climate model projections. Nat Clim Chang. 3(4):369–373.
- Ko SM, Lee SW, Yune C-Y, Kim G. 2014. Topographic analysis of landslides in Umyeonsan. J Korean Soc Surv Geod Photogramm Cartogr. 32(1):55–62.
- Korea Forest Service. 2020a. 2021 Forest budget - budget expansion to increase national safety and income of foresters.
- Korea Forest Service. 2020b. Landslide occurrence points.
- Korea Meteorological Administration. 2021. Open Meteorological Data Portal. https://data.kma.go.kr/cmmn/main.do#. (2021.05.09)
- Korea Water Resources Corporation. 2008. Geospatial data of ROK. https://www.wamis.go.kr. (2021.05.09)
- Kornejady A, Ownegh M, Bahremand A. 2017. Landslide susceptibility assessment using maximum entropy model with two different data sampling methods. CATENA. 152:144–162.
- Koutra S, Becue V, Gallas M-A, Ioakimidis CS. 2018. Towards the development of a net-zero energy district evaluation approach: a review of sustainable approaches and assessment tools. Sustain Cities Soc. 39:784–800.
- Lee C-J, Yoo N-J. 2009. A study on debris flow landslide disasters and restoration at Inje of Kangwon Province, Korea. J Korean Soc Hazard Mitig. 9(1):99–105.
- Lee S. 2007. Landslide susceptibility mapping using an artificial neural network in the Gangneung area, Korea. Int J Remote Sens. 28(21):4763–4783.
- Lee S, Lee M-J, Jung H-S. 2017. Data mining approaches for landslide susceptibility mapping in Umyeonsan, Seoul, South Korea. Appl Sci. 7(7):683.
- Lee S, Min K. 2001. Statistical analysis of landslide susceptibility at Yongin, Korea. Environ Geol. 40(9):1095–1113.
- Lee S, Ryu J-H, Lee M-J, Won J-S. 2006. The application of artificial neural networks to landslide susceptibility mapping at Janghung. Math Geol. 38(2):199–220.
- Lee Y, Park G, Kim S-J. 2006. Analysis of landslide hazard area using logistic regression analysis and AHP (Analytical Hierarchy Process) approach. J Korean Soc Civ Eng. 26(5D):861–867.
- Leroi E, Bonnard C, Fell R, McInnes R. 2005. Risk assessment and management. Landslide Risk Manag. 10(5):159–198.
- Lombardo L, Bachofer F, Cama M, Märker M, Rotigliano E. 2016. Exploiting maximum entropy method and ASTER data for assessing debris flow and debris slide susceptibility for the Giampilieri catchment (north-eastern Sicily, Italy). Earth Surf Process Landforms. 41(12):1776–1789.
- Ministry of Environment. 2010. Land cover map. Environ Spat Inf Serv.
- Ministry of Environment. 2019. Land cover Map. Environ Spat Inf Serv.
- Ministry of Land Infrastructure and Transport. 2020a. Road map. Korea Natl Spat Data Infrastruct Portal.
- Ministry of Land Infrastructure and Transport. 2021. Species protection area.
- Ministry of Land Infrastructure and Transport. 2020b. Land area district map. Korea Natl Spat Data Infrastruct Portal.
- Nam K-H, Lee M-J, Jeong G-C. 2016. Landslide susceptibility analysis: SVM application of spatial databases considering clay mineral index values extracted from an ASTER satellite image. J Eng Geol. 26(1):23–32.
- Napoli MD, Martire DD, Bausilio G, Calcaterra D, Confuorto P, Firpo M, Pepe G, Cevasco A. 2021. Rainfall-induced shallow landslide detachment, transit and runout susceptibility mapping by integrating machine learning techniques and GIS-based approaches. Water. 13(4):488.
- National Geographic Information Institute. 2000. Digital elevation model.
- National Geographic Information Institute. 2012. Digital elevation model.
- National Geographic Information Institute. 2015. Digital elevation model.
- Novellino A, Cesarano M, Cappelletti P, Di Martire D, Di Napoli M, Ramondini M, Sowter A, Calcaterra D. 2021. Slow-moving landslide risk assessment combining Machine Learning and InSAR techniques. CATENA. 203:105317.
- Oh C-Y, Kim K-T, Choi C-U. 2009. Analysis of landslide characteristics of Inje area using SPOT5 images and GIS analysis. Korean J Remote Sens. 25(5):445–454.
- Oh J, Park HJ. 2013. Establishment of landslide rainfall threshold for risk assessment in Gangwon area. J Korean Soc Hazard Mitig. 13(3):43–51.
- Ohlmacher GC, Davis JC. 2003. Using multiple logistic regression and GIS technology to predict landslide hazard in northeast Kansas, USA. Eng Geol. 69(3–4):331–343.
- Pandey VK, Pourghasemi HR, Sharma MC. 2020. Landslide susceptibility mapping using maximum entropy and support vector machine models along the Highway Corridor, Garhwal Himalaya. Geocarto Int. 35(2):168–187.
- Park CY, Moon JY, Yun EJ, Tae CW, Choi YE. 2008. Recent changes in summer precipitation characteristics over South Korea. J Korean Geogr Soc. 45(3):324–336.
- Park J-H, Choi K, Bae JS, Ma H-S, Lee J-H. 2005. Analysis on the characteristics of the landslide in Maeri (I) - with a special reference on geo-topographical characteristics. Korean Soc for Sci. 94(3):129–134.
- Pereira S, Zêzere JL, Bateira C. 2012. Assessing predictive capacity and conditional independence of landslide predisposing factors for shallow landslide susceptibility models. Nat Hazards Earth Syst Sci. 12(4):979–988.
- Pérez JC, González A, Díaz JP, Expósito FJ, Felipe J. 2019. Climate change impact on future photovoltaic resource potential in an orographically complex archipelago, the Canary Islands. Renew Energy. 133:749–759.
- Phillips S, Anderson R, Schapire R. 2006. Maximum entropy modeling of species geographic distributions. Ecol Modell [Internet]. 190(3–4):231–259.
- Phillips SJ, Dudík M. 2008. Modeling of species distributions with Maxent: new extensions and a comprehensive evaluation. Ecography (Cop). 31(2):161–175.
- Phillips SJ, Dudík M, Schapire RE. 2004. A maximum entropy approach to species distribution modeling. Twentyfirst International Conference on Machine Learning ICML 04, [Banff, Canada]; Vol. 69. p. 83.
- Poudel KR, Hamal R, Paudel N. 2020. Landslide Susceptibility Assessment: Identification and Hazard Mapping of Gandaki Province, Nepal. Prithvi Acad J. 3:11–21.
- Pike RJ. 1988. The geometric signature: quantifying landslide-terrain types from digital elevation models. Math Geol. 20(5):491–511.
- Raso E, Di Martire D, Cevasco A, Calcaterra D, Scarpellini P, Firpo M. 2020. Evaluation of prediction capability of the MaxEnt and Frequency Ratio methods for landslide susceptibility in the Vernazza catchment (Cinque Terre, Italy. ). In: Appl Geol. [place unknown ]: Springer; p. 299–316.
- Rediske G, Siluk JCM, Gastaldo NG, Rigo PD, Rosa CB. 2019. Determinant factors in site selection for photovoltaic projects: A systematic review. Int J Energy Res. 43(5):1689–1701.
- Reichenbach P, Busca C, Mondini AC, Rossi M. 2014. The influence of land use change on landslide susceptibility zonation: the Briga catchment test site (Messina, Italy). Environ Manage. 54(6):1372–1384.
- Saleem N, Huq M, Twumasi NYD, Javed A, Sajjad A. 2019. Parameters derived from and/or used with digital elevation models (DEMs) for landslide susceptibility mapping and landslide risk assessment: a review. IJGI. 8(12):545.
- Segoni S, Piciullo L, Gariano SL. 2018. A review of the recent literature on rainfall thresholds for landslide occurrence. Landslides. 15(8):1483–1501.
- Sengupta A, Gupta S, Anbarasu K. 2010. Rainfall thresholds for the initiation of landslide at Lanta Khola in north Sikkim. Nat Hazards. 52(1):31–42.
- Sevgen E, Kocaman S, Nefeslioglu HA, Gokceoglu C. 2019. A novel performance assessment approach using photogrammetric techniques for landslide susceptibility mapping with logistic regression, ANN and random forest. Sensors. 19(18):3940.
- Son J-W, Kim K-T, Lee C-H, Choi C-U. 2009. Analysis of landslide in Inje region using aerial photograph and GIS. J Korean Soc Geospatial Inf Syst. 17(2):61–69.
- Tangestani MH. 2004. Landslide susceptibility mapping using the fuzzy gamma approach in a GIS, Kakan catchment area, southwest Iran. Aust J Earth Sci. 51(3):439–450.
- Tasser E, Mader M, Tappeiner U. 2003. Effects of land use in alpine grasslands on the probability of landslides. Basic Appl Ecol. 4(3):271–280.
- Thuiller W, Lafourcade B, Engler R, Araújo MB. 2009. BIOMOD–a platform for ensemble forecasting of species distributions. Ecography (Cop). 32(3):369–373.
- Um M, Jeong C, Cho W. 2014. Analysis of precipitation distribution in the region of Gangwon with spatial analysis (I): classification of precipitation zones and analysis for seasonal and annual precipitation. Journal of the Korean Society of Hazard Mitigation. 9(5):103–113. (January 2009).
- Viet TT, Lee G, Thu TM, An HU. 2017. Effect of digital elevation model resolution on shallow landslide modeling using TRIGRS. Nat Hazards Rev. 18(2):4016011.
- Wood JL, Harrison S, Reinhardt L. 2015. Landslide inventories for climate impacts research in the European Alps. Geomorphology. 228:398–408.
- Yang I-T, Chun K-S, Park J-K, Lee S-Y. 2007. An estimation to landslide vulnerable area of rainfall condition using GIS. J Korean Soc Geospatial Inf Syst. 15(1):39–46.
- Yang I-T, Park J-K, Jeon W-H, Chun K-S. 2007. An evaluation of landslide probability by maximum continuous rainfall in Gangwon, Korea. J Korean Soc Geospatial Inf Syst. 15(4):11–20.
- Yin Y, Wang F, Sun P. 2009. Landslide hazards triggered by the 2008 Wenchuan earthquake, Sichuan, China. Landslides. 6(2):139–152.
- Yoo N. 2004. Topographic, geological and geotechnical problems in Gangwon-do. Korea Geotech Soc. 1(3):125–133.
- Yoo N-J, Kim J-H, Choi J-S. 2011. Characteristics of landslide occurrence in Wonju during 2006. J Ind Technol. 31(A):87–94.
- Yoo SH, Sohn HG, Jung JH, Choi SK. 2009. Monitoring of landslide in Kangwondo area using 2-Pass DInSAR technique. J Korean Soc Soc Secur. 2(2):85–90.
- Yun S-W, Paek Y, Jang J-K, Choi D-K, Kang D, Son J, Park M-J, Kang S-W, Gwon J-K. 2019. A study for planning optimal location of solar photovoltaic facilities using GIS. PHPF. 28(3):243–254.