
 ?Mathematical formulae have been encoded as MathML and are displayed in this HTML version using MathJax in order to improve their display. Uncheck the box to turn MathJax off. This feature requires Javascript. Click on a formula to zoom.
Abstract
This work proposed a composite soil reinforcement method to support the vegetation growth and improve slope stability using geocell structures and wheat straws. Twelve physical models were developed for assessing rainfall intensities, slope steepness and geocell sizes on the soil erosion. The results showed that: (1) the geocell reinforced slopes maintained a good integrity, but the bare slope showed horizontal cracks; (2) the soil erosion was less than 40 g and more than 4000 g under the 50 mm/h and 100 mm/h rainfall intensities; the largest slope displacement was 2.5 mm and 7.5 mm, respectively; (3) the steep slopes showed a largest soil erosion of 5000 g and largest displacement of 8 cm, compared to 4500 g and 5.5 cm for gentle slopes; soil water contents were 40% and 30% for the steep and gentle slopes; (4) the measured soil erosion under the 100 mm/h rainfall was 4000 g and 5000 g for the small and large geocell reinforced slopes; the displacement of small geocell reinforced slopes were typically 1–2.5 cm smaller than large geocell reinforced slopes. It is concluded that the small geocell reinforced slope at a small inclination and low rainfall intensity has the best stability.
1. Introduction
Soil erosion on slopes is the downward displacement of the soil commonly found on road embankments and in areas of mountainous terrain (Stokes et al. Citation2014). The extension of soil erosion may lead to the shallow slope failure known as the superficial removal of the small-scale topsoil and vegetation cover (Hess et al. Citation2017; Löbmann et al. Citation2020), which causes severe adverse impacts on both natural environment and human properties (Zieher et al. Citation2016; Arca et al. Citation2018). Vegetation cover on slopes is one of the most important forms of erosion control and slope stabilization (Stokes et al., Citation2010). Properly designed and planted vegetation on slopes plays an important role in preventing the long-term erosion and the movement of the shallow slope mass (Gyssels et al. Citation2005; Fattet et al. Citation2011). However, the vegetation on slopes may slough off before it starts to stabilize the slope soil. The support of the vegetation growth should be considered before developing the vegetation cover on slopes.
The soil treatment with vegetation provides a wide range of benefits from the mechanical and hydrologic factors (Osman and Barakbah Citation2006; Wu Citation2013; Dias et al. Citation2017). The vegetation cover reduces the impact of the raindrop and slows down the runoff velocity and the sediment transport. The dense root networks also act as a binder for soil particles and provide structural reinforcement by bonding the unstable soil mantles to the vegetation roots and the stable soils. The mechanical strengthening and structural integrity of the soil are therefore enhanced (Hytiris et al. Citation2015; Zhu et al., Citation2018; Su et al. Citation2020). The vegetation also alters the soil water conditions by increasing water infiltration into the soil, promoting the lateral percolation through the soil and accelerating the vertical evapotranspiration to the air (Sidle and Ochiai Citation2006; Ghestem et al. Citation2011; Stokes et al. Citation2014). The dense stems and resilient root systems of the vegetation also remove moisture from the soil and maintain the soil porosity. In addition, most of the vegetation covers are inexpensive, cover a large area on the slope, and look harmonious with the natural landscape for the esthetic consideration (Rivas Citation2006).
The mechanical treatment using geocell structures are generally used integrated with the vegetation method (Sato and Kojma Citation2018; Arvin et al. Citation2019). This is because the vegetation may slough off on mass with the collapse of the unstable soil (Acharya Citation2020; Song et al. Citation2021). The geocells reinforce the modified slope by holding the soil in position against erosion (Bouhicha et al. Citation2005; Wang et al. Citation2012). The use of reinforcement structures can stabilize the surface soil and support the vegetation growth. Wheat straws or other mulching materials can be secured to the slope surface to retard the water runoff. The straws also increase the biological activities in the soil and modify the level of available nutrients (Gyssels et al. Citation2005; Barré and Hallett Citation2009; Fattet et al. Citation2011). The decomposition of wheat straws increases the fertility by providing nitrogen or other nutrients in soil, maintains or increases the level of soil organic matter and fosters the vegetation establishment on the slope.
A number of physical and numerical models were developed to investigate the stability of root-reinforced slopes under artificial rainfall infiltration (Likitlersuang et al. Citation2017, Citation2020; Nguyen et al. Citation2020). Ngo et al. (Citation2019) conducted physical modeling tests to study the performance of a novel geosynthetic cementitious composite mat on sandy soil slopes under seepage conditions. The novel composite mat reduced the slope displacement by restricting the slope surface to the stable soil. The performance of the geosynthetic cementitious composite mat on soil erosion control was examined in a field test and compared to the performance of the vetiver grass (Likitlersuang et al. Citation2020). The novel material performed well for slope stabilization. The centrifuge was also utilized to study the mechanical reinforcement of a vegetation root matrix on soil slopes subjected to rainfall infiltration (Eab et al. Citation2014, Citation2015; Likitlersuang et al. Citation2017). The centrifuge models showed that the root bundle improved the slope stability by reducing the rainwater infiltration into the ground, delaying the increase in the groundwater table and increasing the shear strength of the slope soil (Eab et al. Citation2014, Citation2015). Numerical models were established to validate the physical modeling tests (Likitlersuang et al. Citation2017, Citation2020).
In the study, the authors utilized the physical small-scale models to study the soil erosion control of the geocell and wheat straw reinforced soil slope subjected to the rainfall infiltration. The influence of the rainfall intensities, slope inclination and the geocell size on the erosion control and slope stability was considered by assessing the amount of the soil erosion, slope displacement and the soil water content.
2. Materials and methods
2.1. Model description
In this work, a total of twelve physical small-scale models were developed and classified into 4 groups. The slopes were reinforced with two different sized geocells (the large and small geocells) to compare their reinforcement performance. The models were set up at two different slope ratios (rise/run) after construction, i.e. 1:1.5 for the steep slopes and 1:2.0 for the gentle slopes. The tilted slopes were placed under three rainfall intensities selected as 50 mm/h, 75 mm/h and 100 mm/h according to the rainfall conditions at the studied site in Yinchuan, Ningxia province. shows the details about the developed models in this research.
Table 1. Soil reinforcement and rainfall intensity for different models.
One of the most important aspects of the physical modeling test is the scaling law, according to which the physical features of the model and the full-scale case are similar in terms of geometry, density and strength. Therefore, the measurements in the physical model can be compared to the real case. A number of similarity principles were followed in this study. The geometry, density and strength similarity coefficients were selected as 1. The geocells utilized in the experiment to reinforce the slope models have the same dimensions with the field ones. The soils were compacted properly when constructing the physical models, so that the density and strength of the modeling slopes were as close to the real case as possible.
2.2. Model development
2.2.1. Modelling rig and modelling materials
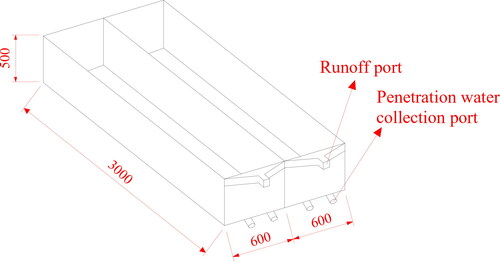
The physical small-scale slopes were constructed in a modelling rig shown in . The modelling rig is 3000 mm long, 1200 mm wide and 500 mm thick. A thin plate was placed in the center of the rig to include two separated models for direct comparison. Runoff ports were forged at the front side of the container to collect the rainwater from the slope surface. Four smaller ports at the lower section were used to gather the penetration of the rainwater from the bottom. The angle of the modelling rig can be easily adjusted to the design slope ratios by lifting the rear side of the container.
Figure 1. A schematic of the modelling rig for simulating slope soil erosion treatment.
The typical loess soil was collected from the studied site to construct the physical models in this study. The mechanical properties and the degradation of the soil are shown in and . Wheat straws were used to reinforce the top 10 cm of the slope soil. The wheat straws were collected from the current season and showed good resilience. The 5-mm diameter straws were cut to 3–5 mm long and fully mixed with the collected soil. To ensure the best reinforcement, the ratio of straw reinforcement (the ratio between the weight of wheat straws and the weight of the soil-straw mixture) was determined as 0.5%.
Table 2. Basic soil properties of the local soil from the studied site.
Table 3. Degradation of the local soil.
The regular-sized geocells used in this experiment are made from the high-density polyethylene. Two different sized geocells were selected to reinforce the slope models. The small geocell is 370 mm both in length and width and 150 mm in height. The large geocell is 445 mm long, 445 mm wide and 200 mm high. The sheet thickness is 1.0 mm. The tensile force per unit width of a single sheet is 245 N/cm, and the tensile force at the welding point is 109 N/cm. The tensile strain is 0.1.
2.2.2. Model construction
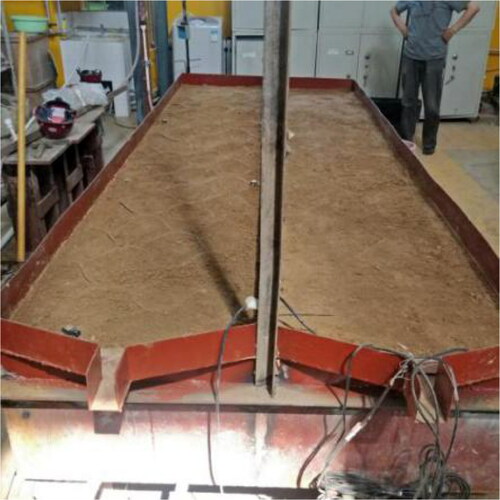
Before the model construction, efforts were made to reduce the friction between the slope soil and the container. A coated plastic film with low coefficient of friction was placed at the sides and bottom of the modelling rig. The movement of the physical model was restricted along the sides and the bottom (roller boundaries). A permeable geotextile was also expanded at the bottom to facilitate the water collection. To ensure an overall homogeneity and isotropy, the soil was fully mixed and deployed evenly into the modeling container in a layer-by-layer manner. Each layer was properly compacted to a designed height, which was carefully determined to ensure that the modelling physical slope had the same density with the field soil. The construction soil was also properly sprayed to maintain the optimum water content. Extra soil was swept from the slope to ensure an overall flatness. The constructed slope was 40 cm thick, and the top 10 cm of the slope was the soil-straw mixture coverage. The finished model is given in . The model was cured for 24 h before the artificial rainfall started.
Figure 2. A photo of the finished model after construction.
2.2.3. Rainfall simulation
The artificial rainfall simulation system was installed above the slopes. Five of the sprayers were uniformly distributed above the modelling rig, so that the entire area of the two slopes can be covered. The artificial rainfall system enables a simulation of rainfall intensity from 10 mm/h to 150 mm/h. The rainfall intensities selected in this work were determined based on the local rainfall conditions. The average annual precipitation in Guyuan is around 500–600 mm. Intense individual downpours for a relatively short time is not unusual especially in July and August. Sometimes, the rainfall intensity of the individual downpours can be extremely high. The measured heaviest rainfalls to occur in 24 hours and 1 hour were more than 110 mm and 50 mm, respectively. In this work, the rainfall intensities were calculated from EquationEq. (1)(1)
(1) developed from the studied site (Shao and Shao Citation2014).
(1)
(1)
where q is the rainstorm intensity in L/(s·ha); P is the return period in a; t is the duration of the rainfall in min. In this work, the return period was selected as 10 a and the rainfall duration as 5 min. The rainfall intensity on the studied site was calculated as 75 mm/h from EquationEq. (1)
(1)
(1) . Another two rainfall intensities of 50 mm/h and 100 mm/h were also included to study the influence of rainfall on the soil degradation and slope stability. The high level of rainfall intensities were selected in this study considering the worst-case scenario. The simulated rainfall continued for 30 min in each of the physical model.
2.3. Measuring system
2.3.1. Soil erosion measurement
During the test, the rainwater was collected at the runoff ports using a measuring cup. The volume (Vrunoffi) of the runoff (including rainwater and soil) was read at every 5 min. The mass (mrunoffi) of the runoff was measured using an electronic scale. The mass of the soil erosion was calculated from EquationEqs. (2)(2)
(2) and Equation(3)
(3)
(3) .
(2)
(2)
(3)
(3)
where mrunoffi is the mass of the collected runoff from the port (including rainwater and soil) at each collection, g; Vrunoffi is the volume of the collected runoff from the port (including rainwater and soil) at each collection, cm3; msoili is the mass of the soil from the ith collected runoff in g; Vsoili is the volume of the soil from the ith collected runoff in cm3; ρsoil is the density of the slope soil before rainfall and is selected as 2.7 g/cm3; ρwater is the density of water, 1 g/cm3; msoilaccum is the accumulated mass of the soil from total 6 collected runoffs, g; i is the number of runoff collected from the port, i = 1, 2, …, 6.
2.3.2. Slope displacement measurement
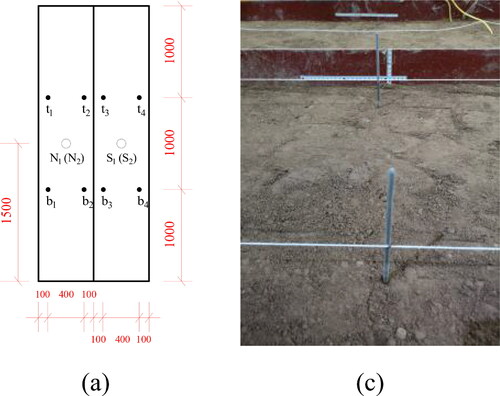
The displacement of the slope was recorded using the measuring rulers fixed on both sides of the modelling rig. gives a schematic of the top view of the modelling rig showing the placement of the steel rods, which were buried in the physical model at the designed positions (see the solid dots in ). The rods were allowed to migrate with the slope soil. The slope displacement was therefore represented by the movement of the rods. The rods on spots t1–t4 were used to record the slope displacement on the top section, while the bottom slope displacement was measured by the rods on spots b1–b4. The average displacement was used to represent the slope displacement on the top or bottom section. A marking string parallel to the rig length direction was also used to facilitate the displacement measurement (). The movement of the rods with the slope soil was clearly seen against the marking string. The slope displacement was read from the side rulers at every 5 min until 30 min after the cease of the rainfall.
Figure 3. Placement of measurements: (a) Schematic to show positions of marking rods and water content testing devices; (b) positioning rods and the marking string.
2.3.3. Water content measurement
The water content of the slope soil was measured using the SDI-12 moisture tester with a measuring range of 0 to 100% moisture content. The moisture content accuracy is ±2% within the moisture range of 0–53% and 3% within the range of 53%–100%. The resolution is 0.1%. The moisture testers were buried in the slope during construction. The positions of the devices can be found in . Two devices were used for each model. One of them was buried at 10 cm below the surface (N1 and S1 in ) and the other one at 20 cm depth (N2 and S2). The water content data was collected automatically at every one minute from the beginning of the experiment to 30 min after the rainfall.
3. Results and discussion
3.1. Slope failure characteristics
3.1.1. Development of slope failure with the rainfall
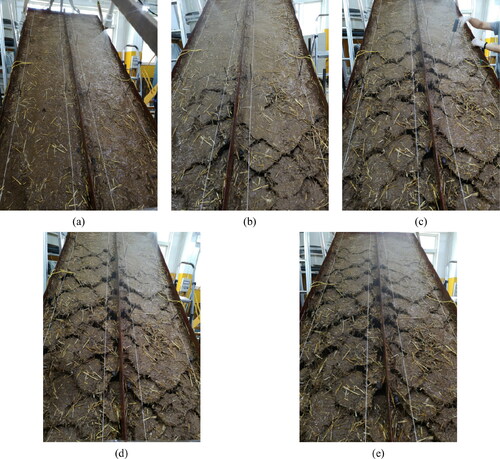
The progressive evolution of the slope failure is given in . The modelling rig shown in this figure was set up at a slope ratio of 1:1.5 and at a rainfall intensity of 100 mm/h. The right model was reinforced using small geocells and the left one with large geocells. The models turned wet shortly after the beginning of the rainfall, but the slopes remained the integrity and no failures were observed on the surface (). As the rainfall lasted for 10 min, soil degradation was seen at the toes of both slopes (). The raindrops continued to impact the slope surface and the area of the soil erosion extended upward gradually (). As a result, the rainwater took away the slope soil and the buried geocells reappeared. The reappearance of the buried geocells also implied that the depth of the soil degradation increased with the rainfall. On the other hand, it was interesting to note that the bottom section of the slope showed more damages, while the stability of the top slope was better off. This might be due to the fact that the bottom slope was adversely influenced by both the impact of raindrops and the flowing rainwater from the upper slope. The top section was only impacted by the raindrops. The soil deterioration was more severe after 23 min of rainfall (). The area of the reappeared buried geocells extended on the slope surface, indicating the loss of soil carried away by the rainwater. The most damaged slope was observed at the cease of the rainfall (), at which time the soil erosion reached the majority of the slope surface. The left model reinforced with large geocells was more damaged as compared to the small geocell reinforced slope.
Figure 4. Development of slope failure with the rainfall process: (a) 3 min; (b) 10 min; (c) 19 min; (c) 23 min and (e) 30 min. Slopes were reinforced with large (left) and small (right) geocells.
3.1.2. Final appearance of slope failures after rainfall
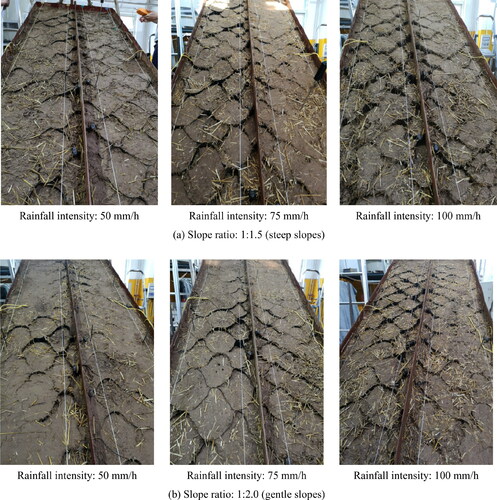
The final slope failure characteristics under different rainfall intensities are given in . The extent and the extension of the soil erosion were represented by the reappearance of the buried geocells. The soil erosion increased significantly with the rainfall intensity for both the steep and gentle slopes. The small geocell reinforced slopes (the right model in the container) showed better integrity and stability as compared to the large geocell reinforced models (the left model in the container). This is because the number of the small geocell sheets within the same volume of the slope soil is more than the large geocells due to the size difference. The slopes with small geocells are better reinforced with a larger reinforcement ratio (the ratio between the weight of geocell sheets and the weight of the soil). In terms of the slope inclination, the gentle slopes seemed to be better off, as the number and the depth of the reappeared geocells were less. The quantitative comparison of slope stability for different models will be discussed in the following sections.
Figure 5. Final appearance of the slope at the cease of rainfall under different rainfall intensities and slope ratios. Slopes were reinforced with large (left) and small (right) geocells.
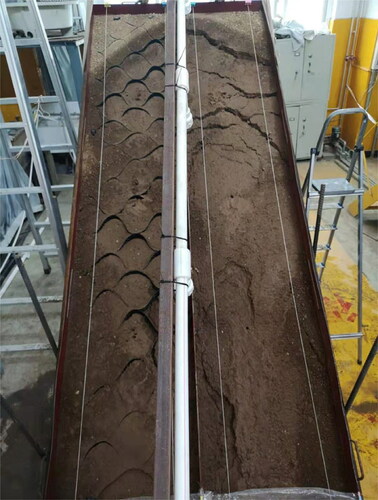
shows the final appearance of slope failures for a small geocell reinforced slope (left) and a bare slope (right). The slope ratio was set at 1:1.5 and the rainfall intensity was 50 mm/h for this model. A number of large-scale horizontal cracks were observed on the upper section of the bare slope; the small-scale rill erosion was seen at the lower part. The cracks were created because of the discrepancy in movement between the upper and lower sections. The rill erosion was formed because the rainwater dislodged the soil particles and carried them off the bare slope. The horizontal cracks and the soil erosion may eventually trigger landslides if no reinforcement actions were taken. By contrast, the geocell reinforced slope showed a good stability and only the sheet erosion was seen on the slope. This is because the geocell structures can effectively hold the soil in position and maintain the integrity of the slope.
Figure 6. Final appearance of the slope at the cease of rainfall. The left slope on the picture was reinforced using small geocell without wheat straw; the right model was the bare soil slope.
3.2. Amount of soil erosion
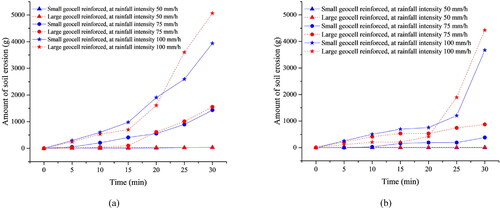
The measured amount of soil erosion during the rainfall is shown in . The soil erosion was kept at a very low level (less than 40 g) at the rainfall intensity of 50 mm/h. Under the 75 mm/h rainfall intensity, however, the soil erosion increased significantly and was measured at 1500 g for the steep models and 400–900 g for the gentle slopes. The soil erosion was extremely high as the rainfall intensity increased to 100 mm/h, i.e. 4000–5000 g and 3600–4500 g for the steep and gentle slopes, respectively. Therefore, the soil erosion increased dramatically with the rainfall intensity. It is inferred that the typical short duration intense rainfall in the studied site may considerably degrade the soil condition and cause severe soil erosion hazards. It was also noted that the gentle slope showed less amount of soil erosion and better stability. On the other hand, less amount of soil erosion was measured on the small geocell reinforced slopes (blue lines) than the large geocell reinforced slopes (red lines). The largest difference was 1000 g under the 100 mm/h rainfall intensity for the gentle slopes (), where the soil erosion for the large and small geocell reinforced slopes were around 5000 g and 4000 g, respectively.
Figure 7. Development of soil erosion for small and large geocell reinforced slopes at different slope ratios: (a) 1:1.5 and (b) 1:2.0.
3.3. Slope displacement
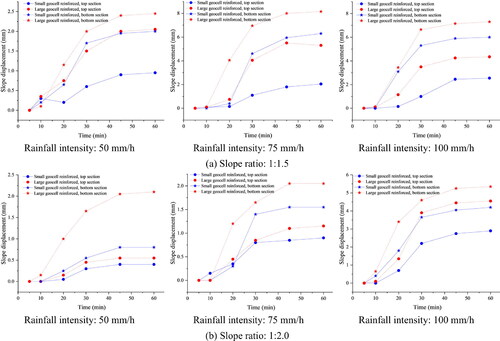
shows the slope displacement at the top and bottom sections. The slope displacement increased rapidly during the 30 min of the rainfall. The growth rate then slowed down and the slope displacement started to stabilize when the rainfall ceased. Therefore, the rainfall is a major factor to the slope displacement and a long-duration precipitation event could be detrimental to the slope stability if no additional efforts were made to reinforce the slope. The slope displacement also increased with the rainfall intensity. The final recorded slope displacement increased dramatically from 0.75 mm to 1.5 mm and 4 mm under the 50 mm/h, 75 mm/h and 100 mm/h rainfall intensities, respectively (see the bottom section of the small geocell reinforced models in ). On the other hand, the slope displacement decreased with the slope inclination. The largest displacement was observed at 8 mm at the bottom section of the steep slope (, the large geocell reinforced model at the 75 mm/h rainfall intensity), compared to only 2 mm for the comparative gentle slope (, same reinforcement and same rainfall intensity). Last but not the least, if small geocells were used to reinforce the slope, the displacement was commonly 1–2.5 mm less than the large geocell reinforced comparatives. The bottom section of the slopes displaced more than the top section.
Figure 8. Slope displacement under different rainfall intensities and slope ratios.
3.4. Soil water content
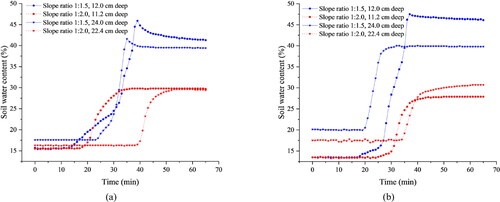
The development of soil water content is shown in . The water content was about 15–20% at the beginning of the test, and remained unchanged as the rainfall continued for 10–40 min. It seemed that the small geocell reinforced slopes maintained the fixed initial water content for a longer time than the large geocells reinforced slopes. This is because a greater number of small geocell sheets were buried in the slope, and the tilted geocell sheets may slow down the rainwater infiltration. The water content then increased rapidly and stabilized at the maximum level slightly after the cease of the rainfall. The most significant difference in soil water content was observed between the steep and gentle slopes, where the steep slopes showed a water content at 40–50% (blue curves) and the gentle slopes at 30% (red curves). It should be noted that the vertical depth of the soil moisture testers were different when the container was placed horizontally and when it was tilted. The sensors were originally buried at 10 cm and 20 cm deep below the surface during the model construction. When the modeling rig was tilted, however, the real depths were changed to 11.2 cm and 22.4 cm below the surface for the gentle slope, and 12.0 cm and 24.0 for the steep slopes. As a result, the water content data were not compared under the exact same positions. Despite this slight discrepancy, the measured water contents of the steep slopes were 10%-20% more than the gentle slopes. In a future study, this limitation should be considered and the soil water content tester will be placed vertically to the slope soil only after the container is tilted.
Figure 9. Variation of the soil water content with time for (a) small and (b) large geocell reinforced slopes.
4. Summary and conclusions
This study proposed a composite soil treatment method for soil treatment and slope stabilization using the geocell structures and the wheat straws. A total of twelve physical models were prepared in this study to assess the slope stability under different rainfall intensities, slope steepness, and geocell reinforcement sizes. The development of slope failures, the soil erosion, surface displacement and the water contents were recorded and assessed. The geocells maintained the integrity of the slope surface and the wheat straws retarded the surface runoff. The combined reinforcement method mitigated the soil erosion and reduced the risk of landslide. Important findings are listed below.
The bare slope showed a number of horizontal cracks at the upper section, while the geocell and wheat straw reinforced slopes maintained a good integrity. The measured soil erosion was 4000 g and 5000 g for the small and large geocell reinforced steep slopes under the 100 mm/h rainfall. The small geocell reinforced models showed 1–2.5 cm smaller slope displacement. The small geocells outperformed the large geocells in terms of the erosion control and slope stabilization due to a larger reinforcement ratio.
The soil erosion gradually extended on the slope surface as the rainfall continued. The slope failures also increased dramatically with the rainfall intensity. The measured amount of soil erosion quadrupled or even quintupled as the rainfall intensity increased from 75 mm/h to 100 mm/h. The slope displacement tripled with an increase of rainfall intensity from 50 mm/h to 100 mm/h.
The gentle slopes maintained a better integrity than the steep slopes. The largest measured soil erosion was 4500 g for the gentle slope and more than 5000 g for the steep slope. The gentle slopes showed a largest slope displacement of 5.5 cm, but the largest observed displacement for the steep slope was 8 cm. The soil water contents after the rainfall were 30% and more than 40% for the gentle and steep slopes, respectively.
Consent to participate
Informed consent was obtained from all individual participants included in the study.
Consent for publication
The participant has consented to the submission of the case report to the journal.
Data availability statement
The data used to support the findings of this study are included within the article.
Disclosure statement
The authors declare that there are no conflicts of interest.
Additional information
Funding
References
- Acharya MS. 2020. Bamboo crib wall: a sustainable soil bioengineering method to stabilize slopes in Nepal. J Dev Innov. 4:99–118.
- Arca D, Kutoğlu HŞ, Becek K. 2018. Landslide susceptibility mapping in an area of underground mining using the multicriteria decision analysis method. Environ Monit Assess. 190(12):725.
- Arvin MR, Zakeri A, Shoorijeh MB. 2019. Using finite element strength reduction method for stability analysis of geocell-reinforced slopes. Geotech Geol Eng. 37(3):1453–1467.
- Barré P, Hallett PD. 2009. Rheological stabilization of wet soils by model root and fungal exudates depends on clay mineralogy. Eur J Soil Sci. 60(4):525–538.
- Bouhicha M, Aouissi F, Kenai S. 2005. Performance of composite soil reinforced with barley straw. Cem Concr Compos. 27(5):617–621.
- Dias AS, Pirone M, Urciuoli G. 2017. Review on the methods for evaluation of root reinforcement in shallow landslides. In Workshop on world landslide forum. Cham: Springer. p. 641–648.
- Eab KH, Likitlersuang S, Takahashi A. 2015. Laboratory and modelling investigation of root-reinforced system for slope stabilization. Soils Found. 55(5):1270–1281.
- Eab KH, Takahashi A, Likitlersuang S. 2014. Centrifuge modelling of root-reinforced soil slope subjected to rainfall infiltration. Géotech Lett. 4(3):211–216.
- Fattet M, Fu Y, Ghestem M, Ma W, Foulonneau M, Nespoulous J, Le Bissonnais Y, Stokes A. 2011. Effects of vegetation type on soil resistance to erosion: relationship between aggregate stability and shear strength. Catena. 87(1):60–69.
- Ghestem M, Sidle RC, Stokes A. 2011. The influence of plant root systems on subsurface flow: implications for slope stability. Bioscience. 61(11):869–879.
- Gyssels G, Poesen J, Bochet E, Li Y. 2005. Impact of plant roots on the resistance of soils to erosion by water: a review. Prog Phys Geogr. 29(2):189–217.
- Hess DM, Leshchinsky BA, Bunn M, Benjamin Mason H, Olsen MJ. 2017. A simplified three-dimensional shallow landslide susceptibility framework considering topography and seismicity. Landslides. 14(5):1677–1697.
- Hytiris N, Fraser M, Mickovski SB. 2015. Enhancing slope stability with vegetation. Int J Geomate. 9:1477–1482.
- Likitlersuang S, Kounyou K, Prasetyaningtiyas GA. 2020. Performance of geosynthetic cementitious composite mat and vetiver on soil erosion control. J Mt Sci. 17(6):1410–1422.
- Likitlersuang S, Takahashi A, Eab KH. 2017. Modeling of root-reinforced soil slope under rainfall condition. Eng J. 21(3):123–132.
- Löbmann MT, Geitner C, Wellstein C, Zerbe S. 2020. The influence of herbaceous vegetation on slope stability – A review. Earth-Sci Rev. 209:103328.
- Ngo TP, Likitlersuang S, Takahashi A. 2019. Performance of a geosynthetic cementitious composite mat for stabilising sandy slopes. Geosynth Int. 26(3):309–319.
- Nguyen TS, Likitlersuang S, Jotisankasa A. 2020. Stability analysis of vegetated residual soil slope in Thailand under rainfall conditions. Environ Geotech. 7(5):338–349.
- Osman N, Barakbah SS. 2006. Parameters to predict slope stability—Soil water and root profiles. Ecol. Eng. 28(1):90–95.
- Rivas T. 2006. Erosion control treatment selection guide. National Technology & Development Program, U.S. Department of Agriculture, Forest Service.
- Sato T, Kojma K. 2018. Development of slope protection work using geocell and soil nailing. Jpn Railw Eng. 202:1–3.
- Shao YM, Shao DN. 2014. Updated rainstorm intensity formula in China. Beijing: China Architecture and Building Press. (In Chinese).
- Sidle RC, Ochiai H. 2006. Landslides: processes, prediction, and land use. Water Resources Monogr 18. Washington, DC: American Geophysical Union.
- Song XR, Huang MS, He SQ, Song GF, Shen RZ, Huang PZ, Zhang GF. 2021. Erosion control treatment using geocell and wheat straw for slope protection. Adv Civil Eng. 2021:1–12.
- Stokes A, Douglas GB, Fourcaud T, Giadrossich F, Gillies C, Hubble T, Kim JH, Loades KW, Mao Z, McIvor IR, et al. 2014. Ecological mitigation of hillslope instability: ten key issues facing researchers and practitioners. Plant Soil. 377(1–2):1–23.
- Stokes A, Sotir R, Chen W, Ghestem M. 2010. Soil bio- and eco-engineering in China: past experience and future priorities. Ecol. Eng. 36(3):247–257.
- Su L-j, Hu B-l, Xie Q-j, Yu F-w, Zhang C-l. 2020. Experimental and theoretical study of mechanical properties of root-soil interface for slope protection. J Mt Sci. 17(11):2784–2795.
- Wang GY, Han Y, Wang XH. 2012. Stability analysis of geocell flexible slope protection in rainfall. Rock Soil Mech. 33:3020–3024. (In Chinese).
- Wu TH. 2013. Root reinforcement of soil: review of analytical models, test results, and applications to design. Can Geotech J. 50(3):259–274.
- Zieher T, Perzl F, Rössel M, Rutzinger M, Meißl G, Markart G, Geitner C. 2016. A multi-annual landslide inventory for the assessment of shallow landslide susceptibility – two test cases in Vorarlberg, Austria. Geomorphology. 259:40–54.
- Zhu H, Hu X, Li Z, Song L, Li K, Li X, Li G. 2018. The influences of Riparian vegetation on bank failures of a small meadow-type meandering river. Water. 10(6):692.