
 ?Mathematical formulae have been encoded as MathML and are displayed in this HTML version using MathJax in order to improve their display. Uncheck the box to turn MathJax off. This feature requires Javascript. Click on a formula to zoom.
Abstract
Severe flood events in the trans-boundary Shatt Al-Arab basin (Iraq-Iran) claim hundreds of human lives and cause damage to the economy and environment. Therefore, developing a flood hazard model to recognize the basin’s susceptible areas to flooding is important for decision makers for comprehensive flood risk management. The flood hazard map was prepared using geographical information systems (GIS) and multi-criteria decision analysis (MCDA) along with the application of analytical hierarchy process (AHP) method to identify the optimal selection of weights for the factors that contribute to flood risk. The flooding causative factors used in this study were rainfall, distance to the river, digital elevation model (DEM), slope, land use/land cover (LULC), drainage density, soils, and lithology. The derived flood hazard map consisted of four distinct categories (zones). These zones that depict high, intermediate, low, and very low flood hazard cover around 20%, 40%, 39%, and 2% of the basin area, respectively. The produced flood hazard map was further verified using a historical flood event in the study area. The results were found to be consistent with the historical data of flood events, revealing the model’s effectiveness in the realistic representation of flood hazard mapping.
1. Introduction
Floods are one of the most recurring and devastating natural hazards threatening life and economy (Khan et al. Citation2011; Ghosh and Kar Citation2018). Floods are becoming more intense owing to the anthropogenic activities that result in land use change (Wheater and Evans Citation2009; Barasa and Perera Citation2018) and climate change (Detrembleur et al. Citation2015; CitationTabari 2020). Floods are natural hazards that are unavoidable and anticipated to be more acute in the future (Charlton et al. Citation2006; Khosravi et al. Citation2016), and are expected to threaten many regions worldwide (Jonkman and Dawson Citation2012; Khosravi et al. Citation2020). The present trends and future flood hazards scenarios thus require detailed spatial and temporal information on the potential dangers of flooding (Ouma and Tateishi Citation2014). Therefore, assessing flood risks and adoption of proper management and mitigation strategies can considerably reduce the related hazards. Delineation of flood hazard zones and application of the appropriate mitigation measures can substantially minimize flood-induced damages (EU Flood Directive Citation2007; Naulin et al. Citation2013; Guo et al. Citation2014). Furthermore, flood hazard mapping plays a vital role in land use planning, early warning systems, emergency response design, and flood risk reduction measures (Naulin et al. Citation2013; Zhang and Chen Citation2019).
The Shatt Al-Arab basin, a trans-boundary basin extended over the territories of Iraq and Iran, is one of the heavily populated regions in the Middle East that is repeatedly affected by floods. Such floods cause enormous damage to human life, infrastructure, and the environment (Yousefi et al. Citation2018; United Nations Office for the Coordination of Humanitarian Affairs Citation2019a; United Nations Office for the Coordination of Humanitarian Affairs Citation2019b). Various hydro-geomorphic features of the basin, such as the prevailing flat riverine topography and escalating injudicious urbanization without due regard to upgrading the drainage system, have aggravated the flood situation in the riverine plains and deltaic areas of the basin. In developing countries such as Iraq and Iran, inefficient maintenance of the drainage systems and solid waste discharged into such systems lead to blockages in drainage channels, reduce their conveyance capacity, and induce flooding. At the slope scale, Comino et al. (Citation2018) found that the upper parts of a river are the sources of sediments that accumulated in the lower parts, and the middle parts represent transition-transport regions. For example, high sedimentation rates in Basra Governorate that situated in the lower parts of the Shatt Al-Arab often cause drainage systems blockage (Ministry of Municipalities and Public Works, Iraq 2015) and consequently promote flooding. Furthermore, climate change is expected to increase both the frequency and intensity of floods, thus exacerbating the basin’s existing flood risks (Yadollahie Citation2019). When developing countries encounter natural disasters such as floods, they will be more vulnerable than developed countries. Developing countries often take a longer time to recover from catastrophes because they do not have sufficient resources to repair property damages (Vocal 2020). The situation becomes more complicated if the country is already in a state of conflict and instability like Iraq or under sanctions and isolation like Iran.
Flood risk assessment using numerical models (Dutta et al. Citation2007; Liu et al. Citation2012) is a popular method for flood risk analyses. Hydrological and hydrodynamic models are broadly applied for flood assessment with respect to magnitude, extent, and frequency of floods (Smith Citation1994; Anselmo et al. Citation1996; Booij Citation2005; Myronidis et al. Citation2009; Liu et al. Citation2012; Kuldeep et al. Citation2016; Ullah et al. Citation2016). Hydrological models, such as the Normal Distribution or P-III Distribution, deal mainly with the line-type distribution of floods (Zhang and Xu Citation2002; Shi Citation2003). The runoff yield model, another hydraulic model, mainly investigates flood routing issues of water courses (Cheng et al. Citation1996; Zhang et al. Citation2003; Su et al. Citation2005). These quantitative models can process numerous data and reflect significant information about flood risk (Wang et al. Citation2011). However, the most common and challenging issue in such methods is the paucity or lack of hydro-meteorological data (Cabrera and Lee Citation2019). Like other developing countries, Iraq and Iran are characterized by a scarcity of good quality data on which flood risk assessment can be based.
Numerous studies have used GIS-based multi-criteria decision analysis (MCDA) to assess index-based flood hazards through investigating the role of factors controlling floods (Kazakis et al. Citation2015; Papaioannou et al. Citation2015; Wu et al. Citation2015; Xiao et al. Citation2016; Hazarika et al. Citation2018). The GIS-MCDA technique utilizes the capabilities of GIS in the processing of geospatial data and the adaptability of MCDA to merge factual data (e.g. rainfall, land use, soil, slope, drainage density) with value-based data (e.g. expert opinions) (Yahaya et al. Citation2010; Wang et al. Citation2011; Stefanidis and Stathis Citation2013; Zou et al. Citation2013; Gigović et al. Citation2017; Rimba et al. Citation2017; Seejata et al. Citation2018). GIS-based MCDA investigates complex decision issues by arranging the controlling parameters in a hierarchical way (Chen et al. Citation2011). de Brito and Evers (Citation2016) found that most of the studies that applied the GIS-based MCDA technique have integrated this technique with the analytical hierarchy process (AHP) method (Wang et al. Citation2011; Madhuri et al. Citation2013; de Brito and Evers Citation2016). AHP is an efficient method that can be used to partition multiple parameters into a group of pairwise comparisons followed by integrating the result (Saaty Citation1980a, Citation1980b). Multi-disciplinary decision makers have demonstrated that incorporation of GIS with AHP in the MCDA framework approach is effective in various studies related to natural hazard evaluation such as flood hazard mapping (Fernandez and Lutz Citation2010), soil erosion hazard mapping (Kachouri et al. Citation2015), landslide susceptibility mapping (Feizizadeh et al. Citation2013), and groundwater potential zoning (Arshad et al. Citation2020). The effectiveness of such an approach (i.e. integration of GIS with AHP in MCDA framework) in hazard mapping is mainly due to its ability to deal with data scarcity (Cabrera and Lee Citation2019). The most common parameters used in flood hazard mapping were rainfall, distance to the river, digital elevation model (DEM), slope, land use/land cover, drainage density, soil, and lithology (). Parameters are often selected based on comprehensive literature review, and their weights are assigned according to expert knowledge using AHP method (Bisson and Lehr Citation2004; Naghibi et al. Citation2015; Mallick et al. Citation2019; Arshad et al. Citation2020; Kumar et al. Citation2020).
Table 1. Literature review of the parameters used to depict flood hazard zones (FHZ).
Therefore, the purpose of this study is to develop a mesoscale regional flood hazard map for the Shatt Al-Arab basin using the GIS-AHP technique in the MCDA framework. We used the GIS-MCDA approach to implement this model using eight criteria: rainfall, distance to the river, DEM, slope, land use/land cover, drainage density, soil, and lithology. The project results can provide managers and policymakers with a more integrated analysis and clear guidelines for designing early warning systems, emergency response procedures, flood hazard reduction measures, and indicating where further development should be avoided or controlled. Satellite images from Moderate Resolution Imaging Spectroradiometer (MODIS) were used for extracting surface water bodies for validation.
2. Study area
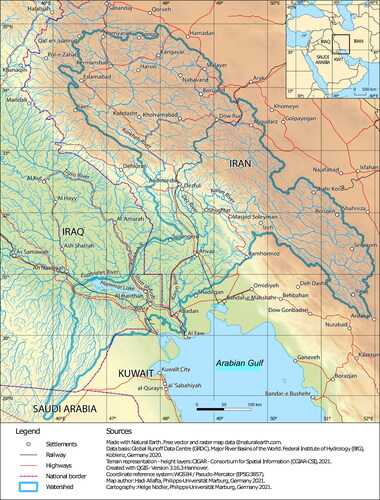
The Shatt Al-Arab basin encompasses the Euphrates and Tigris basins and the Karkheh and Karun sub-basins (). The Shatt Al-Arab River, formed by the convergence of the Euphrates and Tigris rivers at Qurna city, surges for around 100 km to the southeast before it constitutes a natural border between Iraq and Iran for the remaining 91 km of its course until pouring into the Arabian/Persian Gulf (the gulf henceforth). The total area draining to the river is approximately 143,000 km2, excluding the Euphrates and Tigris basins, but encompassing the Karkheh and Karun sub-basins. The Karun River originates from the Zagros Mountains in Iran, surges to the west, and proceeds towards the Shatt Al-Arab River (UN-ESCWA and BGR Citation2013). The Karkheh River also stems from the Zagros Mountains, runs to the south, turns northwest, empties into the Hawizeh Marsh, flows into the Swaib River, and ultimately empties into the Shatt Al-Arab River. The trans-boundary Shatt Al-Arab basin that is distributed over Iraq and Iran is extended on both the Mesopotamia Zone and Zagros Structural Zone. The Mesopotamia Zone, that is primarily overlaid by Quaternary deposits, comprises three sub-zones; Euphrates, Tigris, and Zubair sub-zones (Buday and Jassim Citation1984). The Zubair sub-zone is situated within the Shatt Al-Arab basin while the Euphrates and Tigris sub-zones are extended outside the basin. The Zubair sub-zone is distinguished mainly by detrital lithology, whereas limestone is situated in its upper areas (Aqrawi et al. Citation2010). The Zubair sub-zone is characterized by stretched anticline folding with general N-S to NW-SE directions representing the main oil fields in southern Iraq (Al-Musawi et al. Citation2019). These folds have an exposure to the basement rocks affected by faulting (Idan et al. Citation2019). The Zagros Structural Zone, on the other hand, is defined by thick sedimentary strata with an age range from Cambrian to Recent. The geological surveys show that the region was influenced by rifting actions during the period from Permian to Triassic, and colliding during the Tertiary (Berberian and King Citation1981). The Zagros mountain ranges constitute synclines and anticlines arranged ‘en-echelon’. The anticlines’ core comprises Cretaceous dolomite and limestone in the western areas, and composed of Eocene limestone in the center. In the marginal western areas, the anticlines compose mostly of Oligocene-Miocene limestone and Miocene marl (Issar Citation1969). The climate in the western part of the study area is essentially arid and hot, with average temperature ranges from 8 °C in winter to 43 °C in summer, and annual precipitation ranges of 100–175 mm (TAVO Citation1985; Country Data Info Citation2020). On the other hand, the eastern parts of the basin, are distinguished by cold winter and mild summer. Average temperature ranges from −24 °C in winter to 38 °C in summer, and annual precipitation varies from 100 to 500 mm (Country Data Info Citation2020). The study area population is around 12 million, with an annual population growth rate of 2.6%. The total annual discharge of the Shatt Al-Arab River into the gulf is approximately 75 billion cubic meters (BCM). The total annual discharge is estimated as the following: the Tigris River of 25.8 BCM (gauged at the city of Kut); the Karun River of 24.6 BCM; the Euphrates River of 17.6 BCM (gauged at the city of Hindeyah); and the Karkheh River of 5.8 BCM (UN-ESCWA and BGR Citation2013).
Figure 1. Study site.
3. Methods
3.1. Analytic hierarchy process (AHP)
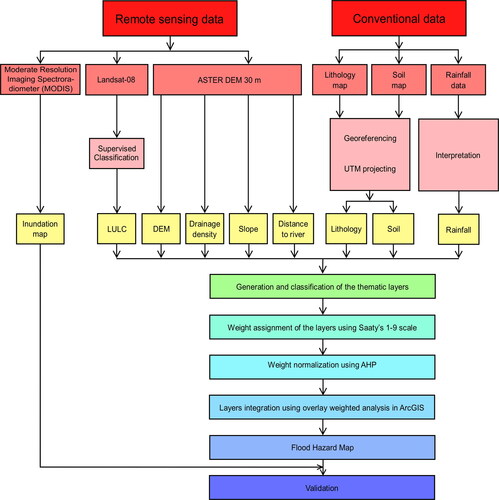
The present study is based on the collection of RS and GIS data for generating the flood hazard map. Eight controlling factors were selected for preparing the flood hazard map. The thematic maps of these factors were examined by the AHP technique applying normalized weights to assess the flood hazard map of the Shatt Al-Arab basin. The implementation of AHP requires scientific expertise, strong evidence, and evaluation of matrix consistency (Riad et al. Citation2011; Awawdeh et al. Citation2014; Saaty Citation2014). Similar to Ghosh and Kar (Citation2018), we applied the AHP method by selecting flooding hazard factors, allocating relative scores, conducting a pairwise comparison matrix, and assessing the matrix consistency ().
Figure 2. Flowchart for the identification of flood hazard zones (FHZs).
3.1.1. Selection of flooding hazard factors
To assess the flood hazard, various flood stimulating and causal parameters and their relations with flooding should be investigated (Radmehr and Araghinejad Citation2015; Sahana and Patel Citation2019). Different flood controlling parameters have been used in previous flood hazard mapping studies (Das Citation2018; Dou et al. Citation2018; Samanta et al. Citation2018). Although there is no consistency on selecting flood-controlling factors and their related significance, researchers select the flood-controlling factors depending on physical and natural properties of the study area. In the present study, we selected eight flood causative factors based on comprehensive literature review (e.g. ). These factors are rainfall, distance to the river, elevation, slope, LULC, drainage density, soils, and lithology. To prepare the flood susceptibility map for the Shatt Al-Arab basin, multiple satellite images and ancillary datasets were obtained from web sources. We converted these layers into raster format and reclassified them using the ‘Reclassify’ command under the ‘Spatial Analyst Tools’ in ArcGIS 10.4.1.
The literature review displayed that rainfall plays a major role in the evolution of flood, and therefore was selected as one of the flood controlling parameters. The annual mean rainfall of the study area for the period from 2011 to 2018 was collected from the Climate Research Unit (www.cru.uea.ac.uk/data). We converted the rainfall data to a raster layer applying ‘Multidimensional Tools’ and ‘Make NetCDF Raster Layer’ in ArcGIS 10.4.1. The raster layer was the converted to points applying ‘Conversion Tools’, ‘From Raster’, and ‘Raster to point’. Then, we entered the obtained points in ‘Spatial Analyst Tools’ ‘Interpolation’, and ‘Kriging’ to generate the basin rainfall map. Likewise, based on such reviews, we chose distance to the river as another important parameter because the occurrence of flood disaster is related to the river network distribution. Distance to the river was determined using the tool “Euclidean Distance” in ArcGIS 10.4.1 to classify the distance to the river into five zones. We measured the distance to the rivers of Karun, Karkheh, and Shatt Al-Arab as these rivers represent the main perennial rivers in the study area. The elevation is the fundamental demonstration of the topographic characteristics. In various studies on flood hazard evaluation, DEM was used as a significant assessment parameter (Sarker and Sivertun Citation2011). Hence, elevation was chosen as one of the important factor in the analysis. DEM data were acquired from EARTHDATA Search (https://search.earthdata.nasa.gov/search) by delineating the Shatt Al-Arab basin and choosing ‘Advanced Spaceborne Thermal Emission and Reflection Radiometer (ASTER) Global DEM V003’. Images from (ASTER) Global DEM data of 30 m resolution were downloaded. Then, we added these images to ArcGIS 10.4.1 and combined (mosaic) them. Next, the UTM zone was identified, and the merged map was re-projected. Slope, a degree of elevation variability in adjacent grid cells, plays an important role in flooding as it influences the velocity of water flow (Wu et al. Citation2015; Rahman et al. Citation2019), and hence was selected as another flood-inducing parameter in the current analysis. The ASTER DEM data have been utilized to estimate the basin’s slope gradient using ArcGIS 10.4.1 environment. LULC directly influences interception, infiltration, underground seepage, and evapotranspiration (Yan et al. Citation2013; Deng et al. Citation2015) and, therefore, indirectly impact flooding (Rahman et al. Citation2019). LULC was chosen as another important parameter in the hierarchy. We extracted the LULC data from land cover data on the Earth Explorer (https://earthexplorer.usgs.gov/). We selected the options ‘Land Cloud Cover’ and ‘Scene Cloud Cover’ of less than 10% to retrieve images with minimal cloud covers. The obtained images were added to ERDAS IMAGINE 2014 for processing and enhancement. We classified the LULC through the supervised classification in ERDAS IMAGINE. The supervised classification includes selecting and digitizing polygons and placing them in an ‘Area of Interest’ layer to produce signature files. Several polygons for a specific LULC type were generated to make this LULC a specific class. The supervised classification technique is time-consuming, however, it produces a high general accuracy than the unsupervised classification (Enderle and Weih Citation2005) . Drainage density, a flood controlling factor in our analysis, influences the concentration time of runoff and hence represents a proportional criterion for flow accumulation pathways and flooding probability (Islam and Sado Citation2000; Sauer Citation2002; Schmitt et al. Citation2004). Drainage density in the present study was estimated using the tool ‘Density’ in ArcGIS 10.4.1. Soil properties play an important role in identifying the region’s water holding properties, and hence affect water infiltration (Rahmati, Pourghasemi, et al. Citation2016) and flood susceptibility (Nyarko Citation2002; Opp Citation2004; Todini et al. Citation2004). Therefore, soil properties were chosen as another parameter in the current analysis. We extracted the basin’s soil map from Geo Network Web Portal for Food and Agriculture Organization (FAO) Soil Map (http://www.fao.org/geonetwork/srv/en/metadata.show%3Fid=14116). Moreover, soil types were retrieved from the SWAT Soil archive (http://www.indiaremotesensing.com/p/s.html). Then, we added the soil map to ArcGIS 10.4.1 and geo-referenced it to the related UTM projected coordinate system. The soil map was then geo-coded to each soil category based on the categories gained from the SWAT Soil archive. The lithology of a region can maximize or minimize the magnitude of flood events as it controls the water infiltration capacities and consequently affects flood susceptibility (Nyarko Citation2002). Lithological units were selected as one of the influential factor in the current analysis. The lithological map of the study area of 1/3,750,000 resolution was obtained from the University of Hamburg to describe the lithology in the basin (Jaeppinen Citation2020).
3.1.2. Pairwise comparison matrix
The experts investigated in the current study were hydrologists, geomorphologists, remote sensing experts, and engineers. A table questionnaire was sent to each expert for collecting risk judgments in flood risk evaluation. The table consists of the eight flood causative parameters (i.e. rainfall, lithology, drainage density, DEM, LULC, slope, soil, and distance to the river). The expert is asked to pick one parameter (e.g. rainfall) and compare it with the other parameters one by one (which parameter is more important? And how much the importance according to the Saaty’s 1–9 scale ()?), and so on for rest of parameters (Goepel, Citation2013). These tables were then incorporated in an excel template established by Goepel (Citation2013) (https://bpmsg.com/new-ahp-excel-template-with-multiple-inputs/). This template automatically creates a (8 × 8) pairwise comparison matrix for the AHP-based flood hazard mapping ().
Table 2. The 1–9 scale of factors importance (Saaty Citation1980a).
Table 3. A (8 x× 8) pairwise comparison matrix for the AHP-based flood hazard mapping.
3.1.3. Assessing matrix consistency
The principal eigenvalue (λmax) indicates the matrix deviation from consistency (Brunelli Citation2015). A pairwise matrix is consistent only when the λmax is equal or higher than the number of the parameters investigated (eight parameters in the current study); or else, a new matrix should be generated (Saaty Citation1980a, Citation1980b). We achieved the λmax in by the summation of products of the sum of parameter columns in the pairwise matrix in and the eigenvectors in . A principal eigenvalue of 8.14 for an 8*8 matrix was achieved and applied to calculate of the consistency measure ().
Table 4. Calculation of the principal Eigenvalue (λmax) to rank parameter influence.
The consistency of normalized weight was checked by calculating the consistency ratio (Machiwal et al. Citation2015). The assigned weights are considered consistent only when the consistency ratio is equal or smaller than 10%; otherwise, these weights should be re-evaluated to reduce inconsistency (Saaty Citation1990). According to Saaty (Citation1980b), the calculation of the consistency ratio requires computing the consistency index (CI):
(1)
(1)
where λmax represents the principal eigenvalue, and n denotes the number of thematic layers. Hence, the CI in the present study equals:
CI = (8.14 − 8)/8 − 1 = 0.02
The consistency ratio (CR) was calculated using the following equation:
(2)
(2)
where RI denotes the random index which is listed in for various n parameters. In the present study, RI is 1.41 for eight factors. Therefore, CR equals:
Table 5. Saaty's ratio index for different n values (Saaty Citation1980a).
CR = 0.02/1.41 = 0.014 = 1.4%
CR of 1.4% (less than 10%) is acceptable to perform the weighted overlay calculations to incorporate the weighted parameters for the flood hazard zoning.
3.2. Identification of flood hazard zones
During the analysis, weight scores were allocated to the thematic layers and their classes according to their significance in flood vulnerability. We assigned weights to the layers/classes based on experts knowledge ( and ). Total scores were then computed using a simple weighted sum. Each pixel of the output map (Hi) (Das Citation2018) was calculated using the following equation:
(3)
(3)
where, Xij denotes the rank score of each class with respect to the j layer, and Wj represents the normalized weight of the j layer.
Table 6. Assigned weight and rank scores for the layer/class of the Shatt Al-Arab basin.
3.3. Validation
Although some studies have attempted to verify flood maps with historical data of flood events at some selected locations (Kazakis et al. Citation2015; Wu et al. Citation2015), location-based data are not adequate to verify the MCDA-based flood hazard map. On the other hand, spatial maps of historical floods can be a suitable alternative for verification (Dash and Sar Citation2020). Therefore, freely available multispectral imageries like Satellite images from MODIS are appropriate for extracting surface water bodies (Khaing et al. Citation2019). In areas where rivers and streams pass through international borders, MODIS flood detection capabilities effectively provide consistent and validatable information (Brakenridge and Anderson Citation2006). MODIS imagery has been successfully used in preparing flood extent maps, and it was proven that the availability, periodicity, and coverage of MODIS are effective in assessing large scale flood hazard maps (Dottori et al. Citation2016). Satellite data were analyzed to determine the flood-prone areas in the Shatt Al-Arab basin. Data from MODIS/006/MOD09GA were obtained for 21 March 2018 (pre-flood) and 21 March 2019 (post flood) to validate the prepared flood hazard map of the study area.
4. Results and discussion
4.1. Flood AHP hazard mapping
Flooding is considered a natural phenomenon that can cause severe damages (Danumah et al. Citation2016). In the present study, eight thematic layers (i.e. rainfall, distance to the river, elevation, slope, LULC, drainage density, soil, and lithology) have been generated to depict the flood hazard zones in the Shatt Al-Arab basin. These eight layers were investigated and digitally mapped with the aid of ArcGIS. The layers were used to demonstrate: rainfall as the main source of water; distance to the river which determines the effective infiltration zones; elevation, which has a main role in governing the movement of the overflow direction and the depth of the water level (Ogato et al. Citation2020); slope, which controls the water flow potency; LULC which influences the recharge processes; drainage density, which controls the runoff partition and infiltration rate; soil features which govern the infiltration rate; and lithology which governs water infiltration, transportation, and storage (Awawdeh et al. Citation2014).
4.2. Factors influencing flood hazard zoning
4.2.1. Rainfall
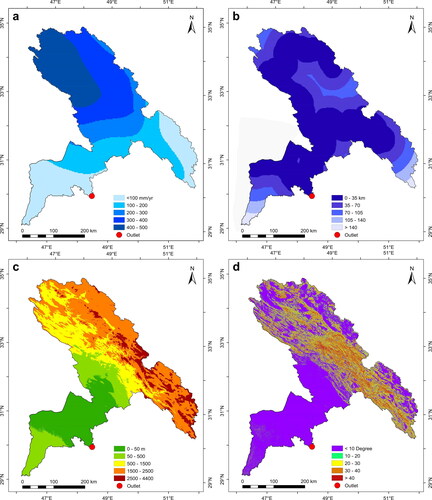
More extreme rainfall causes more likelihood of flooding, particularly flash flooding (Few et al. Citation2004; Guo et al. Citation2014). The general trend of the mean annual rainfall in the basin exhibits the highest levels in the northern parts (400–500 mm yr−1), and displays a southwards gradient towards the sea. Rainfall is a major triggering factor for flood generation (Subbarayan and Sivaranjani Citation2020) since it directly relates to river discharge (Das Citation2018). In semi-arid regions, large amounts of rainfall in a short time can produce floods (Chakraborty and Mukhopadhyay Citation2019; Das Citation2019; Liuzzo et al. Citation2019; Paul et al. Citation2019). Therefore, the four rainfall classes outlined in the basin (i.e. 500–400, 400–300, 300–200, and 200–<100 mm yr−1) () were allocated, high, moderate, low, and very low ranking, respectively, in parameters ranking for flood hazard (). Clearly, the northern parts of the basin are the most vulnerable parts to flooding compared to the southern parts.
Figure 3. The study area’s (a) annual rainfall, (b) distance to rivers, (c) Digital Elevation Model (DEM), and (d) Slope.
4.2.2. Distance to the river
When flooding occurs, the closer the area to the river course are the more vulnerable areas to flooding (Fernández and Lutz 2010; Xiao et al. Citation2017). Flooding originates from drainage channel overcapacity and hence overflow of such channels. Regions closer to drainage channels are at a higher hazard of overflow inundation than remote regions (Ologunorisa and Abawua Citation2005; Butler et al. Citation2006). As such, areas close to rivers were assigned higher weights in flood hazard calculations (, ). For distance to the rivers in the range of 0–35 and 35–70 km, there is a high potentiality of flooding; in contrast, distances in the ranges of 70–105, 105–140, and more than 140 km have lower flooding vulnerability.
4.2.3. Elevation
Elevation is another parameter in the evaluation of flood susceptibility (Rizeei et al. Citation2019). Runoff flows from high to low terrains, therefore the flood incidence likelihood in low-elevated regions is higher. Rahman et al. (Citation2019) and Sanyal and Lu (Citation2006) found that low lying regions are more vulnerable to inundation as they can be inundated by even floods of low magnitude. Therefore, the western parts of the study area that have the lowest elevation (0–100 m above sea level) are the most prone to inundation (). The eastern regions, on the other hand, have the highest elevation (1500–4400 m above sea level), and the least prone to inundation.
4.2.4. Slope
The surface slope influences the velocities of overland flow and the concentration of flow. The probability of a flood increases as the slope of a region decreases, making it a solid indicator for flood vulnerability evaluation (Rahman et al. Citation2019). A high slope supports quick water drainage, whereas low slope results in stagnation of water, and promoting flooding (Dash and Sar Citation2020). The Shatt Al-Arab basin has been divided into five slope categories (). The areas with a slope of less than 10°, 10–20°, 20–30°, 30–40°, and more than 40° are classifies into very high, high, moderate, low, and very low flood hazard, respectively. As a large area of the basin is situated over the floodplain region, the slope is very low (<10°). This slope category, occurs in the southwestern areas, has the lowest slope and gentlest topographic elevation and represents a higher priority among the subclasses within the flood-inducing parameters ().
4.2.5. Land use/land cover
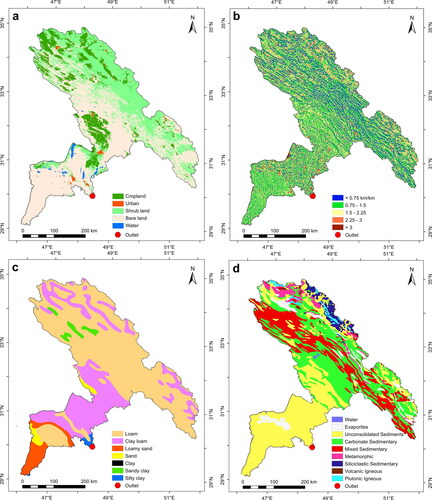
LULC is an important parameter in producing surface runoff and potential flooding in a catchment (Khosravi et al. Citation2018; Areu-Rangel et al. Citation2019). LULC affects infiltration rate, the interrelationship between surface and groundwater (Kazakis et al. Citation2015), evapotranspiration, and surface runoff generation (Samanta et al. Citation2018; Das Citation2019). Water bodies are very susceptible to flooding hazard (Ogato et al. Citation2020), and were given very high potential flood hazard in the current analysis (). Impervious land cover results in infiltration capacity reduction, and runoff from such cover adds significantly to total runoff. Urbanization often causes a decrease in lag time and an increase in both peak discharge and total discharge (Murck et al. Citation1996);, and thus urban areas represent high flood risk regions. Bare lands are moderately susceptible to flooding hazard due to the impact of rainfall on bare soil. Raindrops can disintegrate soil assemblages, resulting in the formation of a surface crust, which often reduces infiltration rate and hydraulic conductivity (Price et al. Citation2010), resulting in higher runoff and flood risk (Owuor et al. Citation2016). On the other hand, vegetated land cover is less vulnerable to flooding due to the negative relationship between vegetation density and flooding (Mojaddadi et al. Citation2017) and hence was assigned low flood hazard ranking. The degree to which water and sediment movement is facilitated at the pedon, slope, and watershed scales is expressed by connectivity (Keesstra et al. Citation2018). Connectivity is low in shrub lands due to their relatively high roughness and infiltration rates. Cerdà et al. (Citation2017) found that high roughness cover promotes low runoff coefficient. Therefore, the runoff coefficient and consequently flood susceptibility of the shrub land in the present study are the lowest (). The bare land, cropland, and shrub land, are the major LULC types of the study area covering more than 90% of the basin area (), and representing moderate to low flooding hazards.
Figure 4. The study area’s (a) LULC, (b) drainage density, (c) soils (dominant grain sizes), and (d) Lithology.
4.2.6. Drainage density
Flood hazard is proportionally related to drainage density because higher drainage promotes a higher surface water flow and virtually increases the flooding susceptibility (Subbarayan and Sivaranjani Citation2020). The drainage density of the study site is classified into five classes based on influence to flooding hazard: ‘very low’ influence (< 0.75 km/km2) covering 17% of the area; ‘low’ (0.75–1.5 km/km2) covers 41%; ‘moderate’ (1.5–2.25 km/km2) covers 33%; ‘high’ (2.25–3 km/km2) covers around 8%; and ‘very high’ (more than 3 km/km2) covers around 1%. Thus, most of the basin has low drainage densities, which represents a low flooding hazard ().
4.2.7. Soil features
The soil map of the study area was categorized into seven classes: sand, loamy sand, loam, clay loam, sandy clay, silty clay, and clay (). Clayey loam primarily occurs in the middle parts, whereas loam exists in the northeastern parts of the basin. Sand and loamy sand exist in the southern areas of the study area and compose approximately 6% of the soil classes. Clayey soils such as clay, silty clay, and sandy clay represent approximately 2% of the total soil classes. According to the previous work review (e.g. ), we realized that irrespective of land cover, soil grain size can remarkably influence infiltration processes, and subsequently flooding susceptibility. Soil properties such as layer thickness, permeability, and infiltration rate impose a direct impact on the rainfall-runoff processes (Zhiyu et al. Citation2013; Rimba et al. Citation2017). Different soil types have different infiltration capacities. The probability of flood risk increases with the decrease in soil infiltration capacity, which results in an enhancement in surface runoff. When the rainfall rate exceeds the soil’s infiltration capacity, the excess rainwater will flow down the slope (Lei et al. Citation2020), and lead to flooding (Ouma and Tateishi Citation2014). Soil pore size distribution, pore volume, and pore connection can substantially affect water transport (Opp Citation2020). Sandy soils have a high ratio of macropores with higher infiltration capacity and lower runoff than loamy soil. Loamy soils which have high ratios of medium-sized pores, possess higher infiltration rates and lower runoff than clayey soil which has the highest ratio of micropores (Brouwer et al. Citation1988; Owuor et al. Citation2016; Opp Citation2020). Particular ranks were allocated to each class by considering the soil type and its infiltration rates. More than 90% of the soil types in the study site are loam and clayey loam and were allocated low to moderate ranking in flood hazard estimation. Loamy sand and sandy soils were assigned very low to extremely low priority. Clayey soils such as sandy clay, silty clay, and clay were allocated high to extremely high priority in flood hazard analysis ().
4.2.8. Lithology
The lithology thematic map of the Shatt Al-Arab basin consists of eight lithological units viz; evaporites, unconsolidated sediments, mixed sedimentary, carbonate sedimentary, siliciclastic sedimentary, metamorphic, plutonic igneous, and volcanic igneous rocks (). The infiltration capacity and runoff in a region are affected by the lithology (Shaban et al. Citation2006; Dash and Sar (Citation2020). Permeable lithology favors water infiltration, whereas impermeable lithology promotes surface runoff inducing the generation of flooding (Bonacci et al. Citation2006). The southwestern parts of the basin, composed essentially of unconsolidated sediments, are part of the Mesopotamia zone which is mainly covered by Quaternary deposits. These deposits are generally represented by the fluvial sediments of the Tigris and Euphrates rivers and their tributaries (Domas Citation1985). Such sediments possessed high porosities and permeabilities and were categorized into extremely low flood hazard zones (). The eastern regions of the basin, consisted of carbonate, siliciclastic, and mixed sedimentary rocks. These regions are part of the Zagros structural zone which is distinguished by thick sedimentary succession. Sedimentary rocks often have fair permeabilities (Earle Citation2019) and low runoff and were assigned very low and low ranks in flood hazard classification (). The metamorphic and igneous rocks in the extreme northeastern parts are associated with low porosity and permeability (Earle Citation2019) and high runoff potentiality. Such lithologies were assigned high to extremely high ranks in lithology sub-classification (Rekha et al. Citation2011; Nasir et al. Citation2018; Kanagaraj et al. Citation2019) (). Similarly, evaporates are often associated with low porosity and permeability and high runoff potential (Earle Citation2019) and were assigned an extremely high rank in lithology sub-classification for flood hazard.
4.3. Flood hazard zoning
The selected eight factors used in flood hazard mapping produced a flood hazard map with four distinct classes (zones) (). These zones that depict high, intermediate, low, and very low flood hazard cover around 20%, 40%, 39%, and 2% of the basin area, respectively. In general, the zones with high flood hazard coincide with regions of a high runoff which is determined by various parameters. In the present study, the high flood hazard zones are situated in the middle part, and the moderate flood hazard zones are mainly distributed in the southern parts as well as in the north western parts of the basin. The low and the very low flood hazard zones are primarily situated in the eastern areas and the very southeastern areas of the basin ().
Figure 5. Flood hazard map of the Shatt Al-Arab basin.
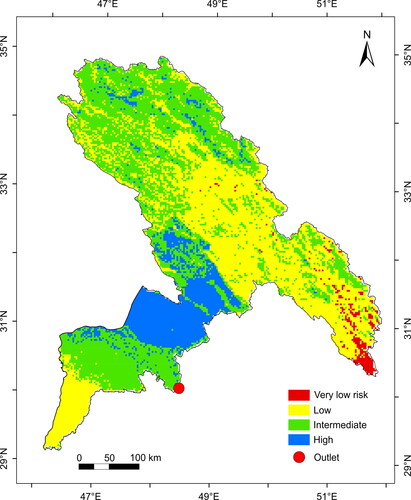
The areas labeled as ‘high hazard’ are positively affected by the distance to the river, DEM, slope, and drainage density. Closer distance to the rivers, low DEM and slope, and high drainage density increase the flood hazard. The highest rainfall levels in the northwestern parts of the basin that are expected to produce high flood hazard zones, are offset by the impact of the high DEM and low drainage density in these parts resulting in moderate flood hazard zones. In contrast, the basin’s eastern and very southeastern areas have the least vulnerability to flooding because they have the lowest rainfall and drainage density and the highest distance to the river, DEM, and slope.
Comparing the spatial distribution of LULC categories over index-based hazard zones and a satellite-based historical inundation map (i.e. a map derived from MODIS/006/MOD09GA) indicated that urban areas are the most vulnerable areas to floods. Results showed that around 60% and 35% of urban areas are under intermediate and high flood hazard, respectively ( and ). Croplands are also highly vulnerable to floods as 60% and 29% of these lands are under intermediate and high flood hazard, respectively. On the other hand, bare lands and shrub lands are less susceptible to floods as more than 40% of their territories are under low flood risk ( and ).
Figure 6. Flood hazard zones validation against the 21 March 2019 flood event.
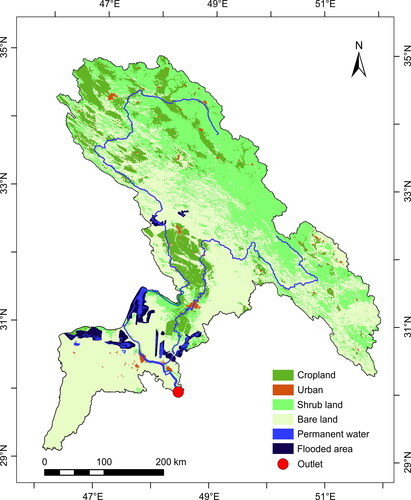
Table 7. Flood hazard zones distribution for each land use category.
Although the produced map shows that the middle part of the basin is highly prone to flooding (), the inundation map exhibits that the inundated regions are mainly surrounding the river courses (). Cerdà et al. (Citation2021) found that there is a decrease in runoff coefficient along the slope. In other words, there is a reduction in the runoff discharge per unit area with the slope length due to the loss of runoff as a consequence of the ponding (Zhao et al. Citation2018) and infiltration ( Cerdà and Rodrigo-Comino, Citation2020). Similarly, Yair and Lavee (Citation1985) found that runoff originated in the upper parts of the slope in arid regions does not reach the river courses due to infiltration, and hence is being disconnected from the drainage network. This can lead to that the runoff formed at the plot scale is disconnected from the main channel (Cerdà et al. Citation2021), and only the event runoff generated at areas surrounding the channels reaches the river course causing inundation.
4.4. Results validation
The flood hazard map developed from the MCDA technique was examined for verification with a satellite-based historical inundation map. The comparison exhibits that around 70% of the previously flooded areas were located in the high hazard zones, 25% in the intermediate hazard zones, 5% in the low hazard zones, while none were in the very low hazard zones ( and ). Therefore, assessments suggest that the presented flood hazard model has accurately predicted the flood prone locations.
4.5. Study’s advantages/disadvantages and recommendations
The high discharge variability of the Shatt Al-Arab, the flat topography especially in the southern parts of its basin, and the inefficient maintenance of the drainage systems are expected to promote both the frequency and intensity of floods in this basin. As it is not possible to avoid the risk of floods or forbid their occurrence, it is advisable to work on reducing their impact and the losses that they can bring (Elkhrachy Citation2015). However, flood hazard assessment based on direct measurements may not be achievable in this area due to data inadequacies. Therefore, the present study formulates an efficient methodology to accurately identify the flood hazard zones in the Shatt Al-Arab basin based on RS-GIS along with AHP technique. The results were found to coincide with satellite-based historical inundation map indicating the realistic representation of the flood risk. The resultant flood risk map represents a cost-effective solution for risk mitigation measures in a flood-prone region.
The AHP method applied in the present study created a ranking of decision alternatives with a mathematical structure. This method desegregates a complex decision-making issue into three parts: a goal, criteria, and alternatives. Afterwards, pairwise comparisons between the criteria and the alternatives of each parameter are used to identify the relative significance of that parameter according to expert opinions from a consultative questionnaire (Lyu, Sun, Shen, et al. Citation2019). AHP advantages are: the hierarchical structuring to define the different attributes in the MCDM problem; standardizing the relative significance; and the relatively developed decision making (Jin and Zhang Citation2002). Currently, researchers have given reasonable attention to using AHP in flood hazard evaluation (Zou et al. Citation2013; Ouma and Tateishi Citation2014; Danumah et al. Citation2016; Gigović et al. Citation2017; Cabrera and Lee Citation2018). In these case studies, it was demonstrated that AHP can accurately estimate and map flood risk zones. However, because the result is reliant on expert opinions, it may be subjected to intellectual constraints due to subjectivity and uncertainty. The traditional AHP employs a single number to reflect the decision maker's preference for one of the alternatives in a pairwise comparison (Li et al. Citation2013). However, the opinions of decision-makers may not be properly conveyed by a crisp value (Leung and Cao Citation2000; Kahraman et al. Citation2003). Furthermore, collecting assessments from a large number of experts using the traditional questionnaire in the AHP technique is time consuming. In addition, inconsistency is unavoidable because the judgment matrix is based on individuals' subjective preferences in pairwise comparison (Lyu, Sun, Shen, et al. Citation2019). Therefore, the use of more sophisticated methods such as Fuzzy-AHP (Lyu, Shen, Zhou, et al. Citation2019; Lyu, Shen, Zhou, et al. Citation2020), FAHP-FCA (Lyu, Shen, Zhou, Zhou, et al. Citation2019), TFN-AHP (Lyu, Zhou, Shen, et al. Citation2020; Lyu, Shen, Yang, et al. Citation2020; Zheng et al. Citation2021), TOPSIS (Lin et al. Citation2020; Citation2021a), Set pair analysis (Lyu et al. Citation2021), and fuzzy set theory and machine learning methods (Lin et al. Citation2021b) has been proposed to improve the application of the original AHP (Lyu, Shen, et al. Citation2018; Lyu, Sun, et al. Citation2018; Lyu, Sun, Shen, et al. Citation2019; Lyu, Shen, Zhou, et al. Citation2019; Lyu, Shen, Zhou, Zhou, et al. Citation2019).
The current study was able to detect and present the most important flood conditioning parameters, as well as the most flood-vulnerable areas. The findings of this article can be utilized to mitigate future flood damages to people and infrastructure. While the method used to estimate the relative importance of components (i.e. AHP) has its advantages, it also has some drawbacks. It was concluded that simple strategies, such as the traditional AHP method, can be sufficient in the early phases of the planning procedure when distinguishing development options as a focal point are requested. However, when determining the spatial extent of the desirable development region is required, using a more advanced methods is ideal. For instance, using the AHP method in conjunction with one of the fuzzy AHP methods and considering the intersection area suggested by both methods can result in more reliable outcomes (Mosadeghi et al. Citation2015). As the current study is a preliminary assessment for the flood prone areas in a basin, we used the traditional AHP technique in our analysis. However, it is recommended to use AHP technique in conjunction with other decision support tool and methodologies (Millet and Wedley Citation2002; Mosadeghi et al. Citation2015; Lyu, Shen, Zhou, et al. Citation2020) for future planning work for more efficient results.
5. Conclusions
The objective GIS-based spatial multi-criteria evaluation framework applied along with using the AHP method at the catchment scale has proven effective for demarcating flood hazard zoning in the trans-boundary Shatt Al-Arab basin. For the flood vulnerability mapping, rainfall, topography, geology, soil, land use, and flooded-area datasets were compiled and entered into spatial datasets. The produced map shows that the middle part of the basin is highly prone to flooding. The flood susceptibility is generally decreasing to the upstream and downstream areas of the basin. The results clearly indicate that areas with a closer distance to the rivers, low elevation and slope, and high drainage density are mostly risk-prone due to the high probability of flood occurrence in such areas. The AHP methodology incorporated expert opinion and knowledge to identify the optimal selection of weights for the factors that contribute to flood risk. The overlay results acquired from the AHP methodology against historical flood data and flood inundation modeling validated the procedure’s integrity. The comparisons of land use types over index-based hazard zones show that urban areas and agricultural areas are most vulnerable to floods as around 60 and 30% of these areas are under intermediate and high flood hazard, respectively. Advantages of the applied approach include its flexibility, ease of handling, and low cost, making it feasible to apply especially in such a region with limited data and information. While the traditional AHP method has its advantages, it also has some deficiencies. The conventional AHP method is sufficient in the current preliminary evaluation of flood hazard. Nonetheless, it is advisable to use AHP technique along with fuzzy AHP methods for future planning work for more effective outcomes. The findings of this paper provide preparatory risk evaluation that can be used by the local disaster management authorities, planners, researchers, and line agencies dealing with flood hazard management.
Disclosure statement
No potential competing interest was reported by the authors.
Data availability statement
The authors confirm that the data supporting the findings of this study are available within the article.
Additional information
Funding
References
- Al-Musawi F, Idan R, Salih A. 2019. Reservoir properties and facies distribution of Mishrif formation in Ratawi Oilfield, Southern Iraq. In: Rossetti F, editor. The structural geology contribution to the Africa-Eurasia geology: basement and reservoir structure, ore mineralisation, and tectonic modelling. Advances in Science, Technology & Innovation (IEREK Interdisciplinary Series for Sustainable Development). Cham: Springer.
- Anselmo V, Galeati G, Palmieri S, Rossi U, Todini E. 1996. Flood risk assessment using an integrated hydrological and hydraulic modeling approach: a case study. J Hydrol. 175(1-4):533–554.
- Aqrawi A, Gof f. J, Horbury A, Sadooni F. 2010. The petroleum geology of Iraq. UK: Scientific Press; p. 424.
- Areu-Rangel O, Cea L, Bonasia R, Espinosa-Echavarria V. 2019. Impact of urban growth and changes in land use on river flood hazard in Villahermosa, Tabasco (Mexico). Water (Switzerland). 11(2):304–315.
- Arshad A, Zhang Z, Zhang W, Dilawar A. 2020. Mapping favorable groundwater potential recharge zones using a GIS-based analytical hierarchical process and probability frequency ratio model: a case study from an agro-urban region of Pakistan. Geosci Front. 11(5):1805–1819.
- Awawdeh M, Obeidat M, Al-Mohammad M, Al-Qudah K, Jaradat R. 2014. Integrated GIS and remote sensing for mapping groundwater potentiality in the Tulul al Ashaqif. Arab J Geosci. 7(6):2377–2392.
- Barasa N, Perera E. 2018. Analysis of land use change impacts on flash flood occurrences in the Sosiani River basin Kenya Betty. Int J River Basin Manage. 16(2):179–188.
- Berberian M, King G. 1981. Towards the paleogeography and tectonic evolution of Iran. Can J Earth Sci. 18(2):210–265.
- Bisson R, Lehr J. 2004. Chapter 4. Sudan case studies and model. In Modern groundwater exploration. Hobokon, NJ: John Wiley & Sons.
- Bonacci O, Ljubenkov I, Roje-Bonacci T. 2006. Karst flash floods: an example from the Dinaric karst (Croatia). Nat Hazards Earth Syst Sci. 6(2):195–203.
- Booij M. 2005. Impact of climate change on river flooding assessed with different spatial model resolutions. J Hydrol. 303(1-4):176–198.
- Brakenridge R, Anderson E. 2006. Modis-based flood detection, mapping and measurement: the potential for operational hydrological applications. In: Marsalek J, Stancalie G, Balint G, editors, Transboundary floods: reducing risks through flood management. Nato Science Series: IV: Earth and Environmental Sciences, vol 72. Dordrecht: Springer..
- Brouwer C, Prins K, Kay M, Heibloem M. 1988. Irrigation water management: irrigation methods, training manual No. 5, 1988, Food and Agriculture Organization of the United Nations, Available http://www.fao.org/3/S8684E/s8684e00.htm#Contents.
- Brunelli M. 2015. Introduction to the analytic hierarchy process. New York: Springer.
- Buday T, Jassim S. 1984. Final report and the regional geological survey of Iraq. Unpub Report SOM Library Tecton Framework Baghdad. 2:1984.
- Butler D, Kokkalidou A, Makropoulos C. 2006. Supporting the siting of new urban developments for integrated urban water resource management. In: Hlavinek P, Kukharchyk T, Marsalek J, Mahrikova I (eds) Integrated urban water resources management. Nato Security Through Science Series. Springer, Dordrecht, p. 19–34. https://doi.org/https://doi.org/10.1007/1-4020-4685-5_3
- Cabrera J, Lee H. 2018. Impacts of climate change on flood-prone areas in Davao Oriental. Philippines. Water. 10(7):893.
- Cabrera JS, Lee HS. 2019. Flood-prone area assessment using GIS-based multi-criteria analysis: a case study in Davao Oriental, Philippines. Water. 11:2203.
- Cerdà A, Rodrigo-Comino J. 2020. Is the hillslope position relevant for runoff and soil loss activation under high rainfall conditions in vineyards?. Ecohydrol. Hydrobiol. 20(1):59–72. doi:https://doi.org/10.1016/j.ecohyd.2019.05.006.
- Cerdà A, Keesstra SD, Rodrigo-Comino J, Novara A, Pereira P, Brevik E, Giménez-Morera A, Fernández-Raga M, Pulido M, di Prima S, et al. 2017. Runoff initiation, soil detachment and connectivity are enhanced as a consequence of vineyards plantations. J Environ Manage. 202:268–275.
- Cerdà A, Novara A, Dlapa P, López-Vicente M, Úbeda X, Popović Z, Mekonnen M, Terol E, Janizadeh S, Mbarki S, et al. 2021. Rainfall and water yield in Macizo del Caroig, Eastern Iberian Peninsula. Event runoff at plot scale during a rare flash flood at the Barranco de Benacancil. CIG. 47(1):95–119.
- Chakraborty S, Mukhopadhyay S. 2019. Assessing flood risk using analytical hierarchy process (AHP) and geographical information system (GIS): application in Coochbehar district of West Bengal. Nat Hazards. 99(1):247–274.
- Charlton R, Fealy R, Moore S, Sweeney J, Murphy C. 2006. Assessing the impact of climate change on water supply and flood hazard in Ireland using statistical downscaling and hydrological modelling techniques. Clim Change. 74(4):475–491.
- Chen YR, Yeh CH, Yu B. 2011. Integrated application of the analytic hierarchy process and the geographic information system for flood risk assessment and flood plain management in Taiwan. Nat Hazards. 59(3):1261–1276.
- Cheng XT, Yang L, Chen XJ. 1996. Numerical model of flood propagation in detention basin. J Nat Disasters. 5(1):34–40. in Chinese.
- Comino JR, Keesstra SD, Cerdà A. 2018. Connectivity assessment in Mediterranean vineyards using improved stock unearthing method, LiDAR and soil erosion field surveys. Earth Surf Process Landforms. 43(10):2193–2206.
- Country Data Info. 2020. https://www.laenderdaten.info/.
- Dahri N, Abida H. 2017. Monte Carlo simulation-aided analytical hierarchy process (AHP) for flood susceptibility mapping in Gabes Basin (southeastern Tunisia). Environ Earth Sci. 76(7):302.
- Danumah JH, Odai SN, Saley BM, Szarzynski J, Thiel M, Kwaku A, Kouame FK, Akpa LY. 2016. Flood risk assessment and mapping in Abidjan district using multi-criteria analysis (AHP) model and geoinformation techniques, (cote d’ivoire). Geoenviron. Disasters. 3:10.
- Das S. 2018. Geographic information system and AHP-based flood hazard zonation of Vaitarna basin, Maharashtra, India. Arab J Geosci. 11(19):576.
- Das S. 2019. Geospatial mapping of flood susceptibility and hydro-geomorphic response to the floods in Ulhas basin, India. Remote Sens Appl Soc Environ. 14:60–74.
- Dash P, Sar J. 2020. Identification and validation of potential flood hazard area using GIS-based multi-criteria analysis and satellite data-derived water index. J Flood Risk Management. 13(3):e12620.
- de Brito MM, Evers M. 2016. Multi-criteria decision-making for flood risk management: a survey of the current state of the art. Nat Hazards Earth Syst Sci. 16(4):1019–1033.
- Deng Z, Zhang X, Li D, Pan G. 2015. Simulation of land use/land cover change and its effects on the hydrological characteristics of the upper reaches of the Hanjiang Basin. Environ Earth Sci. 73(3):1119–1132.
- Detrembleur S, Stilmant F, Dewals B, Erpicum S, Archambeau P, Pirotton M. 2015. Impacts of climate change on future flood damage on the river Meuse, with a distributed uncertainty analysis. Nat Hazards. 77(3):1533–1549.
- Domas J. 1985. The Geology of Karbala – Kut – Ali Al-Gharbi Area. GEOSURV, int. rep. no. 1384.
- Dottori F, Salamon P, Bianchi A, Alfieri L, Hirpa F, Feyen L. 2016. Development and evaluation of a framework for global flood hazard mapping. Adv Water Resour. 94:87–102.
- Dou X, Song J, Wang L, Tang B, Xu S, Kong F, Jiang X. 2018. Flood risk assessment and mapping based on a modified multi-parameter flood hazard index model in the Guanzhong Urban Area. Stoch Environ Res Risk Assess. 32(4):1131–1146.
- Dutta D, Alam J, Umeda K, Hayashi M, Hironaka S. 2007. A two-dimensional hydrodynamic model for flood inundation simulation: a case study in the lower Mekong river basin. Hydrol Process. 21(9):1223–1237.
- Earle S. 2019. Physical geology. 2nd ed. Victoria, B.C.: BCcampus. https://opentextbc.ca/physicalgeology2ed/.
- Elkhrachy I. 2015. Flash flood hazard mapping using satellite images and GIS tools: a case study of Najran City, Kingdom of Saudi Arabia (KSA). Egypt J Remote Sens Space Sci. 18(2):261–278.
- Enderle D, Weih R. 2005. Integrating supervised and unsupervised classification methods to develop a more accurate land cover classification. Journal of the Arkansas Academy of Science59:65–73. Available online: https://scholarworks.uark.edu/jaas/vol59/iss1/10
- EU Flood Directive. 2007. Directive 2007/60/EC of the European Parliament and of the Council of 23 October 2007 on the assessment and management of flood risks. https://eur-lex.europa.eu/legal-content/EN/TXT/?uri=CELEX:32007L0060.
- Feizizadeh B, Blaschke T, Shadman Roodposhti M. 2013. Integrating GIS based fuzzy set theory in multicriteria evaluation methods for landslide susceptibility mapping. Int J Geoinf. 9:49–57.
- Fernandez DS, Lutz MA. 2010. Urban flood hazard zoning in Tucuman Province, Argentina, using GIS and multicriteria decision analysis. Eng Geol. 111(1-4):90–98.
- Few R, Ahern M, Matthies F, Kovats S. 2004. Floods, health and climate change: a strategic review. Tyndall Centre Working Paper No. 63. Norwich: Tyndall Centre for Climate Change Research.
- Gambini JM, Laymito JA. 2019. Multiparametric ahp-based flood hazard zonation approach in northwestern Peru at basin scale. E-Proceedings of the 38th IAHR World Congress, September 1-6, 2019, Panama City, Panama.
- Gashaw W, Legesse D. 2011. Flood hazard and risk assessment using GIS and Remote Sensing in Fogera Woreda, Northwest Ethiopia. Nile River Basin. Springer, p. 179–206.
- Ghosh A, Kar S. 2018. Application of analytical hierarchy process (AHP) for flood risk assessment: a case study in Malda district of West Bengal. Nat Hazards. 94(1):349–368.
- Gigović L, Pamučar D, Bajić Z, Drobnjak S. 2017. Application of GIS-Interval rough AHP methodology for flood hazard mapping in urban areas. Water. 9 (6):360–326.
- Goepel K. 2013. Implementing the analytic hierarchy process as a standard method for multi-criteria decision making in corporate enterprises – a new AHP excel template with multiple inputs. Proceedings of the International Symposium on the Analytic Hierarchy Process, Kuala Lumpur, 2013. DOI: https://doi.org/https://doi.org/10.13033/isahp.y2013.047.
- Guo E, Zhang J, Ren X, Zhang Q, Sun Z. 2014. Integrated risk assessment of flood disaster based on improved set pair analysis and the variable fuzzy set theory in central Liaoning Province. Nat Hazards. 74(2):947–965.
- Hajibigloo M, Ghezelsofloo AA, Memarian H, Sheikh VB. 2017. Mapping the flood-prone areas for developing a flood risk management system in the Northeast of Iran. Water Harvest Res. 2(2):1–12. www.jwhr.birjand.ac.ir.
- Hazarika N, Barman D, Das AK, Sarma AK, Borah SB. 2018. Assessing and mapping flood hazard, vulnerability and risk in the upper Brahmaputra River valley using stakeholders’ knowledge and multicriteria evaluation (MCE). J Flood Risk Manag. 11:S700–S716.
- Hoque M, Tasfia S, Ahmed N, Pradhan B. 2019. Assessing spatial flood vulnerability at Kalapara Upazila in Bangladesh using an analytic hierarchy process. Sensors. 19(6):1302.
- Idan R, Al-Musawi F, Salih A, Sh A-Q. 2019. The petroleum system of Zubair formation in Zubair subzone, Southern Iraq. J Petrol Res Stud. 25(12).
- Islam M, Sado K. 2000. Flood hazard assessment for the construction of flood hazard map and land development priority map using NOAA/AVHRR data and GIS–a case study in Bangladesh. Hydrol Sci J Des Sci Hydrol. 45(3):337–357.
- Issar I. 1969. The groundwater provinces of Iran. Bull Int Assoc Sci Hydrol, XIV Année. 14(1):87–99.
- Jaeppinen T. 2020. Glim – Global Lithological Map Database. [online] Geo.uni-hamburg.de. https://www.geo.uni-hamburg.de/geologie/forschung/geochemie/glim.html. [accessed 2020 July 12].
- Jin K, Zhang HS. 2002. Comparison of AHP and reference point method in the environmental decision support model. Conference Record 2002 IEEE International Symposium on Electronics and the Environment (Cat. No.02CH37273), pp. 269–273.
- Jonkman SN, Dawson RJ. 2012. Issues and challenges in flood risk management—editorial for the special issue on flood risk management. Water. 4(4):785–792.
- Kabenge M, Elaru J, Wang H, Li F. 2017. Characterizing flood hazard risk in data-scarce areas, using a remote sensing and GIS-based flood hazard index. Nat Hazards. 89(3):1369–1387.
- Kachouri S, Achour H, Abida H, Bouaziz S. 2015. Soil erosion hazard mapping using analytic hierarchy process and logistic regression: a case study of Haffouz watershed, Central Tunisia. Arab J Geosci. 8(6):4257–4268.
- Kahraman C, Ruan D, Doǧan I. 2003. Fuzzy group decisionmaking for facility location selection. Inf. Sci. 157:135–153.
- Kanagaraj G, Suganthi S, Elango L, Magesh N. 2019. Assessment of groundwater potential zones in Vellore district, Tamil Nadu, India using geospatial techniques. Earth Sci Inform. 12(2):211–223.
- Kazakis N, Kougias I, Patsialis T. 2015. Assessment of flood hazard areas at a regional scale using an index-based approach and analytical hierarchy process: application in Rhodope-Evros region, Greece. Sci Total Environ. 538:555–563.
- Keesstra S, Nunes J, Saco P, Parsons T, Poeppl R, Masselink R, Cerdà A. 2018. The way forward: can connectivity be useful to design better measuring and modelling schemes for water and sediment dynamics? Sci Total Environ. 644:1557–1572.
- Khaing ZM, Zhang K, Sawano H, Shrestha BB, Sayama T, Nakamura K. 2019. Flood hazard mapping and assessment in data-scarce Nyaungdon area, Myanmar. PLoS One. 14(11):e0224558.
- Khan SI, Hong Y, Wang J, Yilmaz KK, Gourley JJ, Adler RF, Brakenridge GR, Policelli F, Habib S, Irwin D. 2011. Satellite remote sensing and hydrologic modeling for flood inundation mapping in Lake Victoria Basin: implications for hydrologic prediction in Ungauged Basins. IEEE Trans Geosci Remote Sens. 49(1):85–95.
- Khosravi K, Panahi M, Golkarian A, Keesstra SD, Saco PM, Bui DT, Lee S. 2020. Convolutional neural network approach for spatial prediction of flood hazard at national scale of Iran. J Hydrol. 591:125552.
- Khosravi K, Pham BT, Chapi K, Shirzadi A, Shahabi H, Revhaug I, Prakash I, Tien Bui D. 2018. A comparative assessment of decision trees algorithms for flash flood susceptibility modeling at Haraz watershed, northern Iran. Sci Total Environ. 627:744–755.
- Khosravi K, Pourghasemi HR, Chapi K, Bahri M. 2016. Flash flood susceptibility analysis and its mapping using different bivariate models in Iran: a comparison between Shannon’s entropy, statistical index, and weighting factor models. Environ Monit Assess. 188(12):1–21.
- Kourgialas NN, Karatzas GP. 2011. Flood management and a GIS modelling method to assess flood-hazard areas—a case study. Hydrol Sci J. 56(2):212–225.
- Kuldeep Garg PK, Garg RD. 2016. Geospatial techniques for flood inundation mapping. 2016 IEEE International Geoscience and Remote Sensing Symposium (IGARSS). p. 4387–4390.
- Kumar V, Mondal N, Ahmed S. 2020. Identification of groundwater potential zones using RS, GIS and AHP techniques: a case study in a part of Deccan Volcanic Province (DVP), Maharashtra, India. J Indian Soc Remote Sens. 48(3):497–511.
- Lee S, Kim J, Jung H, Lee M, Lee S. 2017. Spatial prediction of flood susceptibility using random- and boosted-tree models in Seoul metropolitan city, Korea. Geomatics Nat Hazards Risk. 8(2):1185–1203.
- Lei W, Dong H, Chen P, Lv H, Fan L, Mei G. 2020. Study on runoff and infiltration for expansive soil slopes in simulated rainfall. Water. 12(1):222. www.mdpi.com/journal/water.
- Leung LC, Cao D. 2000. On consistency and ranking of alternatives in fuzzy AHP. Eur J Oper Res. 124 (1):102–113.
- Li F, Phoon K, Du X, Zhang M. 2013. Improved AHP method and its application in risk identification. J Constr Eng Manage. 139(3):312–320.
- Lin SS, Shen SL, Zhou A, Xu YS. 2020. Approach based on TOPSIS and Monte Carlo simulation methods to evaluate lake eutrophication levels. Water Res. 187:116437.
- Lin SS, Shen SL, Zhou A, Xu YS. 2021a. Novel model for risk identification during karst excavation. In Reliability engineering and system safety, vol. 209. UK: Elsevier; p. 1–14.
- Lin SS, Shen SL, Zhou A, Xu YS. 2021b. Risk assessment and management of excavation system based on fuzzy set theory and machine learning methods. Autom Constr. 122:103490.
- Liu Y, Zhang W, Cui X. 2012. Flood emergency management using hydrodynamic modelling. Proc Eng. 28:750–753.
- Liuzzo L, Sammartano V, Freni G. 2019. Comparison between different distributed methods for flood susceptibility mapping. Water Resour Manage. 33(9):3155–3173.
- Lyu HM, Shen JS, Arulrajah A. 2018. Assessment of geohazards and preventative countermeasures using AHP incorporated with GIS in Lanzhou, China. Sustainability. 10(2):304.
- Lyu HM, Shen S, Zhou A. 2021. The development of IFN-SPA: a new risk assessment method of urban water quality and its application in Shanghai. J Cleaner Prod. 282:124542.
- Lyu HM, Shen SL, Yang J, Zhou A. 2020. Risk assessment of earthquake-triggered geohazards surrounding Wenchuan, China. Nat Hazards Rev. 21(3):05020007.
- Lyu HM, Shen SL, Zhou A, Yang J. 2019. Perspectives for flood risk assessment and management for mega-city metro system. Tunnel Underground Space Technol. 84:31–44.
- Lyu HM, Shen SL, Zhou A, Yang J. 2020. Risk assessment of mega-city infrastructures related to land subsidence using improved trapezoidal FAHP. Sci Total Environ. 717:135310.
- Lyu HM, Shen SL, Zhou AN, Zhou WH. 2019. Flood risk assessment of metro systems in a subsiding environment using the interval FAHP-FCA approach. Sustain Cities Soc. 50(2019):101682.
- Lyu HM, Sun WJ, Shen SL, Arulrajah A. 2018. Flood risk assessment in metro systems of mega-cities using a GIS-based modeling approach. Sci Total Environ. 626:1012–1025.
- Lyu HM, Sun WJ, Shen SL, Zhou AN. 2019. Risk assessment using a new consulting process in fuzzy AHP. J Constr Eng Manage. 146(3):04019112.
- Lyu HM, Zhou WH, Shen SL, Zhou AN. 2020. Inundation risk assessment of metro system using AHP and TFN-AHP in Shenzhen. Sustain Cities Soc. 56:102103.
- Machiwal D, Rangi N, Sharma A. 2015. Integrated knowledge- and data-driven approaches for groundwater potential zoning using GIS and multi-criteria decision-making techniques on hard-rock terrain of Ahar catchment, Rajasthan, India. Environ Earth Sci. 73(4):1871–1892.
- Madhuri B, Aniruddha G, Rahul R. 2013. Identification and classification of flood prone areas using AHP, GIS and GPS. Disaster Adv. 6:120–131.
- Mallick J, Khan R, Ahmed M, Alqadhi S, Alsubih M, Falqi I, Abul Hasan M. 2019. Modeling groundwater potential zone in a semi-arid region of aseer using fuzzy-AHP and geoinformation techniques. Water. 11(12):2656.
- Millet I, Wedley WC. 2002. Modelling risk and uncertainty with the analytic hierarchy process. J Multi-Crit Decis Anal. 11(2):97–107.
- Ministry of Municipalities and Public Works, Iraq. 2015. Report on data collection survey on water sector in Southern Iraq. https://openjicareport.jica.go.jp/pdf/1000020477.pdf. [accessed 2021 July 29].
- Mojaddadi H, Pradhan B, Nampak H, Ahmad N, Ghazali AH. 2017. Ensemble machine-learning-based geospatial approach for flood risk assessment using multi-sensor remote-sensing data and GIS Geomatics. Nat Hazards Risk. 8(2):1080–1102.
- Mosadeghi R, Warnken J, Tomlinson R, Mirfenderesk H. 2015. Comparison of Fuzzy-AHP and AHP in a spatial multi-criteria decision making model for urban land-use planning. Comput Environ Urban Syst. 49:54–65.
- Murck B, Skinner B, Porter S. 1996. Environmental Geology. Wiley and Sons Inc. p. 535.
- Myronidis D, Emmanouloudis D, Stathis D, Stefanidis P. 2009. Integrated flood hazard mapping in the framework of E.U directive on the assessment and management of flood risks. Fresenius Environ Bull. 18:102–111.
- Naghibi S, Pourghasemi H, Pourtaghi Z, Rezaei A. 2015. Groundwater qanat potential mapping using frequency ratio and Shannon’s entropy models in the Moghan watershed, Iran. Earth Sci Inform. 8(1):171–186.
- Nasir M, Khan S, Zahid H, Khan A. 2018. Delineation of groundwater potential zones using GIS and multi influence factor (MIF) techniques: a study of district Swat, Khyber Pakhtunkhwa, Pakistan. Environ Earth Sci. 77(10):1–11.
- Naulin JP, Payrastre O, Gaume E. 2013. Spatially distributed flood forecasting in flash flood prone areas: Application to road network supervision in Southern France. J Hydrol. 486:88–99.
- Nyarko BK. 2002. Application of a rational model in GIS for flood risk assessment in Accra. Ghana J Spat Hydrol. 2:1–14.
- Ogato G, Bantider A, Abebe K, Geneletti D. 2020. Geographic information system (GIS)-Based multicriteria analysis of flooding hazard and risk in Ambo Town and its watershed, West shoa zone, oromia regional State Ethiopia. J Hydrol Regional Studies. 27 (2020):100659.
- Ologunorisa T, Abawua M. 2005. Flood risk assessment: a review. J Appl Sci Environ Manag. 9:57–63.
- Opp C, 2020. Bodenkörper. In: Gebhardt H, Glaser R, Radtke U, Reuber P, A. Vött, editors. Geographie – Physische Geographie und Humangeographie. 3. Aufl. Berlin: Springer; p. 485–490.
- Opp C. 2004. Hochwasserforschung heute – Ursachen, Wirkungen und Folgen, unter besonderer Berücksichtigung des Hochassers im Elbe-Einzugsgebiet vom August 2002. Bestandsaufnahme Ausblick. 140:86–115.
- Ouma YO, Tateishi R. 2014. Urban flood vulnerability and risk mapping using integrated multi parametric AHP and GIS: methodological overview and case study assessment. Water. 6(6):1515–1545.
- Owuor S, Butterbach-Bahl K, Guzha A, Rufino M, Pelster D, Díaz-Pinés E, Breuer L. 2016. Groundwater recharge rates and surface runoff response to land use and land cover changes in semi-arid environments. Ecol Process. 5(1):16.
- Papaioannou G, Vasiliades L, Loukas A. 2015. Multi-criteria analysis framework for potential flood prone areas mapping. Water Resour Manage. 29(2):399–418.
- Paul GC, Saha S, Hembram TK. 2019. Application of the GIS-based probabilistic models for mapping the flood susceptibility in Bansloi sub-basin of Ganga-Bhagirathi River and their comparison. Remote Sens Earth Syst Sci. 2(2-3):120–146.
- Price K, Jackson CR, Parker AJ. 2010. Variation of surficial soil hydraulic properties across land uses in the southern Blue Ridge Mountains, North Carolina, USA. J Hydrol. 383(3-4):256–268.
- Radmehr A, Araghinejad S. 2015. Flood vulnerability analysis by fuzzy spatial multi criteria decision making. Water Resour Manage. 29(12):4427–4445.
- Rahman M, Ningsheng C, Islam M, Dewan A, Iqbal J, Washakh R, Shufeng T. 2019. Flood susceptibility assessment in Bangladesh using machine learning and multi criteria decision analysis. Earth Syst Environ. 3(3):585–601.
- Rahmati O, Pourghasemi HR, Zeinivand H. 2016. Flood susceptibility mapping using frequency ratio and weights of-evidence models in the Golastan Province, Iran. Geocarto Int. 31(1):42–70.
- Rahmati O, Zeinivand H, Besharat M. 2016. Flood hazard zoning in Yasooj region, Iran, using GIS and multi-criteria decision analysis. Geomatics Nat Hazards Risk. 7(3):1000–1017.
- Rekha VB, Thomas AP, Suma M, Vijith H. 2011. An integration of spatial information technology for groundwater potential and quality investigations in Koduvan Ar Sub-Watershed of Meenachil River Basin, Kerala, India. J Indian Soc Remote Sens. 39(1):63–71.
- Riad P, Billib M, Hassan A, Salam M, El Din M. 2011. Application of the overlay weighted model and boolean logic to determine the best locations for artificial recharge of groundwater. JUEE. 5 (2):57–66.
- Rimba AB, Setiawati MD, Sambah AB, Miura F. 2017. Physical flood vulnerability mapping applying geospatial techniques in Okazaki City, Aichi Prefecture. Japan. Urban Sci. 1(1):7–22.
- Rincón D, Khan U, Armenakis C. 2018. Flood risk mapping using GIS and multi-criteria analysis: a greater Toronto area case study. Geosciences. 8(8):275.
- Rizeei HM, Pradhan B, Saharkhiz MA. 2019. Allocation of emergency response centres in response to pluvial flooding-prone demand points using integrated multiple layer perceptron and maximum coverage location problem models. Int J Disaster Risk Reduction. 38:101205.
- Saaty T. 1980a. Group decision making and the AHP. In: Golden BL, Wasil EA, Harker PT, editors. The analytic hierarchy process. Berlin, Heidelberg: Berlin, Heidelberg.
- Saaty T. 1980b. The analytic hierarchy process. xiii ed. New York: McGraw-Hill International Book Co.
- Saaty T. 1990. How to make a decision: the analytic hierarchy process? Eur J Oper Res. 48(1):9–26.
- Saaty T. 2014. Decision making for leaders: the analytic hierarchy process for decisions in a complex world. RWS Publications. Pittsburgh, PA, USA.
- Sahana M, Patel PP. 2019. A comparison of frequency ratio and fuzzy logic models for flood susceptibility assessment of the lower Kosi River Basin in India. Environ Earth Sci. 78(10):1–27.
- Samanta RK, Bhunia GS, Shit PK, Pourghasemi HR. 2018. Flood susceptibility mapping using geospatial frequency ratio technique: a case study of Subarnarekha River Basin. Model Earth Syst Environ. 4(1):395–408.
- Sanyal J, Lu XX. 2006. GIS-based flood hazard mapping at different administrative scales: a case study in Gangetic West Bengal, India. Singapore J Trop Geo. 27(2):207–220.
- Sarker MZ, Sivertun Å. 2011. GIS and RS combined analysis for flood prediction mapping– a case study of Dhaka City corporation. IJEP. 1(3):30–42.
- Sauer VB. 2002. USGS, the national flood frequency program, version 3: a computer program for estimating magnitude and frequency of floods for ungaged sites. USGS.
- Schmitt TG, Thomas M, Ettrich N. 2004. Analysis and modeling of flooding in urban drainage systems. J Hydrol. 299(3-4):300–311.
- Seejata K, Yodying A, Wongthadam T, Mahavik N, Tantanee S. 2018. Assessment of flood hazard areas using Analytical Hierarchy Process over the Lower Yom Basin, Sukhothai Province. Procedia Eng. 212:340–347.
- Shaban A, Khawlie M, Abdallah C. 2006. Use of remote sensing and GIS to determine recharge potential zone: the case of Occidental Lebanon. Hydrogeol J. 14(4):433–443.
- Tehrany MS, Shabani F, Jebur MN, Hongh H, Chen W, Xie X. 2017. GIS-based spatial prediction of flood prone areas using standalone frequency ratio, logistic regression, weight of evidence and their ensemble techniques. Geomatics Nat Hazards Risk. 8(2):1538–1561.
- Shi PJ. 2003. Natural hazard atlas of China. Science, Beijing, in Chinese.
- Smith D. 1994. Flood damage estimation-a review of urban stage-damage curves and loss information. Water SA. 20:335–349.
- Stefanidis S, Stathis D. 2013. Assessment of flood hazard based on natural and anthropogenic factors using analytic hierarchy process (AHP). Nat Hazards. 68(2):569–585.
- Su BD, Jiang T, Guo YY. 2005. GIS raster data-based dynamic flood risk simulation model and its application. J Hehai Univ (Nat Sci). 33(4):370–374. in Chinese.
- Subbarayan S, Sivaranjani S. 2020. Modelling of flood susceptibility based on gis and analytical hierarchy process—a case study of Adayar River Basin, Tamilnadu, India. In: Pal I, von Meding J, Shrestha S, Ahmed I, Gajendran T, editors. An interdisciplinary approach for disaster resilience and sustainability. MRDRRE 2017. Disaster Risk Reduction (Methods, Approaches and Practices). Singapore: Springer.
- Tabari H. 2020. Climate change impact on flood and extreme precipitation increases with water availability. Sci Rep. 10(1):13768.
- Tanavud C, Yongchalermchai C, Bennui A, Densreeserekul O. 2004. Assessment of flood risk in Hat Yai Municipality, Southern Thailand, using GIS. J Nat Disaster Sci. 26(1):1–14.
- TAVO. 1985. Tübinger Atlas des Vorderen Orients. Part A IV. Wiesbaden: Luwig Reichert.
- Tehrany MS, Pradhan B, Jebur MN. 2013. Spatial prediction of flood susceptible areas using rule based decision tree (DT) and a novel ensemble bivariate and multivariate statistical models in GIS. J Hydrol. 504:69–79.
- Todini F, De Filippis T, De Chiara G, Maracchi G, Martina M, Todini E. 2004. Using a GIS approach to asses flood hazard at national scale. In: Proceedings of the European Geosciences Union, 1st General Assembly, Nice, p. 25–30.
- Ullah K, Zhang J. 2020. GIS-based flood hazard mapping using relative frequency ratio method: a case study of Panjkora River Basin, eastern Hindu Kush, Pakistan. PLoS One. 15(3):e0229153.
- Ullah S, Farooq M, Sarwar T, Tareen MJ, Wahid MA. 2016. Flood modeling and simulations using hydrodynamic model and ASTER DEM—a case study of Kalpani River. Arab J Geosci. 9(6):439.
- United Nations Economic and Social Commission for Western Asia; Bundesanstalt für Geowissenschaften und Rohstoffe (UN-ESCWA and BGR). 2013. Inventory of Shared Water Resources in Western Asia. Beirut. https://waterinventory.org/sites/waterinventory.org/files/chapters/Chapter-05-Shatt-al-Arab-Karkheh-and-KarunRivers-web_0.pdf.
- United Nations Office for the Coordination of Humanitarian Affairs. 2019a. Floods in Iran: UN support to Government-led efforts to help affected people. Available online: https://reliefweb.int/report/iran-islamic-republic/floods-iran-un-support-government-led-efforts-help-affected-people [accessed 2021 July 1].
- United Nations Office for the Coordination of Humanitarian Affairs. 2019b. Iraq: Flood-affected areas in Missan and Basra Governorates as of 18 April 2019. https://reliefweb.int/map/iraq/iraq-flood-affected-areas-missan-and-basra-governorates-18-april-2019.
- Vocal. 2020. https://vocal.media/theSwamp/differences-between-floods-in-rich-and-floods-in-poor-countries.
- Wang Y, Li Z, Tang Z, Zeng G. 2011. A GIS-based spatial multi-criteria approach for flood risk assessment in the Dongting Lake region, Hunan, Central China. Water Resour Manage. 25(13):3465–3484.
- Wheater H, Evans E. 2009. Land use, water management and future flood risk. Land Use Policy. 26:S251–S264.
- Wipulanusat W, Nakrod S, Prabnarong P. 2009. Multi-hazard risk assessment using GIS and RS applications: a case study of Pak Phanang Basin. Walailak J Sci & Tech. 6(1):109–125.
- Wu Y, Zhong P, Zhang Y, Xu B, Ma B, Yan K. 2015. Integrated flood risk assessment and zonation method: a case study in Huaihe River basin. Nat Hazards. 78(1):635–651.
- Xiao Y, Yi S, Tang Z. 2016. GIS-based multi-criteria analysis method for flood risk assessment under urbanization. In: 2016 24th International Conference on Geoinformatics. p. 1–5.
- Xiao Y, Yi S, Tang Z. 2017. Integrated flood hazard assessment based on spatial ordered weighted averaging method considering spatial heterogeneity of risk preference. Sci Total Environ. 599-600 (2017):1034–1046.
- Yadollahie M. 2019. The flood in Iran: a consequence of the global warming? Int J Occup Environ Med. 10(2):54–56.
- Yahaya S, Ahmad N, Abdalla RF. 2010. Multicriteria analysis for flood vulnerable areas in Hadejia-Jama’are River Basin, Nigeria. Eur J Sci Res. 42 (1):71–83.
- Yair A, Lavee H. 1985. Runoff generation in arid and semi-arid zones. In: Anderson MG, Burt TP, editors. Hydrological forecasting. Wiley and Sons, Chichester.
- Yan B, Fang NF, Zhang PC, Shi ZH. 2013. Impacts of land use change on watershed streamflow and sediment yield: an assessment using hydrologic modelling and partial least squares regression. J Hydrol. 484:26–37.
- Yousefi S, Mirzaee S, Keesstra S, Surian N, Pourghasemi H, Zakizadeh H, Tabibian S. 2018. Effects of an extreme flood on river morphology (case study: Karoon River, Iran. Geomorphology. 304:30–39.
- Zhang C, Wan Q, Zhang JQ. 2003. The method of flood disaster risk evaluation based upon data of grid square. Geo-Inform Sci. 69–73(4). in Chinese.
- Zhang J, Chen Y. 2019. Risk assessment of flood disaster induced by typhoon rainstorms in Guangdong province. China. Sustain. 11(10):2738.
- Zhang JY, Xu XM. 2002. Test on L-moment estimation method for GEV and P-III Distribution in regional flood frequency analysis. Hydrology. 22(6):36–38. in Chinese.
- Zhao L, Hou R, Wu F, Keesstra S. 2018. Effect of soil surface roughness on infiltration water, ponding and runoff on tilled soils under rainfall simulation experiments. Soil Tillage Res. 179:47–53.
- Zheng Q, Lyu HM, Zhou A, Shen SL. 2021. Risk assessment of geohazards along Cheng-Kun railway using fuzzy. AHP Incorporated into GIS. Geomatics Nat Hazards Risk. 12(1):1508–1531.
- Zhiyu L, Xiaotao C, Zuhua C, Haotao W, Li Z, Lai ES, Kunitsugu M, Kim Y, Cheong TS, Chung G, et al. 2013. Guidelines on Urban Flood Risk Management (UFRM). ESCAP/WMO Typhoon Committee Secretariat, Macao: China.
- Zou Q, Zhou J, Zhou C, Song L, Guo J. 2013. Comprehensive flood risk assessment based on set pair analysis-variable fuzzy sets model and fuzzy AHP. Stoch Environ Res Risk Assess. 27(2):525–546.