
 ?Mathematical formulae have been encoded as MathML and are displayed in this HTML version using MathJax in order to improve their display. Uncheck the box to turn MathJax off. This feature requires Javascript. Click on a formula to zoom.
Abstract
The continuous advancement of urbanization and the acceleration of global climate warming have severely aggravated the heatwave vulnerability of the urban complex human–land system. Therefore, the scientific assessment of urban heatwave vulnerability (UHV) is particularly critical. We used Xiamen City, one of the representative heatwave disaster-prone cities, as a case study area. We then constructed a UHV index system that coupled adaptability and selected 12 indicators from the three dimensions: exposure, susceptibility, and adaptability. The back propagation neural network (BPNN) model was used to composite each indicator layer and produce UHV results. Finally, we analyzed the spatial distribution characteristics of UHV. We found that the BPNN model had good training performance, with an overall accuracy of 0.92986. The value of UHV ranged from 0 to 1 and was divided into five grades, from low to high were 18.45%, 18.72%, 17.16%, 28.76%, and 16.91. In terms of spatial characteristics, high adaptability significantly improved UHV. The high value of UHV presented specific agglomeration characteristics, and the extremely vulnerable and disordered areas were mainly located in Huli District and the junction of Siming District and Huli District. The research will provide a new theoretical perspective and framework for urban heatwave assessment and help for disaster management and sustainable development in a high-risk area.
Introduction
In the past century, global warming has become one of the significant trends and characteristics of climate change. According to "Blue Book on Climate Change in China 2020", the global warming trend continues. The average surface temperature of the world's land and sea in 2019 was about 1.1 °C higher than the preindustrial level (NCC 2020). Meanwhile, with the acceleration of urbanization, the scale of urban construction land and population density has increased dramatically, the intensity and scope of human activities have gradually expanded, and the urban system has become increasingly complex, which has had a significant impact on urban climate (Kalnay and Cai Citation2003; Mohan and Kandya Citation2015; Oleson et al. Citation2015). Under the background of global warming and urbanization, extreme heatwave events frequently occur worldwide and have evolved into severe meteorological disasters. For example, the heatwave in France caused more than 15,000 deaths in 2003, and forest fires broke out in Spain and Portugal (Poumadère et al. Citation2005). Driven by the El Niño event, 2016 ushered in the "hottest year in history." The cities in northern India set a record for the highest temperature in 60 years (Jacox et al. Citation2016). The heatwave disaster events not only have a direct negative impact on human health but also seriously affect the production and life of residents (Lissner et al. Citation2012; Tian et al. Citation2013). Such as the overloaded operation of urban water supply and power supply equipment, the chaos of transportation system, the decrease of crop yield and the change of agricultural production, etc. (Xu et al. Citation2009), further aggravate the vulnerability of the urban man–land composite system (Uejio et al. Citation2011; Yang et al. Citation2019).
As an essential type of regional natural disaster, urban heatwave disasters have been extremely severe at the end of the 20th century and will continue to increase in intensity, frequency, and duration in the future (Green et al. Citation2016; Oliver et al. Citation2017). Therefore, scientific assessment of urban heatwave disasters has been a hot field of natural disaster research. In the early days, research on urban heatwave disasters mainly focused on the characteristics of heatwave weather and used meteorological data on a large regional scale to explore the causes of a heatwave from the perspective of meteorology or catastrophe (Shi et al. Citation2008; Li et al. Citation2012). With the rapid development of remote sensing and GIS technology, heatwave disasters assessment pays close attention to the internal regional scale of cities and uses multisource remote sensing data to analyze the formation and evolution in urbanization (Clinton and Gong Citation2013; Hu and Brunsell Citation2013; Dilawar et al. Citation2021). However, in the further deepening of research work, it is found that only meteorological data or single remote sensing temperature product data cannot accurately quantify and characterize the profound impact of heatwave disasters, which usually involves land use, social economics, population, natural environment, etc. (Macintyre et al. Citation2018). It is necessary to combine a specific theoretical framework to conduct a comprehensive assessment, among which the risk and vulnerability theoretical frameworks are widely used (Tong et al. Citation2015; Kim et al. Citation2017; Tran et al. Citation2020). The risk framework focuses on possible losses under heatwave pressure and emphasizes the exposure of the man–land composite system. For example, Tomlinson et al. (Citation2011) and Dugord et al. (Citation2014) analyzed the spatial pattern of heatwave disaster risk in Birmingham, UK, and Berlin, Germany, respectively. However, why can urban life activities exposed to heatwave disasters still be able to develop sustainably? Gallopin (Citation2006) believes that it should be positioned as the adaptability and resilience of the man–land system under external pressure. Only in this way can we understand why some people or regions can better cope with the harmful effects of heatwave disasters (Sui Citation2011). Compared with the risk framework, which does not indicate how the adaptability of urban residents, communities, and governments affects heatwave disasters, the vulnerability framework pays more attention to these factors (Turner Citation2010; Shui et al. Citation2017).
The vulnerability framework has been a hot theoretical framework in recent years, widely used in climate change, disaster management, and sustainable development research (Renard Citation2017; Berrouet et al. Citation2018; Chauhan et al. Citation2020; Yang et al. Citation2021). Urban heatwave vulnerability (UHV) refers to the degree of damage or threat that the man–land composite system under the stress of heatwave disasters driven by natural factors and human activities, which gradually evolves into a collection including a series of related concepts such as exposure, susceptibility, adaptability, resilience, etc. (Xie et al. Citation2015; Hatvani-Kovacs et al. Citation2016; Dong et al. Citation2020). Johnson et al. (Citation2012) used Chicago as a case, selected 25 indicators such as socioeconomic and natural environmental indicators, and constructed an evaluation model of extreme heat vulnerability on the neighborhood scale. Wolf et al. (Citation2013) developed a heatwave vulnerability index from the aspects of exposure, sensitivity, and adaptability, which measured the spatial characteristics of heatwave vulnerability of London’s built-up areas. Kazak (Citation2018) discussed the impact of different adaptation actions, such as land use, wind chill, and green infrastructure, on the heat island effect of the Wroclaw larger urban zone in Poland. As for the weight determination method of each evaluation index, it usually includes the experts grading method, analytic hierarchy process, principal component analysis, the entropy method, grey relational analysis, etc. (He et al. Citation2008; Boori et al. Citation2021; Sandeep et al. Citation2021; Xia et al. Citation2021), which are unsuitable for nonlinear analysis of complex systems. The city is a complex adaptive system with the characteristics of nonlinearity, interaction, and complexity (Nel et al. Citation2018; Qiu Citation2018). In the face of the combined effects of multiple factors, it is difficult for traditional methods to comprehensively and objectively evaluate the effects of all factors. Scholars have also proposed using the model to perform nonlinear parallel learning and training because of the shortage, among which artificial neural networks, Bayesian network models, and genetic algorithms are widely used (Yang et al. Citation2017; Fan and Xu Citation2020; Junquera and Gret-Regamey Citation2020).
There are few studies on UHV coupled with adaptability and few related models used for spatial measurement. Therefore, based on previous research, our research intends to conduct empirical research and choose a typical heatwave events-prone city as the research area. In this paper, the research purpose is as follows: 1) Construct a comprehensive evaluation index system on UHV that consider the natural environmental factors and urban adaptability; 2) Utilize relevant model to synthesize UHV evaluation indicators that suitable for urban complex systems. To reach this goal, the technical route of this paper is as follows: 1) Construct the UHV index system of 12 indicators by using exposure–susceptibility–adaptability framework; 2) Use of GIS and remote sensing methods to generate thematic raster data; 3) Use BPNN model for weight determination, and visualize the spatial distribution of UHV in the study area; 4) Analyze the spatial distribution characteristics of UHV, and conduct comprehensive partitioning based on the coupling and coordination relationship of the criterion layer. This research will help enrich the urban heatwave disasters theory, provide a reference for multiple stakeholders, and improve the ability of cities under global climate change.
Materials and methods
Study area
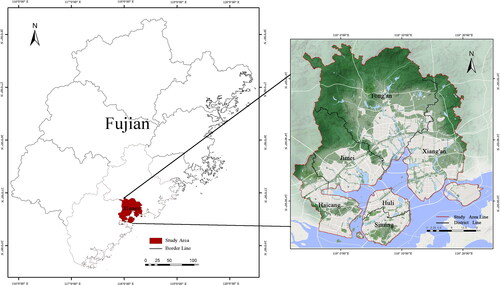
Xiamen City is located in the southeast of Fujian Province, China, at 117°53′36′′E to 118°25′17′′E and 24°25′02′′N to 24°54′37′′N, and contains six district-level administrative units comprising Siming District, Huli District, Jimei District, Haicang District, Tongan District, and Xiang’an District, with a land area of approximately 1700 km2 (). The climate in the study area is a typical subtropical Marine monsoon climate with a mean annual temperature of approximately 21 °C, and the average annual rainfall for many years is approximately 1200 mm. Its terrain is dominated by coastal plains, hills, and terraces, and the water system is developed, with Jiulong River among the three major rivers in Fujian Province.
Figure 1. Location of Xiamen City.
With the rapid development of the economy and urbanization, the land use types in the region have changed dramatically. The vulnerability of the ecosystem has increased, which has led to a continuous upward trend in temperature and frequent heatwave events. According to the statistics of meteorological data from 1980 to 2015, there were 24 heatwave events during this period. The average temperature rise rate was 0.43 °C per decade (P < 0.01), and the maximum extreme temperature reached as high as 39.2 °C. By the end of the 21st century, if Xiamen City does not consider factors such as ecological environment, energy conservation, and emission reduction and continues to follow the extensive development route, the average temperature will rise by as much as 6.8 °C. However, the temperature rises that modern human society can tolerate is 2 °C, which will seriously affect the production and life of urban residents and bring about a series of ecological, environmental problems.
Data source
The research data mainly include population data, remote sensing data, socioeconomic data, and basic vector data, and provides the data types, sources, and accuracy. The MOD13Q1 data was used to calculate vegetation coverage, and the MRT tool was used to mosaic, clip, and extract the NDVI band. The Landsat OLI data, which we selected with a maximum temperature exceeded 35 °C on the day from 2015 to 2020, was used to retrieve surface temperature.
Table 1. Data types, accuracy, and source.
In data processing, ArcGIS 10.5 was used for data resampling and projection transformation. Eventually, the grid data of the index assessment layer was formed with the spatial resolution of 100 m × 100 m, using a unified WGS-1984 ellipsoid coordinate and UTM projection.
Construction of UHV assessment index system
Framework construction and indicators selection
Based on the existing assessments of heatwave disasters, we considered that UHV means the degree of adverse impact damage or threat to the urban man–land composite system when faced with heatwave disasters driven by natural environmental and social factors. The core elements of UHV are to show the spatial differences in exposure, susceptibility, and adaptability and demonstrate the ability to cope with heatwave disasters.
Heatwave exposure refers to the natural attributes of the system exposed to abnormal climate changes, which can be understood as the proximity of people or systems to disasters, has a positive correlation with vulnerability, and is a sufficient and necessary condition for vulnerability. Heatwave susceptibility is an inherent attribute of the urban complex system, which considers whether the urban spatial layout can provide good feedback on the demands of urban residents. Susceptibility is also positively correlated with vulnerability, indicating that the higher the susceptibility to disaster losses, the more severe the vulnerability. Heatwave adaptability mainly reflects the ability of the city's multiple stakeholders to withstand the threat of heatwave disasters and the subjective response ability to reduce disaster losses, which has a negative correlation with vulnerability ().
Figure 2. Conceptualization of UHV.
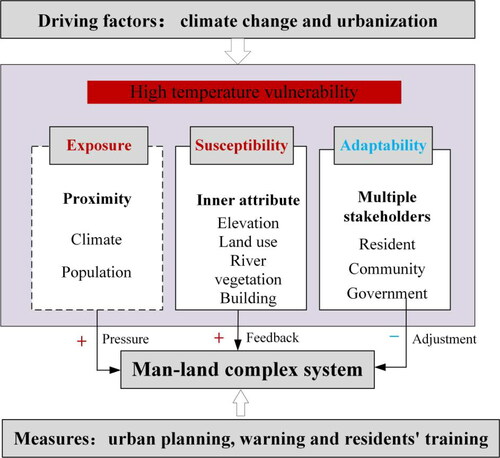
In the criterion layer of exposure indicators, surface temperature has been empirically verified in the health effects of the heatwave (Yang et al. Citation2012), and population density can reflect the degree of exposure of people to heatwave (Jones et al. Citation2015). In the criterion layer of susceptibility indicators, elevation, vegetation coverage, drainage density, land use type, and building density have been promoted and applied in UHV assessment (Xuan Citation2011; Dong et al. Citation2015; Wu et al. Citation2016). The adaptability of the city comes from multiple stakeholders, from the three aspects of residents, communities, and government (Smit and Wandel Citation2006; Hinkel Citation2011; Weber et al. Citation2015). The heatwave adaptability indicators we choose mainly include resident attributes, GDP density, and fairness of summer facilities. Therefore, we constructed the UHV assessment framework from three dimensions of “exposure–susceptibility–adaptability,” considered the availability and spatial visibility of data, and attempted to display the spatial distribution by combining 12 indicators of UHV ().
Table 2. Evaluation index system of UHV.
Preprocessing method of vulnerability indicators
Land surface temperature retrieval. The band 10 of Landsat8 TIRS with strong stability was selected to calculate the surface temperature based on the radiative transfer equation.
(1)
where Ts is the surface temperature, B(Ts) is the black-body thermal radiation brightness; Lλ is the thermal infrared radiation brightness value, L↑ and L↓ are the downward and upward radiation brightness of atmosphere, respectively; τ is the transmittance of the atmosphere at thermal infrared; ε is the surface emissivity; K1 and K2 are the thermal infrared calibration constants, where K1=774.89 W· m−2 ·sr−1 ·um−1), K2=1321.08 K.
2. Dimidiate pixel model. The principle of this model is to assume that pixel information is only contributed by vegetation and soil, and vegetation coverage can be regarded as the weight of vegetation type. Vegetation coverage is calculated as follows:
where FVC is vegetation coverage, and the value range is 0–1; NDVI is normalized difference vegetation index; NDVIsoil is the NDVI value of pixels entirely covered by soil or no vegetation; NDVIveg is the NDVI value of pixels entirely covered by vegetation.
3. Equity analysis of summer facilities. We considered the population demand, the level of summer facilities, and the impact of spatial proximity and constructed a spatial equity index model. The relevant parameters () and calculation formulas as follows:
Table 3. Types, number, weight, and service radius of summer facilities.
where Ei is the spatial equity in district i; Eij is the spatial equity of facilities j in district i;wj is the weight of facilities j, and n is the number of facilities type; Rij is the supply capacity of facilities j in district i, and is calculated by the serviced radius of various facilities; Dij is the distance effect; Ni is the population demand in district i, and is determined by population density in district i.
Back propagation neural network model
Artificial neural network (ANN) is a network system formed by a large number of simple processing units, which reflects many basic features of the human brain function. It is not an authentic portrayal of the human brain and nervous system, but just some simplification, abstraction, and simulation of the behavior. As the most mature ANN algorithm, back propagation neural network (BPNN) was developed based on the back propagation algorithm proposed by Rumelhart, Hinton, Williams (Citation1986), and has been widely used in the determination of index weights (Lek and Guegan Citation1999; Haidar et al. Citation2008; Cui et al. Citation2020). The basic idea is to perform nonlinear parallel learning and training on a large number of sample data based on a specific learning mechanism. Through continuous iterative adjustment of the error, the connection weight matrix between the input layer and the hidden layer that meets the requirements is obtained, and the weight of each index is finally calculated.
BPNN has a solid ability to deal with the evaluation problems of complex systems and is more suitable for situations with a large amount of sample data and relatively independent indicators. In this paper, based on the BPNN model and Matlab programming, we compounded the indicators and got the spatial distribution of UHV. The core principle steps are as follows ().
Figure 3. Compound process of UHV based on BPNN model.
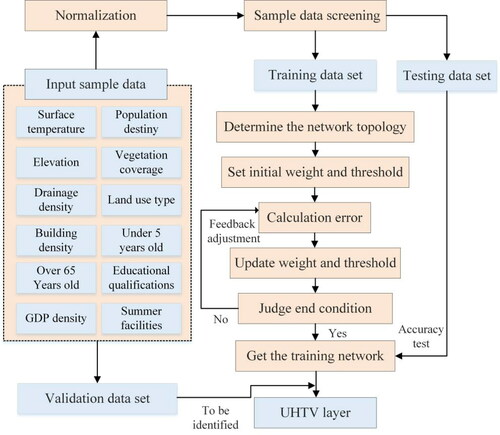
Input data normalization and classification. The range standardization method was used to normalize the index layer of UHV, and the normalized data were used as the input data. Then we divided 6870 pieces of input data into training data set, testing data set, and validation data set. The training data set was presented to the network during training, which accounted for 70% of the sample data. The testing data set did not affect training and provided an independent measure of network performance during and after training, which accounted for 15% of the sample data. The validation data set was used to measure network generalization and halt training when generalization stops improve, which accounted for 15% of the sample data.
Construct the network and start training. We set the indicator layer as the number of input neurons, the target layer as the number of the output layer, and the number of hidden layers as 10. That is, the 12-10-1 network structure was constructed. A BPNN algorithm program was written based on Matlab, in which the initial weight and threshold matrix were randomly generated, the activation function used the sigmoid function, the learning rate was 0.1, the maximum number of iterations was 1000, the expected error was 0.5 × 10³, and the performance function was mean squared error (MSE). After the training data set was propagated forward, if the error did not meet the preset accuracy, the error would be back propagated from the output layer to the input layer, and the error would be gradually reduced by adjusting the weight and threshold.
Test training accuracy. We used the R values to measure model network performance. The closer the R value is to 1, the better the performance.
Analysis of spatial characteristics of UHV
Getis-Ord Gi*
Getis-OrdGi* was used to measure the region’s correlation characteristics and test the statistically significant high and low values in a local area. That is the spatial distribution of hot spots and cold spots.
(6)
(6)
(7)
(7)
where n is the number of units; Xj and Xj is the value of UHV in unit i and j; wij is the spatial adjacent weight matrix between unit i and j; E(Gi*) is the expected value of the Getis-Ord Gi*; Var(Gi*) is the coefficient of variation of Getis-Ord Gi*; Z(Gi*) represents the degree of accumulation of cold and hot spots. When Z(Gi*) shows a positive and significant correlation, it is a hot spot area in unit i. Conversely, the cold spot area in unit i.
Coupling and coordination model
The coupling coordination model was used to measure the interaction relationship of exposure, susceptibility, and adaptability.
(8)
(8)
(9)
(9)
(10)
(10)
where U is the comprehensive score of the exposure and susceptibility subsystems. A is the score of the adaptability subsystems; α and β are undetermined parameters, which are determined by the importance of each subsystem to UHV; C is the coupling degree of the system, T is the coordination degree of the system; D is the degree of coupling and coordination of the system. The larger the value of D, the stronger the degree of coupling and coordination, and vice versa.
Results and analysis
Spatial distribution of indicators
Indicators of exposure
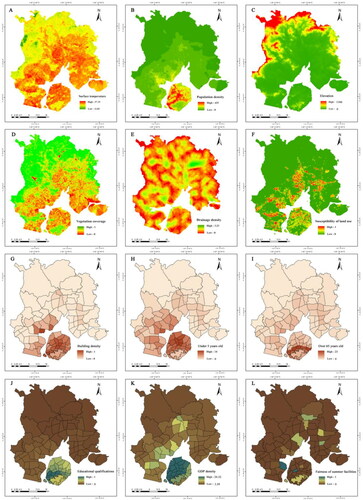
The average value of surface temperature, ranged from 11.83 to 57.35 °C, was formed by multi-period remote sensing images from 2015 to 2020, and the spatial distribution of surface temperature was characterized by gradually increasing from north to south (). The population density of Xiamen City in 2020 ranged from 0 to 425 people per hm2 and gathered in Siming District and Huli District. The spatial distribution was characterized by gradually decreasing from coastal to inland. In recent years, many people from other places have moved into residence, which has increased the degree of population exposure in the region ().
Figure 4. Spatial distribution of 12 indicators of UHV.
Indicators of susceptibility
The higher the elevation, the thinner the air, resulting in inadequate heat storage capacity and ultimately lower susceptibility of UHV. The average value of elevation was 63.2 m and ranged from 0 to 1162 m. Spatially, areas with higher elevations were mainly distributed in the city’s northern periphery (). The shelter and ecological service provided by vegetation can better reduce the susceptibility of cities to heatwave disasters. The average value of vegetation coverage reached 0.66, and the spatial distribution characteristics showed a gradually increasing trend from the coast to the inland (). As the area of urban water bodies increases, the intensity of the heat island can be weakened to a certain extent. The water system of Xiamen City is relatively developed and contains land water resources such as Xixi and Zhuxi. Spatially, the higher density of drainage was located in Tongan District and Jimei District (). Different land use types have different susceptibility weights. We assigned a value of 1 for industrial land and logistics and warehouse, 0.8 for commercial and business, street and warehouse, and residential land, 0.6 for administration and public services lands, 0.4 for municipal utility land, and 0.2 for green space and other land (). The building density is closely related to UHV. Spatially, the higher density of buildings was located in Haicang District, Huli District, and Siming District ().
Indicators of adaptability
The age structure and education qualifications reflected the adaptability of urban residents. The population under 5 years old ranged from 0 to 14 people per hm2, the population over 65 years old ranged from 0 to 23 people per hm2, and the proportion of education with a university degree reached 17.79%. At the street scale, Malong Street, Houpu Street, and Fanghu Street in Huli District, Huguang Street and Qianpu Street in Siming District, and Xinglin Street Haicang District had a higher density of age structure under 5 years old (). Huguang Street, Jialian Street, Lujiang Street, and Qianpu Street in Siming District had a higher density of age structure over 65 years old (). Compared with the streets in other districts, the streets in Huli District and Siming District had higher educational qualifications (). The adaptability of urban communities and governments was reflected by the GDP density and fairness of summer facilities. The GDP density in 2015 ranged from 3.59 to 24.32 million yuan·hm−2, and the main economic corridor was located between Huli District and Siming District (). We obtained the spatial fairness of summer facilities through the spatial equity index model. It can be found that the distribution of summer facilities was generally unbalanced at the street scale. The overall fairness of summer facilities on the island was relatively high, but the fairness of Siming District and Huli District showed huge differences. The areas with high fairness were mainly concentrated in Kaiyuan Street, Gulangyu Street, Yundang Street, and Wucun Street in Siming District, while the fairness of most streets in Huli District was relatively low, especially Dianqian Street ().
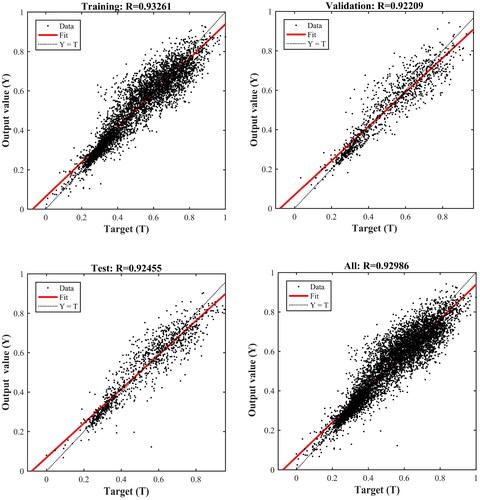
Analysis of UHV training results
After network training at epoch 36, the error value was less than 0.5 × 10³, which met the accuracy requirements. The R value training results of each data set are as follows, where the R value of the training data set was 0.93261, the R value of the validation data set was 0.92209, the R value of the test data set was 0.92455, and the R value of all data set was 0.92986 (), which showed that the model had a good performance. Furthermore, according to the training results, the spatial distribution of the UHV was obtained. We then divided the UHV into five grades according to the natural breaks, namely low vulnerability (0–0.3), slight vulnerability (0.3–0.45), moderate vulnerability (0.45–0.58), strong vulnerability (0.58–0.68), and extreme vulnerability (0.68–1).
Figure 5. R value of training results.
Regarding the ratio of the grade of UHV, the ratio of strong vulnerability was the largest, which reached 28.76%, and low vulnerability, slight vulnerability, moderate vulnerability, and extreme vulnerability were 18.45%, 18.72%, 17.16%, and 16.91%, respectively. It was found that the classification of the five grades was relatively balanced in Xiamen City. From the perspective of spatial distribution, UHV presented an increasing spatial distribution from north to south. That is, the northern and eastern areas of the city’s periphery showed low vulnerability and slight vulnerability, the central and southern areas showed strong and extreme vulnerability. The low and slight vulnerability were mainly concentrated on the edge of Tongan District, Xiang’an District, and Jimei District, which mainly were mountain and water areas. As the transition zone, the moderate vulnerability area had a wide distribution range and was relatively scattered, mainly distributed in village construction land. The strong vulnerability was mainly distributed north of the coastline, located in the northern central area of Haicang District, Tongan District, Xiang’an District, and Jimei District. The extreme vulnerability showed the characteristics of “contiguous centralization,” which was mainly distributed in the Huli District and the northern area of Siming District (). From the perspective of district statistics of UHV, the average value of the UHV in Siming District, Huli District, Haicang District, Jimei District, Xiang’an District, and Tongan District were 0.62, 0.73, 0.57, 0.52, 0.58, and 0.43, respectively, and the ratio of extreme vulnerability was 40.38%, 73.02%, 23.61%, 18.29%, 17.62% and 5.26% (). The average value of the UTHV and the ratio of extreme vulnerability accounted for the highest in Huli District, while the low and slight vulnerability accounted for the lowest. Under the same background of exposure and susceptibility as Huli District in Siming District, adaptability significantly improved the UHV of Siming District.
Figure 6. Spatial distribution of UHV.
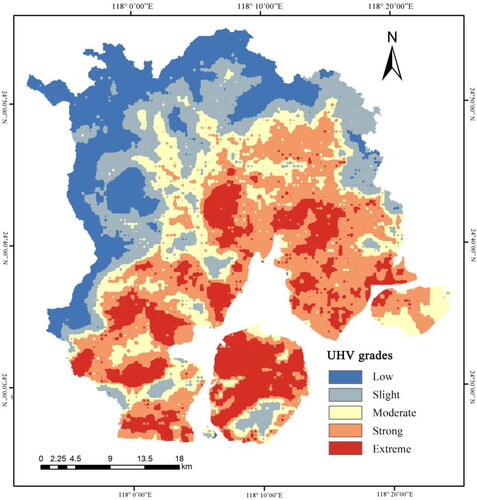
Table 4. District statistics of UHV (km2, %).
Spatial distribution characteristics of UHV
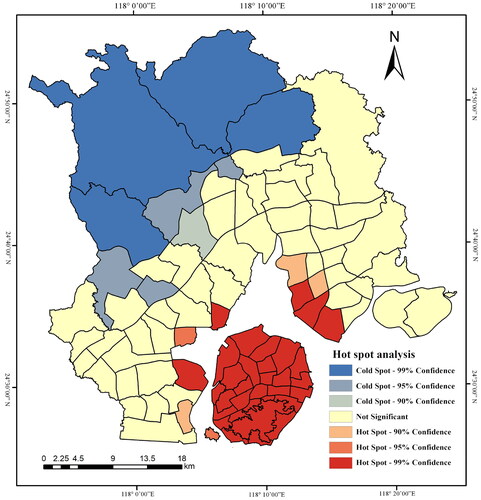
Getis-Ord Gi* tests whether there are statistically significant high and low values in local areas. We set the confidence of 90% as statistical significance to conduct hot spot analysis on UHV and found noticeable spatial differences between cold and hot spots. With a Z score greater than 2.63 (P < 0.01), the hot spots were mainly distributed in Siming District and Huli District, and a few were located in the industrial zone and urban–rural junction area in Haicang District and Xiang'an District. With a Z score less than −2.67 (P < 0.01), the cold spots were concentrated in the outer regions of Tongan District and Jimei District, mainly due to the characteristics of population evacuation, low surface temperature, and high vegetation coverage. The mild spots, with a Z score less than 1.58 and greater than −1.54 (P > 0.1), were between the hot spots and the cold spots, which played a role in transitional relaxation ().
Figure 7. Hot spot analysis of UHV.
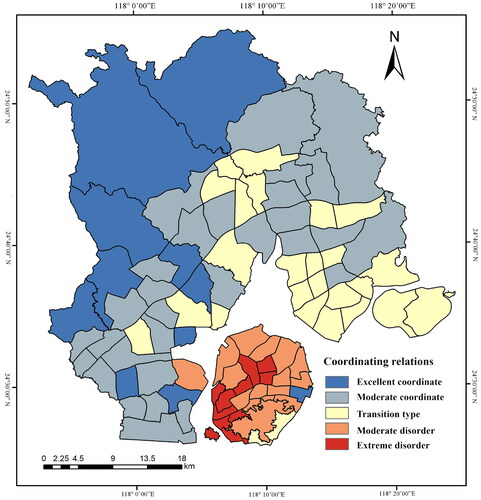
The development status of each street is different, and the type of coupling coordination relationship should also be different. High exposure susceptibility and low adaptability make urban residents more vulnerable to heatwave disasters. According to the coupling and coordination calculation formula of exposure susceptibility and adaptability subsystems, we divided the D value into five types at equal intervals, namely excellent coordinate, moderate coordinate, transition type, moderate disorder, and extreme disorder. The characteristics of extreme disorder were high exposure susceptibility and low adaptability, and the representative areas were Malong Street, Fanghu Street and Houpu Street in Huli District, and Yundang Street, Zhonghua Street, and Gulangyu in Siming District (). This type of street reflects the problems that have slowly accumulated in the process of urban development. Dilapidated old houses, hard ground, and a large number of low-level buildings occupy space. Residents live in an environment with poor housing structures and a lack of summer service facilities. At the same time, the urban road system does not consider ventilation issues, and the cost of re-renovating and constructing parks and green space is large, which limits the possibility to improve the adaptability of residents to the heatwave.
Figure 8. Coordinating relations of UHV.
Discussion
Comparisons and limitations
The main urban area of Xiamen shows high exposure, high susceptibility, and high adaptability, and the periphery shows low exposure, low susceptibility, and low adaptability. These have some similarities with the cases of London in the United Kingdom, Shanghai in China, and Pittsburgh and Chicago in the United States (Johnson et al. Citation2012; Wolf et al. Citation2014; Bradford et al. Citation2015; He et al. Citation2019). That is to say, the higher the concentration of social factors such as population, economy, etc., the more serious the heatwave damage caused by natural elements. At the same time, the stronger the adaptability of high-temperature facilities, prevention, early warning, etc., the lower the social vulnerability. However, the spatial distribution of UHV obtained by coupling adaptability in this study has new findings compared with previous studies. There is no apparent difference in exposure and susceptibility between the Huli District and Siming District on the island. Still, the UHV is different, indicating that the difference in adaptability has significantly improved the degree of regional coupling and coordination.
Due to data acquisition and technology limitations, the research results still need to be further deepened. The wide range of UHV evaluation data sources makes data scale control very important, and the accuracy of the evaluation results largely depends on the quality of regional data. Although this research has focused on the spatial pixel scale, which can identify vulnerable groups and influencing factors more accurately, it still needs to strengthen small-scale critical indicator monitoring. In the future, it is necessary to obtain more diversified data of higher resolution, reveal micro-geographic differences and spatial associations in more depth, and prepare for the detailed assessment of UHV. For example, we can collect relevant residents' adaptability data through questionnaire surveys (Shui et al. Citation2017).
In addition, the method for determining the weight of the vulnerability index has not formed a unified standard, and the comparison of the results of different evaluation methods is still relatively weak, which is an important issue that needs to be further explored. Although the overall evaluation accuracy of the BPNN model constructed in this study was good, it ignored subjective experience knowledge to a certain extent, and the evaluation results may be contrary to the subjective preferences of decision makers. In the future, different methods can be used to comprehensively determine indicator weights to improve the reliability and accuracy of UHV evaluation results. Besides, health data can be further collected for comparison and verification, such as summer heatstroke and death statistics, verify the difference with UHV to correct and improve the assessment results (Toloo et al. Citation2013; Nitschke et al. Citation2016).
This study did not analyze the evolution of UHV under time series changes. Based on the perspective of climate change or land use change, by acquiring long-term series of meteorological data and land use change data, different scenarios can be set to obtain significant UHV change areas in future scenarios to propose a systematic and scientific urban heatwave disasters prevention and mitigation decision making (Kazak Citation2018).
Improvement of extremely vulnerable areas
In urban planning in China, the systematic research on urban heatwave disaster prevention strategies is relatively weak, especially compared to European and other developed countries, such as London, Toronto, Vancouver, Chicago, etc., which have compiled special urban extreme heatwave disaster plans. The formulation of systematic, scientific, and reasonable heatwave disaster prevention strategies can improve adaptability and provide strong support for the city’s sustainable development. Based on the evaluation and analysis results, we can propose specific disaster prevention strategies for extremely vulnerable areas from multiple perspectives and multiple subjects.
First, the community should focus on strengthening heatwave disaster training for exceptional people with low adaptability. By organizing onsite learning, holding heatwave knowledge lectures, and opening unique columns in the news media, the residents' awareness of heatwave disaster risk can be enhanced. Second, the government should actively carry out special plans. Based on sorting out the existing problems in infrastructure and public services, speed up constructing a green space network and optimize the spatial layout of summer shelter facilities. Third, the Ministry of Natural Resources should build a heatwave vulnerability early warning information management and decision support platform. Establishing a complete and dynamic urban heatwave disasters database will help improve the efficiency of assessment and improve the current difficulties in data collection and data use. Moreover, it is difficult to communicate and link between various departments at present, and it is impossible to integrate various disaster prevention resources efficiently. By establishing a heatwave vulnerability early warning and decision support platform and improving the early warning mechanism of multiple government departments, it can improve disaster prevention efficiency and reduce losses.
Conclusions
This study focused on the spatial intensity of urban heatwave disasters coupled with adaptability, constructed a vulnerability evaluation index system of urban heatwave disasters suitable for Xiamen City from the three dimensions of exposure, susceptibility, and adaptability, and used the BPNN model to compound the evaluation indicators. The following conclusions were obtained:
The spatial distribution of each evaluation index of UHV was different in the island and outside the island. The Siming District and Huli District on the island had high population density, surface temperature, building density, and low vegetation coverage, resulting in high exposure and susceptibility. In the evaluation indicators of adaptability, the proportion of people under 5 years old and people over 65 years old was high. However, the GDP density, the fairness of summer facilities, and educational qualification were relatively strong.
The BPNN model showed a good training performance, with an overall accuracy of 0.9286. UHV grades accounted for 18.45%, 18.72%, 17.16%, 28.76% and 16.91 from low to high respectively. The grade of extreme vulnerability was mainly distributed in the Huli District, the junction of Siming District and Huli District, and the area north of the coastline. And the district statistics of UHV showed that the extreme vulnerability of the Huli District accounted for 73.02%, while the low and moderate vulnerability was 0%.
In analyzing the spatial characteristics of UHV, the hot spots were mainly concentrated in Siming District and Huli District. The extremely disordered streets were Malong Street, Fanghu Street, and Houpu Street in Huli District, and Yundang Street, Zhonghua Street, and Gulangyu in Siming District.
Acknowledgments
The authors thank the anonymous reviewers for their helpful suggestions.
Data availability statement
The data that support the findings of this study are available on request from the corresponding author, Yang HF.
Disclosure statement
No potential conflict of interest was reported by the authors.
Correction Statement
This article has been republished with minor changes. These changes do not impact the academic content of the article.
References
- Boori MS, Choudhary K, Paringer R, Kupriyanov A. 2021. Spatiotemporal ecological vulnerability analysis with statistical correlation based on satellite remote sensing in Samara, Russia. J Environ Manage. 285:112138.
- Berrouet LM, Machado J, Villegas-Palacio C. 2018. Vulnerability of socio-ecological systems: a conceptual framework. Ecol Indic. 84:632–647.
- Bradford K, Abrahams L, Hegglin M, Klima K. 2015. A heat vulnerability index and adaptation solutions for Pittsburgh, Pennsylvania. Environ Sci Technol. 49(19):11303–11311.
- Chauhan N, Shukla R, Joshi PK. 2020. Assessing impact of varied social and ecological conditions on inherent vulnerability of Himalayan agriculture communities. Hum Ecol Risk Assess. 26(10):2628–2645.
- Clinton N, Gong P. 2013. MODIS detected surface urban heat islands and sinks: global locations and controls. Remote Sens Environ. 134:294–304.
- Cui SY, Li C, Chen Z, Wang JJ, Yuan JX. 2020. Research on risk prediction of dyslipidemia in steel workers based on recurrent neural network and LSTM neural network. IEEE Access. 8:34153–34161.
- Dilawar A, Chen BZ, Trisurat Y, Tuankrua V, Arshad A, Hussain Y, Measho S, Guo LF, Kayiranga A, Zhang HF, et al. 2021. Spatiotemporal shifts in thermal climate in responses to urban cover changes: a case analysis of major cities in Punjab, Pakistan. Geomat Nat Haz Risk. 12(1):763–793.
- Dong DH, Huang G, Qu X, Tao WC, Fan GZ. 2015. Temperature trend–altitude relationship in China during 1963–2012. Theor Appl Climatol. 122(1–2):285–294.
- Dong JQ, Peng J, He XR, Corcoran J, Qiu SJ, Wang XY. 2020. Heatwave-induced human health risk assessment in megacities based on heat stress–social vulnerability–human exposure framework. Landscape Urban Plan. 203. doi: https://doi.org/10.1016/j.landurbplan.2020.103907
- Dugord PA, Lauf S, Schuster C, Kleinschmit B. 2014. Land use patterns, temperature distribution, and potential heat stress risk – the case study Berlin, Germany. Comput Environ Urban. 48:86–98.
- Fan JK, Xu JG. 2020. Vulnerability assessment of urban agglomeration based on neural network model: a case study of Central Yunnan Urban Agglomeration. J Nat Resour. 35(12):2875–2887 (in Chinese)
- Gallopin GC. 2006. Linkages between vulnerability, resilience, and adaptive capacity. Glob Environ Change. 16(3):293–303.
- Green HK, Andrews N, Armstrong B, Bickler G, Pebody R. 2016. Mortality during the 2013 heatwave in England – how did it compare to previous heatwaves? A retrospective observational study. Environ Res. 147(May):343–349.
- Haidar AMA, Mohamed A, Hussian A. 2008. Vulnerability assessment of a large sized power system using neural network considering various feature extraction methods. J Electr Eng Technol. 3(2):167–176.
- Hatvani-Kovacs G, Belusko M, Skinner N, Pockett J, Boland J. 2016. Heat stress risk and resilience in the urban environment. Sustain Cities Soc. 26:278–288.
- He C, Ma L, Zhou LG, Kan HD, Zhang Y, Ma WC, Chen B. 2019. Exploring the mechanisms of heat wave vulnerability at the urban scale based on the application of big data and artificial societies. Environ Int. 127:573–583.
- He LI, Zhang PY, Cheng YQ. 2008. Concepts and assessment methods of vulnerability. Prog Geogr. 27(2):18–25 (in Chinese).
- Hinkel J. 2011. Indicators of vulnerability and adaptive capacity: towards a clarification of the science–policy interface. Global Environ Chang. 21(1):198–208.
- Hu LQ, Brunsell NA. 2013. The impact of temporal aggregation of land surface temperature data for surface urban heat island (SUHI) monitoring. Remote Sens Environ. 134:162–174.
- Jacox MG, Hazen EL, Zaba KD, Rudnick DL, Edwards CA, Moore AM, Bograd SJ. 2016. Impacts of the 2015–2016 El Niño on the California Current System: early assessment and comparison to past events. Geophys Res Lett. 43(13):7072–7080.
- Johnson DP, Stanforth A, Lulla V, Luber G. 2012. Developing an applied extreme heat vulnerability index utilizing socioeconomic and environmental data. Appl Geogr. 35(1–2):23–31.
- Jones B, O’Neill BC, McDaniel L, McGinnis S, Mearns LO, Tebaldi C. 2015. Future population exposure to US heat extremes. Nature Clim Change. 5(7):652–655.
- Junquera V, Gret-Regamey A. 2020. Assessing livelihood vulnerability using a Bayesian network: a case study in Northern Laos. Ecol Soc. 25(4):38.
- Kalnay E, Cai M. 2003. Impact of urbanization and land-use change on climate. Nature. 423(6939):528–528.
- Kazak JK. 2018. The use of a decision support system for sustainable urbanization and thermal comfort in adaptation to climate change actions: the case of the Wroclaw larger urban zone (Poland). Sustainability. 10(4):1083.
- Kim DW, Deo RC, Lee JS, Yeom JM. 2017. Mapping heatwave vulnerability in Korea. Nat Hazards. 89(1):35–55.
- Lek S, Guegan JF. 1999. Artificial neural networks as a tool in ecological modelling, an introduction. Ecol Model. 120(2–3):65–73.
- Li ZX, He YQ, Theakstone WH, Wang XF, Zhang W, Cao WH, Du JK, Xin HJ, Chang L. 2012. Altitude dependency of trends of daily climate extremes in Southwestern China, 1961–2008. J Geogr Sci. 22(3):416–430.
- Lissner TK, Holsten A, Walther C, Kropp JP. 2012. Towards sectoral and standardised vulnerability assessments: the example of heatwave impacts on human health. Clim Change. 112(3–4):687–708.
- Macintyre HL, Heaviside C, Taylor J, Picetti R, Symonds P, Cai XM, Vardoulakis S. 2018. Assessing urban population vulnerability and environmental risks across an urban area during heatwaves – implications for health protection. Sci Tot Environ. 610–611:678–690.
- Mohan M, Kandya A. 2015. Impact of urbanization and land-use/land-cover change on diurnal temperature range: a case study of tropical urban airshed of India using remote sensing data – ScienceDirect. Sci Tot Environ. 506–507:453–465.
- National Climate Center. 2020. Blue book on climate change in China 2020.
- Nel D, Du Plessis C, Landman K. 2018. Planning for dynamic cities: introducing a framework to understand urban change from a complex adaptive systems approach. Int Plan Stud. 23(3):250–263.
- Nitschke M, Tucker G, Hansen A, Williams S, Zhang Y, Bi P. 2016. Evaluation of a heat warning system in Adelaide, South Australia, using case-series analysis. BMJ Open. 6(7):e012125.
- Oleson KW, Monaghan A, Wilhelmi O, Barlage M, Brunsell N, Feddema J, Hu L, Steinhoff DF. 2015. Interactions between urbanization, heat stress, and climate change. Clim Change. 129(3–4):525–541.
- Oliver E, Benthuysen JA, Bindoff NL, Hobday AJ, Holbrook NJ, Mundy CN, Perkins-Kirkpatrick SE. 2017. The unprecedented 2015/16 Tasman Sea marine heatwave. Nat Commun. 8:16101.
- Poumadère M, Mays C, Mer SL, Blong R. 2005. The 2003 heat wave in France: dangerous climate change here and now. Risk Anal. 25(6):1483–1494.
- Qiu BX. 2018. Resilient urban design methods and principles based on the complex adaptive system theory. Landsc Archit Front. 6(4):42–47.
- Rumelhart DE, Hinton GE, Williams RJ. 1986. Learning representations by back-propagating errors. Nature. 323(6088): 533–536.
- Renard F. 2017. Flood risk management centred on clusters of territorial vulnerability. Geomat Nat Hazard Risk. 8(2):525–543.
- Sandeep P, Reddy GPO, Jegankumar R, Kumar KCA. 2021. Modeling and assessment of land degradation vulnerability in semi-arid ecosystem of Southern India using temporal satellite data. Environ Model Assess. 26(2):143–154.
- Shi J, Tang X, Cui LL. 2008. Climatic characteristics of high temperature in East China during 1961–2005. J Geogr Sci. 18(3):283–294.
- Shui W, Chen ZC, Deng JM, Li YJ, Wang QF, W WL, Chen YP. 2017. Evaluation of urban high temperature vulnerability of coupling adaptability in Fuzhou, China. J Geogr Sci. 72(5):830–849 (in Chinese).
- Smit B, Wandel J. 2006. Adaptation, adaptive capacity and vulnerability. Global Environ Chang. 16(3):282–292.
- Sui DZ. 2011. Introduction: strategic directions for the geographical sciences in the next decade. Prof Geograph. 63(3):305–309.
- Tian ZX, Li SS, Zhang JL, Guo YM. 2013. The characteristic of heat wave effects on coronary heart disease mortality in Beijing, China: a time series study. Plos One. 8(9):e77321.
- Toloo G, FitzGerald G, Aitken P, Verrall K, Tong SL. 2013. Are heat warning systems effective? Environ Health. 12:27.
- Tomlinson CJ, Chapman L, Thornes JE, Baker CJ. 2011. Including the urban heat island in spatial heat health risk assessment strategies: a case study for Birmingham, UK. Int J Health Geogr. 10:42.
- Tong SL, FitzGerald G, Wang XY, Aitken P, Tippett V, Chen D, Wang X, Guo Y. 2015. Exploration of the health risk-based definition for heatwave: a multi-city study. Environ Res. 142:696–702.
- Tran DN, Doan VQ, Nguyen VT, Khan A, Thai PK, Cunrui H, Chu C, Schak E, Phung D. 2020. Spatial patterns of health vulnerability to heatwaves in Vietnam. Int J Biometeorol. 64(5):863–872.
- Turner BL. 2010. Vulnerability and resilience: coalescing or paralleling approaches for sustainability science? Global Environ Chang. 20(4):570–576.
- Uejio CK, Wilhelmi OV, Golden JS, Mills DM, Gulino SP, Samenow JP. 2011. Intra-urban societal vulnerability to extreme heat: the role of heat exposure and the built environment, socioeconomics, and neighborhood stability. Health Place. 17(2):498–507.
- Weber S, Sadoff N, Zell E, de Sherbinin A. 2015. Policy-relevant indicators for mapping the vulnerability of urban populations to extreme heat events: a case study of Philadelphia. Appl Geogr. 63:231–243.
- Wolf T, McGregor G. 2013. The development of a heat wave vulnerability index for London, United Kingdom. Weather Clim Extreme. 1:59–68.
- Wolf T, McGregor G, Analitis A. 2014. Performance assessment of a heat wave vulnerability index for greater London, United Kingdom. Weather Clim Soc. 6(1):32–46.
- Wu ZF, Wang YN, Kong FH, Sun RH, Chen LD, Zhan WF. 2016. Analysis of the thermal characteristics of selected urban surfaces in a typical residential area based on infrared thermography. J Geogr Sci. 36(17):5421–5431 (in Chinese).
- Xia M, Jia K, Zhao WW, Liu SL, Wei XQ, Wang B. 2021. Spatio-temporal changes of ecological vulnerability across the Qinghai–Tibetan Plateau. Ecol Indic. 123. doi: https://doi.org/10.1016/j.ecolind.2020.107274
- Xie P, Wang YL, Peng J, Liu YX. 2015. Health related urban heat wave vulnerability assessment: research progress and framework. Prog Geogr. 34(2):165–174 (in Chinese).
- Xu JF, Deng ZY, Chen M. 2009. A summary of studying on characteristics of high temperature and heat wave damage in China. Arid Meteorol. 27(02):163–167 (in Chinese).
- Xuan CY. 2011. Impact of water distribution on the atmospheric environment in urban area. Dalian (China): Lanzhou University.
- Yang HF, Zhai GF, Zhang Y. 2021. Ecological vulnerability assessment and spatial pattern optimization of resource-based cities: a case study of Huaibei City, China. Hum Ecol Risk Assess. 27(3):606–625.
- Yang J, Ou CQ, Ding Y, Zhou YX, Chen PY. 2012. Daily temperature and mortality: a study of distributed lag non-linear effect and effect modification in Guangzhou. Environ Health. 11:63.
- Yang J, Yin P, Sun JM, Wang BG, Zhou MG, Li MM, Tong SL, Meng BH, Guo YM, Liu QY. 2019. Heatwave and mortality in 31 major Chinese cities: definition, vulnerability and implications. Sci Tot Environ. 649:695–702.
- Yang J, Tang ZH, Jiao T, Muhammad AM. 2017. Combining AHP and genetic algorithms approaches to modify DRASTIC model to assess groundwater vulnerability: a case study from Jianghan Plain. Environ Earth Sci. 76(12):426.