
 ?Mathematical formulae have been encoded as MathML and are displayed in this HTML version using MathJax in order to improve their display. Uncheck the box to turn MathJax off. This feature requires Javascript. Click on a formula to zoom.
Abstract
Based on the four types of SAR images from Envisat, Radarsat-2, and TerraSAR-X between 2007 and 2019, a linear time-series analysis of Coherence Targets method is employed to acquire the 13-year deformation velocity and cumulative deformation maps of the Beijing Plain. Such measurement firstly provides the annual subsidence rate and spatial evolution characteristics of the subsidence areas and the maximum subsidence rates in Laiguangying–Ciqu, which is the largest subsidence area of the Beijing Plain, were beyond 14 cm/year from 2009 to 2018. We correlate the observed subsidence with land use, Quaternary strata and pre-existing faults to assess the driving mechanisms of land subsidence. We find that large-scale land subsidence or patchy subsidence in the Beijing Plain takes on a similar variation to dry land and rural settlements/manufacturing enterprise land use. We also observe that the subsiding areas are mainly distributed in the edge of Alluvial–Proluval Fan or in the lacustrine or swampy sediments among Alluvial–Proluval Fans with much thicker compressible deposits, and the high subsidence gradients orientate along active faults. Therefore, this research could contribute to propose effective control measures for subsidence and ground fissure and achieve better hazard mitigation programme in Beijing.
1. Introduction
Beijing is primarily located in the large-scale Alluvial–Proluval Fan of Yongding and Chaobai Rivers with high compressible deposits in the middle and edge parts (Cai et al. Citation2009), which is the favourable foundation for subsidence caused by natural compaction or anthropogenic activities. Beijing, the capital of China, has experienced significant population growth in the last decades with a total urban population of 21.54 million in 2019 (Beijing Citation2019) and 13.82 million in 2000, resulting in the over-exploitation of groundwater resources contributing to the water needs of the increasing number of inhabitants. With the continuous over-exploitation groundwater, the consolidation of aquifer systems in thick compressible deposits has led to the occurrence of large-scale, rapid, patchy land subsidence (Heleno et al. Citation2011). Liu et al. (Citation2016), Luo (Citation2017) and Cui and Lei (2018) elaborated that the land subsidence of Beijing begun to appear in 1935 as a continuously over-exploited groundwater and land subsidence experienced four periods: land subsidence formation period, development period, expansion period and rapid development period. At present, the land subsidence in Beijing has been in a transitional period from rapid development to significant slowdown (Guo et al. Citation2017; Luo Citation2017).
The Beijing government has begun to periodically carry out land subsidence monitoring operation to create a land subsidence monitoring system for controlling the dynamic development of land subsidence in real time and fully acquire its distribution characteristics (Liu et al. Citation2014; Tian et al. Citation2014; Luo Citation2017). The system currently includes five aspects: land subsidence monitoring station network, precision levelling survey network, Global Positioning System (GPS) network, groundwater dynamic monitoring network and spaceborne Synthetic Aperture Radar Interferometry (InSAR) monitoring network (Bianchini and Moretti Citation2015; Cianflone et al. Citation2015; Luo Citation2017; Bianchini et al. Citation2019; CitationFigueroa-Miranda et al. 2020). Precision levelling survey, GPS and InSAR monitoring networks only provide ground deformation measurement data in a certain district; however, their results are completely different in terms of monitoring period, accuracy and point density. Precision levelling measurement takes several months; thus, its results vary (Li et al. Citation2019). GPS measurement is cheap and exhibits a high observing point density; nevertheless, its vertical deformation measurement precision is low (Zhang et al. Citation2009).
In comparison with precision levelling and GPS, the InSAR technique, similar to conventional Differential Interferometric Synthetic Aperture Radar (D-InSAR) (Amelung et al. Citation1999), Permanent Scatterer InSAR (PSInSAR) (Ferretti et al. Citation2001) and Small Baseline Subset (SBAS) (Berardino et al. Citation2002), has proven to be an effective remote sensing tool to monitor ground deformation from natural causes or human activities, such as land subsidence (Jiang et al. Citation2011; Cigna et al. Citation2012; Chaussard et al. Citation2013; Qu et al. Citation2014; Li et al. Citation2019) and slope instability (Meisina et al. Citation2006; Metternicht et al. Citation2005), over the past decades. This feature is attributed to the distinctive advantages of this technique, such as all-weather, large-scale, high-precision, low-cost and high point density time-effective. Convectional D-InSAR is a direct ground deformation measurement by quantifying a phase shift of radar waves backscattered by the Earth’s surface between two satellite passes (Erban et al. Citation2014). However, the PSInSAR and SBAS methods developed from D-InSAR (Bell et al. Citation2008; Elias et al. Citation2009) that allow the generation of time series have been proposed. Firstly, a conventional D-InSAR is used, followed by multi-temporal (or time series) D-InSAR techniques. The two methods employ high-coherence points selected on the basis of many SAR images acquired at different times to generate time series and extract ground deformation, greatly removing the temporal–spatial decorrelation and atmosphere error. Accordingly, both methods not only succeed in monitoring large-scope ground deformation but also make regional monitoring accuracy attain millimetre (Canova et al. Citation2012; Erban et al. Citation2014; Hu et al. Citation2014; Li et al. Citation2019). Meanwhile, PSInSAR only analyses stable radar reflectors that consist of single targets unaffected by spatial and temporal decorrelation and needs at least 20 or more SAR images to achieve millimetre (Berardino et al. Citation2002; Canova et al. Citation2012). Small baseline subset method combines the acquisitions included in different interferometric subsets by using a minimum norm criteria based on the singular value decomposition (SVD) method and use distributed targets to retrieve deformation time series. This method can extract ground deformation with equivalent precision levels compared with PSInSAR (Berardino et al. Citation2002; Canova et al. Citation2012).
This study aims to provide land subsidence maps in the Plain by using the InSAR technique wherein the PSInSAR and SBAS methods were combined to retrieve deformation time series (Ge et al. Citation2007; Ge et al. Citation2008; Li et al. 2009) and to analyse the typical causes of land subsidence. The first objective was to estimate the maximum subsidence rates of subsidence bowls and delineate the land subsidence area more entirely than precision levelling and GPS (Raucoules et al. Citation2013). Then, the temporal–spatial evolution of land subsidence in the Plain is studied. The second objective was to optimize or arrange the measurement distribution (Raucoules et al. Citation2013) by improving the precision levelling and GPS networks. The third objective was to evaluate the relations between land subsidence, surface geology, faults, groundwater and rainfall to better understand the parameters that influence the distribution and temporal evolution of land subsidence of the Plain (Chaussard et al. Citation2014).
This paper is organized as follows. We first elaborate the location of the Plain and describe the historical status of land subsidence and its measurement methods (Section 1). After the radar date and InSAR processing methods used are summarized, we carry out InSAR result verification with precision levelling data within the same time period (Section 2), and then we present the land subsidence acquired by using the InSAR technique and temporal–spatial subsidence characteristics of the critical subsidence areas (Section 3). In Section 4, we discuss the cause of land subsidence. Finally, we relate the subsidence to Quaternary landform, Quaternary strata and pre-existing faults, address the roles played by geology and pre-existing faults and introduce the ground fissures induced by land subsidence (Section 5).
2. Beijing plain
2.1. Beijing plain
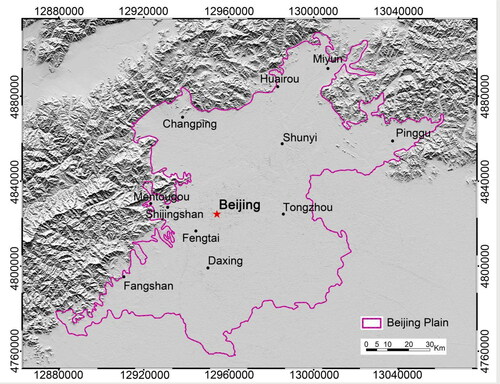
Beijing consists of east plain (named as Beijing Plain) and west mountain. Beijing Plain (hereinafter referred to as the Plain) joins the North China Plain from the northwest. The Plain () is bordered by the cities of Yanjiao of Langfang in Hebei Province on the east, Tianjin on the southeast, Langfang and Baoding on the south and Beijing’s mountains on the west and north (Sharma et al. Citation2016). Beijing, a super metropolis, has had water consumption of ∼3.7 × 10⁹ m3/year since 2007 (Beijing Water Resources Bulletin Citation2007–2019). However, approximately two thirds of water consumption comes from groundwater (Jia et al. Citation2007; Yang Citation2013) owing to no natural lakes and low rainfall (Beijing Citation2019). The long-standing groundwater over-exploitation causes lowering of groundwater table, especially in confined aquifer conditions, resulting in increasing effective stress due to pore water pressure decrease based on the effective stress principle proposed by Terzaghi. The increase of effective stress in the confined aquifer layer could lead to confining layer material compaction, which results in large-scale land subsidence because groundwater no longer supports the overlying layer (Chatterjee et al. Citation2006; Jia et al. Citation2007).
Figure 1. Beijing (China) is comprised of the Beijing Plain in the southeast and mountain in the west and north. The Beijing Plain is clearly delineated with the purple polygon.
2.2. Development of land subsidence
In Beijing, land subsidence firstly occurs in the areas of Xidan to Dongdan in 1935 and has been reported by a number of previous work (Liu et al. Citation2016; Luo Citation2017; Cui and Lei Citation2018). Hereafter, the spatial characteristics of land subsidence could be divided into formation, development, expansion and rapid development in four periods (Liu et al. Citation2016; Luo Citation2017). During the period between 1961 and 1973, the land subsidence preliminarily formed as groundwater began to be exploited on a large scale (Liu et al. Citation2016). The subsidence reached its development stage in 1974, and Dajiaoting and Laiguangying subsidence bowls (Guo et al. Citation2017; Cui and Lei 2018) emerged in the eastern suburbs of Beijing by 1983. Although groundwater exploitation management began to be implemented from the mid-1980s to 1990s, groundwater funnels were still further expanded in Plain; accordingly, land subsidence reached the expansion stage (Yang et al. Citation2013; Tian Citation2017), and five large subsidence centres were initially formed (Yang et al. Citation2013; Tian Citation2017; Cui and Lei 2018). Since 1999, the development of land subsidence manifested as two large subsidence areas located in the south and north of the Plain (referred to as North and South Areas, respectively), where seven land subsidence bowls exist (Liu et al. Citation2016; Guo et al. Citation2017; Luo Citation2017; Cui and Lei 2018). This phenomenon is due to the long-term excessive groundwater extraction with population and enterprises dramatically increased and rapid urban expansion. The North Area includes Tongzhou in the east of the Plain and Changping, Haidian and Shunyi in the north. The Tongzhou subsidence areas connected to a larger area have become the worst subsidence areas of the Plain with a maximum subsidence rate of >100 mm/year for many years (Luo 2017; Tian Citation2017). The South Area that has been connected together with Langfang subsidence area is mainly distributed in Daxing; however, its subsidence bowl has been concentrated in Lixian and its surrounding areas (Luo et al. Citation2011; Guo et al. Citation2017; Luo Citation2017).
3. Data and processing
3.1. Data acquisition
To provide detailed coverage of the spatial and temporal variations of land subsidence in the Plain, we use over 500 SAR images acquired by the European Space Agency (ESA) ENVISAT satellite and MacDonald Dettwiler and Associates Ltd (MDA) RADARSAT-2 satellite (Chaussard et al. Citation2013; Li et al. Citation2019) to estimate the annual land subsidence of the Plain during the period from 2007 to 2019. Over 150 radar images acquired by the ASAR sensor on board the ENVISAT satellite () that operates in C-band (wavelength 5.6 cm; frequency 5.3 GHz) and has a revisiting cycle of 35 days (ASAR Product Handbook of Envisat 2007; Cigna et al. Citation2012) were acquired for the Plain from 2007 to 2010 and more than 40 images along three descending orbits every year. In the 4-year period, an average of 10 acquisitions per location was employed. These scenes were acquired in Image Mode S2, with VV polarization and a swath of 100 km (ASAR Product Handbook of Envisat 2007; Cigna et al. Citation2012). Subsequently, RADARSAT-2 ASAR data () were chosen in 2011 based on the same application purpose as ENVISAT satellite. However, RADARSAT-2 Wide images were collected during the period between 2011 and 2016. Meanwhile, the RADARSAT-2 Extra-Fine mode data were selected from 2017 to 2019. In terms of the Extra-Fine mode data, the pixel spacing is 2.66 m in the range direction and 3.03 m in azimuth direction compared with 11.8 m by 5.1 m in the Wide mode (Chen et al. Citation2012; Radarsat-2 Satellite Characteristics Citation2015). RADARSAT-2 satellite has a much wider swath (150 km in the Wide mode and 125 km in the Extra-Fine mode) and a recurrent cycle of 24 days (Radarsat-2 Satellite Characteristics Citation2015). In our 9-year period, we used two orbit data (also along descending orbits) and 366 RADARSAT-2 SAR images; thus, we utilize an average of 14 acquisitions per location. More parameters can be found in the ASAR Product Handbook of Envisat (Citation2007) and Radarsat-2 Satellite Characteristics (Citation2015). Forty-four TerraSAR-X strip images () acquired with an ascending orbit from December 2010 to September 2015 were collected to provide high-resolution monitoring of local subsidence. In the strip mode SAR data, the pixel spacing is 0.91 m in range direction and 1.89 m in the azimuth direction.
Table 1. Envisat, Radarsat-2 and TerraSAR-X data of Beijing Plain acquired during 2007–2019 and their parameters.
The orbital errors for all SAR scenes are described by Scharroo and Visser (Citation1998) and Cigna et al. (Citation2012). Precise orbits from the Delft Institute for Earth-Oriented Space Research (DEOS) for ENVISAT data and MDA for RADARSAT-2 data were employed to calculate the interferometric baselines. Meanwhile, the 3 arc second (~90 m) Shuttle Radar Topography Mission (SRTM) DEM data from the United States Geological Survey was used for topographic phase estimation to recover the deformation phase and for geocoding the deformation data acquired by InSAR method (transforming Rang–Doppler coordinates into the Universal Transverse Mercator [UTM] Grid System) (Jiang et al. Citation2011; Chen et al. Citation2012, Citation2013).
3.2. InSAR processing
In this study, we enable large-scale land subsidence mapping in the Plain via combining PSInSAR and SBAS methods (Ge et al. Citation2007; Ge et al. Citation2008; Li et al. 2009). Firstly, we set the short temporal and spatial baselines (by setting 300 m for the maximum perpendicular baseline and 450 days for the maximum temporal one) to generate interferograms and differential interferograms based on Gamma software of Switzerland Gamma Remote Sensing owing to ten SAR images of each scene in every year. This task was conducted to maximize the utilization of SAR data, suppress the noise phase as far as possible and ensure the accuracy of deformation monitoring. Suppose that images are present at the same scene, whose acquisition time can be labelled with
and each image at least can interfere with another image. Then, the amount M of generated interferograms could satisfy the inequality Equation(1)
(1)
(1) (assuming N is odd) (Berardino et al. Citation2002):
(1)
(1)
We perform InSAR by setting 300 m for the maximum perpendicular baseline and 450 days for the maximum temporal one to generate over 1000 pairs interferograms (Chaussard et al. Citation2013; Li et al. Citation2019). Then, we acquire more than a thousand pairs of differential interferograms by removing the topographic and flat-earth phases, which could be described as conventional D-InSAR. The most significant limitations of D-InSAR are the delays in the phase propagation in these differential interferograms due to atmospheric conditions and inaccuracy of the Digital Elevation Mode (DEM). Meanwhile, a low correlation exists in the suburbs or large-scale farmland. Accordingly, a high accuracy of InSAR measurement is difficult to achieve.
To address the limitations of D-InSAR, we can carry out linear time-series analysis based on high Coherence Targets (CTs). These high CTs mainly correspond to stable natural or manmade reflectors (Ferretti et al. Citation2000, Citation2001) or distributed phase-stable targets (Hooper et al. Citation2004; Heleno et al. Citation2011). During CTs selection, three evaluating indicators, namely, intensity, spectral correlation and mean-to-sigma ratio, are evaluated to extract the filtering phase based on those differential interferograms. Finally, the phase difference between adjacent CTs (x, y) is expressed as follows under the assumption that ground surface deformation follows a uniform velocity:
(2)
(2)
where
are on behalf of unwrapped difference phase, atmosphere phase and noise phase between x and y, respectively;
are wavelength, angle of incidence, space baseline, time baseline and the distance from satellite platform to ground, respectively;
are linear deformation velocity and elevation correction between x and y, respectively. Based on Formula (2), the linear velocity of surface deformation and elevation correction are obtained by evolving toward 2D regression analysis of joint exploitation of large groups of CT-differential interferograms and further removal of the atmospheric phase contribution. In each CT, the (mean) annual line of sight (LOS) velocity can be computed (Heleno et al. Citation2011) (relative to a reference point coincident with no deformation location) and converted into vertical velocity. Moreover, the annual vertical velocity map is transformed into a UTM WGS 84 coordinate system based on the coordinate transformation table established between the external DEM and SAR coordinate system.
After the annual vertical velocity map of each frame is obtained, CTs in the overlapping area between two adjacent strips cannot be the same due to the different incident angles of satellite imaging. We select the master frame, interpolate the vertical values of the CTs in the slave orbit into a plane in the spatial domain through inverse distance weighted interpolation method and use these CT positions in the overlapping area of the master orbit to extract the vertical deformation values of the slave orbit. Finally, the whole deviation of the slave orbit relative to the master orbit can be acquired as follows (Ge et al. Citation2008, Citation2017):
(3)
(3)
where
are the values in the overlapping area between the master and the slave orbits;
is the statistical deformation deviation of the master and slave orbits;
is the vertical deformation of CT i of the master orbit;
is the vertical deformation of CT i of the slave orbit; N is the number of CTs;
is the vertical deformation vector of all CTs of the slave orbit calculated by InSAR time-series analysis; and
is the corrected vertical deformation vector of all CTs of the slave orbit (Ge et al. Citation2008, Citation2017). In those CTs in the overlapping area between the master and the slave orbits, the vertical deformation in the slave orbit needs to be further corrected by distance weighted method, which can be expressed as follows:
(4)
(4)
where
and
are the vertical deformations of CT i in the master and corrected slave orbits in the overlapping area; D is the length of the overlapping area; and
and
are the distances between CT i and their azimuth edges in the master and corrected slave orbits.
In Formulas Equation(3)(3)
(3) and Equation(4)
(4)
(4) , the vertical deformation of these slave frames can be regulated, and we could accomplish large-scale land subsidence mapping in the simultaneous time period (Ge et al. Citation2008, Citation2017; Li et al. Citation2019).
3.3. InSAR result verification
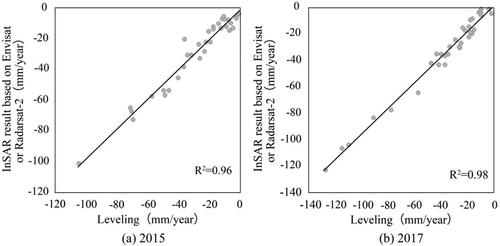
The 40 levelling marks were surveyed on account of the first-class levelling method in 2015 and 2017 to validate the InSAR-retrieved subsidence. Thirty levelling marks are extracted in severe subsidence and 10 levelling-marks in other subsidence. Based on the nearest neighbour method in high-density CTs but interpolation InSAR results in the sparse CT area, a CT point is extracted with an annual InSAR velocity of subsidence compared with the levelling data. Forty comparison results between these data in 2015 and 2017 are illustrated in , which showed consistent motion trends with absolute difference =0.3–7.5 and 0–9.1 mm/year and total mean square error m0=4.6 and 4.8 mm/year. A time difference can be observed between levelling and InSAR monitoring, and no or few CTs can be found around some levelling marks, which may bring about greater absolute difference between InSAR and levelling monitoring results.
Figure 2. The annual rates of subsidence between 2015 and 2017 are compared with the levelling data. A good agreement is represented by the linear polynomial fits with linear correlation coefficients of R2=0.96 in (a) and R2=0.98 in (b).
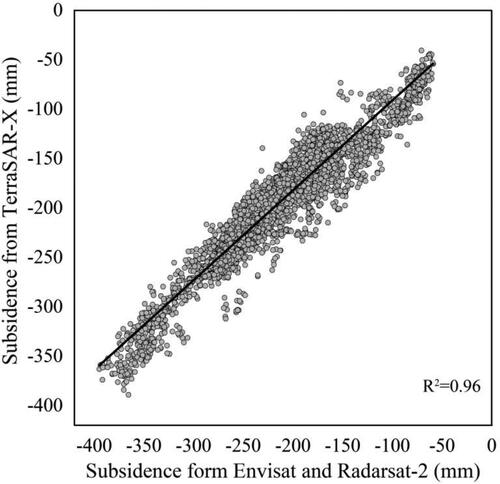
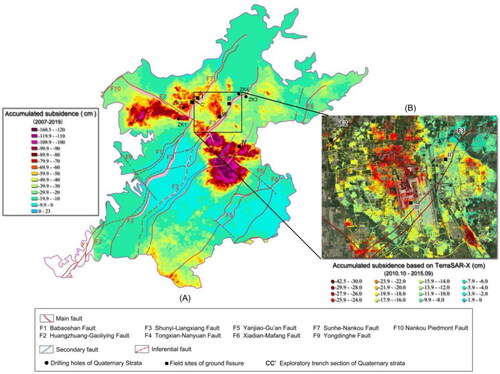
In this study, we also introduce 1 m resolution TerraSAR-X radar data to precisely describe the spatial distribution characteristics between land subsidence and active faults near the Beijing Capital Airport. Envisat, Radarsat-2 and TerraSAR-X SAR data should provide the same measurements because measurements by means of InSAR are estimated along LOS of satellite, and velocity values should be nearly vertical near Beijing Capital Airport. However, in the light of medium-resolution (Envisat IW and Radarsat-2 Wide modes) and high-resolution (Radarsat-2 Extra-Fine and TerraSAR-X Strip modes) SAR data having different resolution, wavelength, signal-to-noise ratio and atmosphere influence, the measurements by means of InSAR provided by medium-resolution and high-resolution SAR data have a few errors based on the same time interval acquired SAR data and the same processing method. Moreover, in our work the acquisition period of SAR data is not completely identical (TerraSAR-X corresponding to the monitoring period between November 2010 and September 2015 but Radarsat-2 from August 2010 to October 2015). In addition, TerraSAR-X data are directly processed by adopting coherent target time series analytical method but Radarsat-2 InSAR measurement is conducted by adding annual time series analytical results together. Therefore, a great difference may exist between both InSAR measurements based on TerraSAR-X and Radarsat-2; however, they are still provided with a high correlation, as elaborated in .
Figure 3. The accumulated subsidence from TerraSAR-X is compared with that from Radarsat-2. the aforementioned subsidence from TerraSAR-X corresponds to the monitoring period between November 2010 and September 2015. However, the accumulated subsidence from Radarsat-2 corresponds to the monitoring period from August 2010 to October 2015. The results are in good agreement with the linear correlation coefficient R2=0.96.
4. Results: InSAR time-series reveal subsidence in the plain
The map of the cumulative displacement during the period between 2007 and 2019 identifies the subsidence areas (). In the Plain, we detect three large-scale land subsidence areas (Chaussard et al. Citation2013, Citation2014): Laiguangying–Ciqu (east Beijing) as the largest subsidence area, Yangfang–Pingxifu (northwest Beijing) and subsidence area in southeast Beijing, and several patchy subsidence areas (Chaussard et al. Citation2013, Citation2014) (northwest the Plain: Xiaotangshan, Houshayu, Pingxifu, and Yangzhen), which are present mainly in the suburbs area around Beijing.
Figure 4. The land cumulative deformation map in the Beijing Plain was acquired by summing 13 mean annual deformation velocities during the period from 2007 to 2019. The map is color-coded from dark blue (represents the short distance between the land and the satellite or land uplift) to dark rose red (denotes the increasing distance between the land and the satellite or land maximum subsidence). This map clearly describes the five subsidence areas, labelled with A, B, C, D and E.

4.1. Spatial pattern of land subsidence
Laiguangying–Ciqu and Yangfang–Pingxifu are large-scale subsidence areas, and they correspond to subsidence with homogeneous deformation characterized by green to dark purple colour in . We observe in Laiguangying–Ciqu that the area with subsidence displacement > 70 cm (light red to dark purple colour) is approximately 390 km2, and X-shaped narrow zones can be found in the middle of Laiguangying–Ciqu, indicating sharp transitions between subsidence and stable areas. In the Yangfang–Pingxifu, the rates and area of subsidence are relatively smaller than Laiguangying–Ciqu, and the area with subsidence displacement >70 cm (light red to dark purple colour) is only 93.3 km2. We also find a sharp transition in the north of Yangfang–Pingxigu subsidence. Panggezhuang–Yufa–Lixian also belongs to large-scale subsidence; however, it has the smallest displacements of subsidence (between 20 and 80 cm; pistachio green to red colour). In or near Xiaotangshan, Houshayu, Yangzhen, north of Shunyi and north of Pingxifu, we find several areas with a patchy subsidence and their maximum subsidence displacements are >70 cm, characterized by orange to purple or dark colour. According to statistics, the five patchy subsidence areas of subsidence displacement >80 cm are, respectively, 1.3, 9.0, 0.4, 0.2 and 5.9 km2 ().
4.2. Temporal evolution of land subsidence
The time series suggest a different rate of subsidence in all the locations over the 13-year period spanned by the SAR acquisitions. represent the outline or boundary of subsidence areas mainly lying in the east and north parts of the Plain (Laiguangying–Ciqu, Yangfang–Pingxifu, Houshayu and Xiaotangshan–Pingxifu) and their temporal evolution of the maximum subsidence rates, which elaborates that the subsidence bowls changed spatially in the studied period and land subsidence progression was so diversity in increasing year intervals.
Figure 5. The annual maps of subsidence with rate >5 cm/year show the land subsidence evolution characteristics in Laiguangying–Ciqu (labelled with D in ) during the period between 2007 and 2019. These results are only colour-coded for subsidence rate >5 cm/year to preferably present variation of subsidence bowl (from green [representing subsidence rate between 5 cm/year and 5.9 cm/year] to dark red [denoting subsidence rate between 14 cm/year and 18.8 cm/year]).
![Figure 5. The annual maps of subsidence with rate >5 cm/year show the land subsidence evolution characteristics in Laiguangying–Ciqu (labelled with D in Figure 4) during the period between 2007 and 2019. These results are only colour-coded for subsidence rate >5 cm/year to preferably present variation of subsidence bowl (from green [representing subsidence rate between 5 cm/year and 5.9 cm/year] to dark red [denoting subsidence rate between 14 cm/year and 18.8 cm/year]).](/cms/asset/34e2cde3-7262-4250-b3c5-d2395cec2c83/tgnh_a_1974105_f0005_c.jpg)
Figure 6. (a) Mean annual maximum subsidence rate in Laiguangying–Ciqu (labelled with D in ) during the period from 2007 to 2019; (b) annual subsidence areas (areas with subsidence rate >9 cm/year and between 5 cm/year and 9 cm/year are counted) acquired in the Laiguangying–Ciqu subsidence area by interpolation of those mean annual deformation rates.
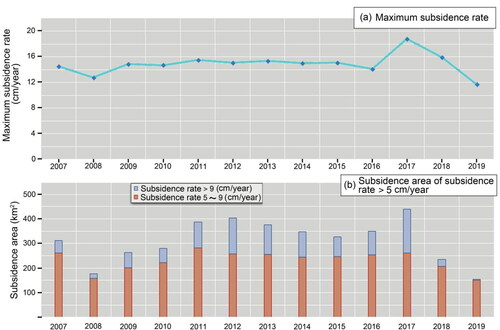
Figure 7. Annual maps of subsidence showing the land subsidence evolution characteristics of the three subsiding areas in northwest of Beijing (labelled with A, B and C in ) during the period between 2007 and 2019. The InSAR acquisition results are all colour-coded from blue (representing positive velocities [land uplift]) to dark red (denoting negative velocities between 14 cm/year and 18.8 cm/year). The northwest subsiding area could be divided into A, B and C subzones, and the three charts below correspond to the annual maximum rates of subsidence in the A, B and C subzones.
![Figure 7. Annual maps of subsidence showing the land subsidence evolution characteristics of the three subsiding areas in northwest of Beijing (labelled with A, B and C in Figure 4) during the period between 2007 and 2019. The InSAR acquisition results are all colour-coded from blue (representing positive velocities [land uplift]) to dark red (denoting negative velocities between 14 cm/year and 18.8 cm/year). The northwest subsiding area could be divided into A, B and C subzones, and the three charts below correspond to the annual maximum rates of subsidence in the A, B and C subzones.](/cms/asset/a9d5e178-d007-4aed-ba98-154dc7ab0c23/tgnh_a_1974105_f0007_c.jpg)
4.2.1. Tongzhou subsidence (Laiguangying–Ciqu subsidence)
Laiguangying–Ciqu subsidence, located in or around Tongzhou of Beijing (), showed an apparent increase in the maximum rate of subsidence between 2008 and 2012 (). The maximum rates of subsidence observed are 12.8, 14.9, 14.7, 15.5 and 15.1 cm/year (). The areas of subsidence rate >9 cm/year (orange to dark red colour) and between 5 cm/year and 9 cm/year (pistachio green to yellow colour) are 19, 61, 58, 104 and 146 km2 and 158, 202, 222, 282 and 258 km2, respectively (). However, the maximum rates of subsidence and areas of subsidence rate >5 cm/year in or around Tongzhou generally appear to be a slight decrease from 2013 to 2019, except 2017. The subsiding areas (subsidence rate >5 cm/year, characterized by pistachio green to dark red colour) cover 375, 346, 327, 349, 439, 234 and 155 km2 (), and the maximum rates of subsidence are up to 15.4, 15.0, 15.1, 14.1, 18.8, 15.9 and 11.7 cm/year ().
Laiguangying–Ciqu subsidence could be divided into two subsidence subzones: Laiguangying–Tongzhou and Tongzhou–Ciqu in views of the X-shaped narrow zones. Before 2009, the area of Laiguangying–Tongzhou was basically equal to that observed in the Tongzhou–Ciqu subsidence subzone. After 2009, the subsequent subsiding areas and rate of subsidence in the Tongzhou–Ciqu subzone began to accelerate. In 2013, the subsiding area reached the maximum value. Hereafter, the subsidence area in the Tongzhou–Ciqu subzone decreased, and that with subsidence rate >10 cm/year disappeared in 2019 ( and ).
4.2.2. The northwest subsidence of Beijing
shows the boundary and variation of maximum subsidence rate in the northwest of Beijing. The subsidence in the northwest of Beijing is much smaller than that in the east (Laiguangying–Ciqu). The northwest subsiding could be divided into three subzones: A, B and C, based on the NW- and NE-striking narrow stable zones (blue colour in ). A subzone (Yangfang–Pingxifu) is also a large-scale and homogeneous subsidence, and its rates of subsidence were >8 cm/year, except for 2008 and 2019. In 2011, 2014 and 2017, the maximum subsidence rates were 12.5, 12.6 and 14.5 cm/year, and the areas with subsidence rate >8 cm/year cover 24.5, 16.3 and 9.2 km2 (). In 2007, 2009, 2015 and 2016, no obvious subsidence bowl can be observed, and the maximum subsidence rates were below 12 cm/year. However, the areas with subsidence rate >8 cm/year reached up to 13.1, 12.2, 14.4 and 36.2 km2 (). The subsidence begun to take place in the B subzone (near Xiaotangshan and Pingxifu) in 2009. During the period from 2011 to 2018, we find several areas of subsidence (between 5 cm/year and 11 cm/year, characterized by pistachio green to orange colour) with a patchy distribution. Near Houshayu (C subzone), the subsidence took place in 2007. In 2009, 2011, 2013, 2014 and 2017, relatively larger areas with subsidence rates >6 cm/year were observed: 9.2, 9.7, 9.4, 9.3 and 8.9 km2. However, in 2008, 2010, 2015, 2016, 2018 and 2019, the subsiding areas occurred on several small patchy zones or disappeared.
5. Cause of land subsidence
Land subsidence can be caused by natural and anthropogenic aspects, including fluid withdrawal (groundwater, oil, gas or geothermy extraction), solid withdrawal (mining or tunnel construction) and buildings or structural loading (construction of high-rise buildings) (Meckel et al. 2006; Chaussard et al. Citation2013). Nevertheless, subsidence in the Plain is ultimately determined by the change of groundwater table. Over-exploitation groundwater due to agricultural irrigation, enterprise production, underground excavation and domestic water for residents in urban villages (Jia et al. Citation2007; Guo et al. Citation2017; Luo 2017; Tian et al. Citation2017), brings groundwater table to slow down immediately and results in land subsidence occurrence, and other surface water supply, rainfall and government policy yet affect groundwater table variety by reducing groundwater exploitation or recharge groundwater.
5.1. Over-exploitation groundwater with land use
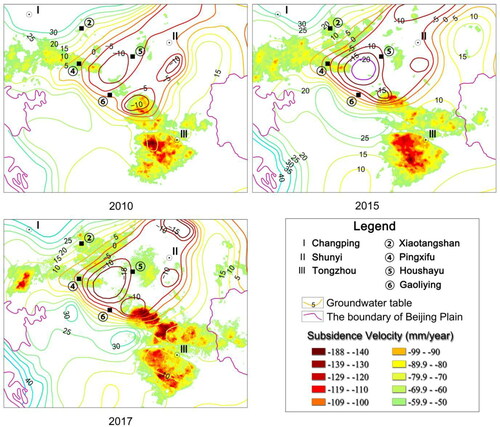
Rapid, patchy subsidence (>5 cm/year, pistachio green to dark red colour) areas in 2010, 2015 and 2017 imaged through InSAR analysis are compared and integrated with groundwater exploitation data issued by the Beijing Water Authority. We find no clear correlation between subsidence areas (Laiguangying–Ciqu and Yangfang–Pingxifu) and groundwater exploitation published () because of the groundwater data in acquired from wells of depth less than 100 m. Moreover, a large number of unregistered wells are not considered based on field survey and expert consultation. However, the subsidence of the B and C subzones in basically located in the down bowl of groundwater table in 2010, 2015 and 2017, and the greater the decline of groundwater table, the more serious the land subsidence in the B and C subzones. Hence, we could think that the B and C subsidence correlate with the groundwater depression zone formed by groundwater exploitation ().
Figure 8. The contrast charts between land subsidence and groundwater depression cone of the Beijing Plain in 2010, 2015 and 2017 demonstrate that the groundwater depression cone locates in the area between Changping and Shunyi. In the Tongzhou (Laiguangying–Ciqu) and Yangfang–Pingxifu subsidence, the groundwater table is basically between 5 and 15 m (Beijing Water Resources Bulletin, 2010, 2015, 2017).
Ground water exploitation in the Plain is categorized in two types: shallow-water exploitation and deep-confined water exploitation. This exploited groundwater is used to sustain the various industrial structures and residents’ lives. Accordingly, we utilize the different types of land use to reflect the volume of groundwater exploitation; meanwhile, it should be noted that the groundwater exploitation depth or groundwater types for the same land use varies in different areas. We classify land use of the Plain into woodland, other woodland, paddy field, reservoir pond, river/canals, urban land, construction land, rural settlements/manufacturing enterprises, dry land and beach land. Based on the water resource supply types (tap water uniformly provided by the government, shallow-water exploitation, deep-confined water exploitation and water body), we successively reclassify land use into four categories: urban land (light pink colour); woodland and construction land (pink colour); dry land and rural settlements/manufacturing enterprises (pale blue colour); and rivers/canals, reservoir pond/paddy field (dark blue colour) in Tongzhou and south of Changping due to the thicker clay layers in the middle and edge part of alluvial proluvial plain with multi-layer deep-confined water (Jia et al. Citation2007). In Shunyi or Huairou District, we sort dry land, woodland and construction land out as categories for water supply from shallow-water exploitation because of abundant potential or shallow-confined aquifers in the top of Alluvial–Proluval Fan of Yongding and Chaobai Rivers (Jia et al. Citation2007; Tian et al. Citation2017).
5.1.1. Tongzhou and South of Changping: subsidence mainly due to deep-confined groundwater exploitation
Rapid, large-scale subsidence in or around Tongzhou (Laiguangying–Ciqu) and south of Changping (Yangfang–Pingxifu) correlates with dry land, wood, construction and rural settlements/manufacturing enterprise land use. suggests that woodland and construction land that mainly deplete shallow-water decreased from 2.81% in 2010 to 1.34% in 2017. However, dry land and rural settlements/manufacturing enterprises from deep-confined water exploitation increased in 2010, 2015 and 2017 in Laiguangying–Ciqu subsidence (50.83%, 57.21% and 52.35%, respectively). Meanwhile the land use variations in South of Cahngping, corresponding to the A subzone in , also show a similar change to Laiguangying–Ciqu subsidence (woodland and construction land use from 3.48% in 2010 to 2.61% in 2017; dry land and rural settlements/manufacturing enterprise land use from 50.93% in 2010 to 56.74% in 2017).
Figure 9. Types of land use and their percentage variation of Laiguangying–Ciqu subsidence in 2010, 2015 and 2017. In the last decade, urban land use extends eastward, and many dry lands converts to urban villages for inhabitant' living.
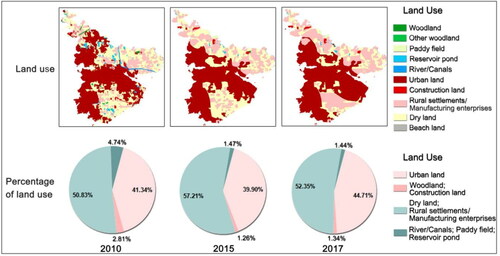
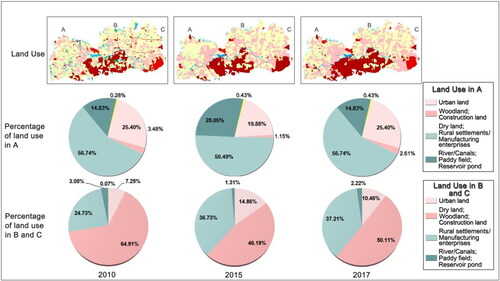
Figure 10. Similar to for northwest subsidence of the Beijing Plain. The yellow colour in A, B and C subzone represents the beach land. We are not sure whether the beach land use needs to exploit groundwater or exploit shallow or deep-confined groundwater.
In Tongzhou and south of Changping, we note a similar variation of subsidence. In Laiguangying–Ciqu, the subsidence areas of >5 cm/year are 280.1, 326.8 and 438.8 km2 () in 2010, 2015 and 2017, respectively; the maximum rates of subsidence in Yangfang–Pingxifu are 11.1, 11.4 and 14.5 cm/year in 2010, 2015 and 2017, respectively (). Therefore, the deep-confined groundwater exploitation for dry land and rural settlements/manufacturing enterprises is likely the main cause of Tongzhou and south of Changping subsidence. Since 2018, the maximum rates of subsidence (15.9 and 11.7 cm/year in Laiguangying–Ciqu () and 8.9 and 12 cm/year in Yangfang–Pingxifu (), in 2018 and 2019, respectively) and the areas of subsidence with >5 cm/year (233.9 and 154.9 km2 in Laiguangying–Ciqu in 2018 and 2019, respectively) () slowed down distinctly. These results corresponded to hundreds of manufacturing enterprise withdrawal and floating population sharply reducing in Beijing according to local media reports, which further confirms the correctness of our above deductions.
5.1.2. West of Shunyi and East of Changping: subsidence due to shallow- and deep-confined groundwater
We observe that patchy subsidence with an average rate of 7–11 cm/year occurred near Xiaotangshan, Gaoliying, Pingxifu and Houshayu located at the west of Shunyi and east of Changping. In these locations, shallow-groundwater exploitation for dry land, woodland and construction land use (B and C subzones in ) accounts for approximately 50% or much more in all types of land use. A large-scale groundwater depression cone was observed between Changping and Shunyi (), which is a spatial-scale consistent with the subsidence area near Pingxifu and Houshayu. Therefore, the subsidence areas in the west of Shunyi and east of Changping probably result from shallow-water exploitation. Meanwhile, the shallow groundwater table near Pingxifu and Houshayu rebounded; however, the subsidence showed no sign of slowing down in 2017 because it also correlates with deep-confined groundwater exploitation. Rural settlements/manufacturing enterprises that are mainly supported from deep-confined groundwater exploitation account for 30% or less in total land use, and their variation trend (24.73%, 36.73% and 37.21% of B and C subzones in 2010, 2015 and 2017, respectively) () was consistent with those of the maximum subsidence rates (6.9, 10.5 and 11.9 cm/year in the B subzone and 7.3, 8.1 and 9.6 cm/year in the C subzone in 2010, 2015 and 2017, respectively) (). The above analysis suggests that the combined effect of shallow and deep-confined groundwater extraction causes land subsidence in these two zones, and deep-confined groundwater could easily lead to the formation of patchy subsidence areas.
5.2. Subsidence due to other processes
The observed subsidence in Beijing has also been affected by other processes, such as water supply from South-to-North Water Diversion Middle Route, rainfall and government policy. As the water supply from South-to-North Water Diversion Middle Route has been increasing every year since 2014, the amount extracted of groundwater has annually decreased and its proportion accounting for the total water supply slowed down from > 60% before 2010 to 36.9% in 2019 (Beijing Water Resources Bulletin, Citation2007–2019). On the one hand, as the water from the South-to-North Water Diversion Middle Route reached Beijing, 70% of the Yangtze River water has been used for residents and enterprises in urban areas. But the improvement of the water supply structure was not evident in suburban villages or enterprises. On the other hand, 12% of the Yangtze River water has been deposited underground of Miyun, Huairou and Shunyi District, and 12% has been used to replace Miyun Reservoir and flowed into rivers or lakes in central Beijing, which has alleviated the land subsidence in the north part of the Plain. The annual maximum rates of subsidence and area (rates of subsidence >5 cm/year) have been decreasing every year since 2014 in the Houshayu subsiding area.
Rainfall is primarily used to recharge shallow groundwater, and its influence on land subsidence is concentrated in subsiding areas caused by over-exploitation shallow groundwater, such as Gaoliying and Houshayu subsidence (denoted as B and C in and 7), because thick sand-gravel with high permeability is present near Gaoliying and Houshayu. However, rainfall is unlikely responsible for the Laiguangying–Ciqu and Yangfang–Pingxifu subsidence because of their close correlation with deep-confined groundwater exploitation.
In 2018 and 2019, the floating population greatly reduced due to the special tasks carried out by Beijing government for relieving the non-capital function of the city. Production enterprises moved out in batches in the east and north suburbs of Beijing, which indirectly bring about the great reduction of deep-confined exploitation volume. The land subsidence (subsidence rates and scope) also showed a significant reduction in Tongzhou and the south part of Changping in 2018 and 2019 by virtue of the correlation between subsidence rates/scope and groundwater exploitation volume, as illustrated in and .
6. Discussion
We discuss the manner by which the structural features (distribution of Quaternary landform, Quaternary strata and pre-existing faults) may influence the spatial and temporal distributions of land subsidence. Moreover, we study the ground fissures caused by high subsidence gradients of land subsidence, especially along active faults.
6.1. Quaternary landform and strata
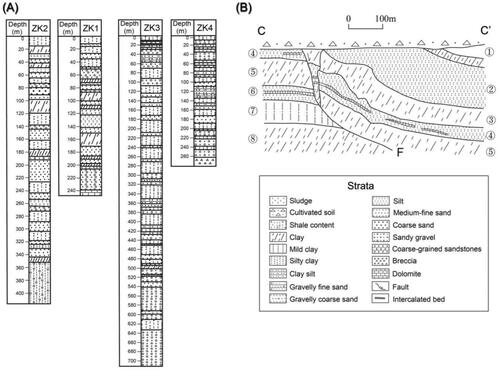
The Quaternary geologic characteristics in the Plain are mainly the large-scale Alluvial–Proluval Fan of Yongding and Chaobai Rivers and some small sedimentary depressions (Cai et al. Citation2009). The Alluvial–Proluval Fan of Yongding and Chaobai Rivers criss-cross and overlap each other (), between which the lake-swamp and river-bed peat deposits are abundant. The Quaternary sediments overlie thick bedrock (Proterozoic, Jurassic or Tertiary) and mainly comprise sandy gravel, medium sand, sandy clay and clay. We observe that the total thickness of the clay strata (or compressible layers) greatly varies in the Plain, and the compressible deposits in the south of Changping, northwest of Tongzhou and southeast of Daxing exhibit maximum thickness (Cai et al. Citation2009) ().
Figure 11. (A) The distribution diagram of two large-scale Alluvial–Proluvial Fan and some small sedimentary depressions in the Late Pleistocene of Quaternary (Cai et al. Citation2009); (B) is the total thickness map of Quaternary compressible layers. (C) and (D) are schematic representations to show geological strata and land deformation along Line AA' and BB', which are both marked by the black lines in (A) and (B) and the two profiles further reveal that land subsidence bowls generally arise in thick multi-layer compressible clay (Cai et al. Citation2009; Lei et al. Citation2016).
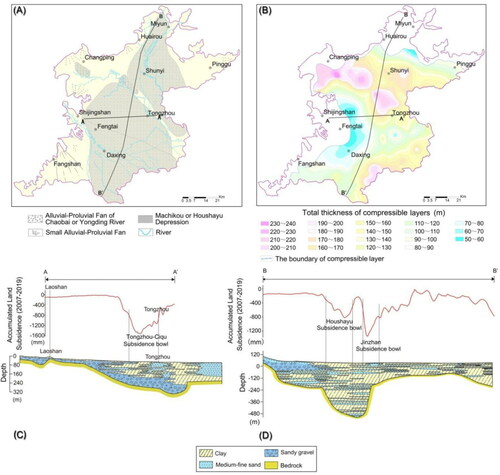
Most locations that experience rapid subsidence are generally located on such areas that have thick clay strata (or compressible deposits) (). In the Alluvial–Proluval Fan, the Quaternary sediments successively vary from sandy gravel, medium sand, fine sand to clay from its top to edge. Much thicker clay layers (or compressible layers) than those in the top and middle portion of the Alluvial–Proluval Fan can be observed at the edge. Laiguangying–Ciqu and Houshayu subsidence bowls lie in the edge of the Alluvial–Proluval Fan of Yongding and Chaobai Rivers due to a or multiple clay layers (or compressible layers) to the edge (Cai et al. Citation2009; Lei et al. Citation2016), as shown in and D. In addition, lacustrine or swampy sediments exist among or at the edge of the Alluvial–Proluval Fans, such as Machikou, Houshayu and Pinggu depression with Quaternary sediment thicknesses of up to 579, 1000 and 400 m, respectively, in these depression centres (Cai et al. Citation2009) (), which are also responsible for the land subsidence. and 7 demonstrate that the Yangfang–Pingxifu and Xiaotangshan–Gaoliying subsidence bowls in the northwest of the Plain occur in the lacustrine or swamp deposits between the Alluvial–Proluval Fans.
6.2. Pre-existing faults
The identification of high gradient subsidence displacements or velocities is one of the significant observations from and . These locations, corresponding to the transition between subsidence and stable areas, occur in the narrow zones. Zhao (Citation2009) reported that well-developed, pre-existing faults with North–East and North–West strikes exist in the Plain, and they are mostly covered by loose Quaternary sediments. We superpose pre-existing over subsidence displacement map () and observe that the pre-existing active faults in the seven locations are coincident with high subsidence gradients. The Yangfang–Pingxifu, Xiaotangshan–Pingxifu, Houshayu and Laiguangying subsidence areas are completely enveloped by the Sunhe–Nankou, Huangzhuang–Gaoliying and Shunyi–Liangxiang Faults in the northern part of the Plain. Laiguangying–Ciqu, the largest land subsidence area in the eastern part of the Plain, is partially enveloped by Tongxian–Nanyuan or inferential fault (). The 2010–2015 accumulative subsidence map based on 3 m-resolution TerraSAR-X images illustrates the precisely spatial characteristics of Beijing Capital Airport and its spatial relationship with Shunyi–Liangxiang Fault, as shown in (Hu et al. Citation2019). However, the high subsidence gradient in the south of Beijing Capital Airport subsidence and Shunyi–Liangxiang Fault lacks an absolute congruence of these two trajectories. Further study of the subsiding areas bordered by active faults about stratigraphic structure and composition based on geophysical, geochemical and remote sensing technology must be conducted.
Figure 12. (A) The spatial distribution map between the land subsidence and the pre-existing faults in the Beijing Plain shows subsidence limited by Huangzhuang–Gaoliying, Shunyi–Liangxiang and Sunhe–Nankou Faults, which are active normal-faults. The Huangzhuang–Gaoliying and Shunyi–Liangxiang Faults incline to the South–East, orientating along the North–East direction (Zhao Citation2009; Bai et al. Citation2014; Zhang et al. Citation2016). The striking of Sunhe–Nankou Fault is the North-West and can be divided into two sections, namely, North-West and South-East. The northeast side descends, and the southwest side rises in the South-East section of the Sunhe–Nankou Fault; however, the condition is just on the contrary in the North-West section (Bai et al. Citation2018). (B) The accumulated subsidence map of Beijing Capital Airport during the period between December 2010 and September 2015 more clearly indicates the spatial distribution of the subsiding areas and the spatial relationship with pre-existing faults based on the 3 m resolution TerraSAR-X images.
The spatial development characteristics of the subsiding areas are ultimately restricted by geological structures because the lateral abrupt changes of quaternary sediment facies due to the pre-existing active faults bring about abrupt changes in the subsidence displacement associated with their consolidation. We observe that the material composition in the fault zone of Huangzhuang–Gaoliying Fault serve as a partition between the hanging wall and the footwall () (Zhang et al. Citation2016). also shows that the lateral adjacent Quaternary units at both sides of these faults can have different properties (compressibility and permeability), thickness and water table changes in the two sides of Huangzhuang–Gaoliying and Nankou–Sunhe because being normal faults, they have been highly active since Quaternary (Bai et al. Citation2014; Chaussard et al. Citation2014; Zhang et al. Citation2016; Bai et al. Citation2018). further demonstrates that the hanging walls where ZK2 and ZK3 locate belong to Nankou–Sunhe and Shunyi–Liangxiang Faults; they have been deposited owing to the continuous descent, and thicker Quaternary sediments in the hanging walls are possible, which is in agreement with a greater subsidence potential (Pacheco et al. Citation2006; Cigna et al. Citation2011; Chaussard et al. Citation2014). By contrast, the footwalls have been provided with thinner sediments due to long-term denudation, such as ZK1 and ZK4; moreover, they have relatively older sediments with lower permeability than those in the hanging wall at the same depth through the Huangzhuang–Gaoliying section (CC′ in and 13B) (Bai et al., Citation2014, Citation2018); thus, these sediments in the footwalls are in agreement with a smaller compressibility and permeability.
Figure 13. (A) Quaternary stratum histogram. ZK1, ZK2, ZK3 and ZK4 are at both sides of the Sunhe–Nankou and Shunyi–Liangxiang Faults in (Bai et al. Citation2014, Citation2018). The quaternary sediments in ZK2 and ZK3 are much thicker than those in ZK1 and ZK4. (B) Exploratory trench section map along profile CC′ perpendicular to Huangzhuang–Gaoliying Fault in (Zhang et al. Citation2016).
6.3. Ground fissure
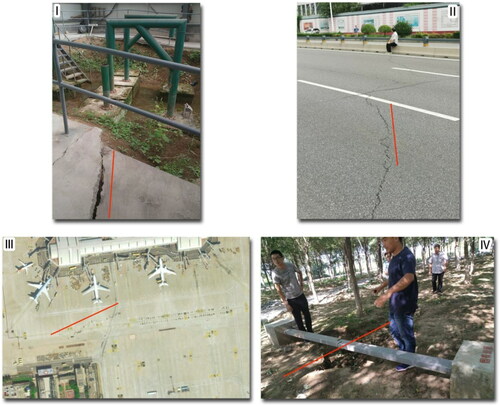
The fault zone has manifested a barrier because the groundwater hydraulic connection between the hanging wall and the footwall was cut-off (). The subsidence gradient on both sides of the faults increases with continuous groundwater exploitation and augments the horizontal force. The ground fissure or damage of the pipeline and building is the most developed. Considerable ground fissures have been found and studied over the past decades. The Beijing Institute of Hydrogeology and Engineering Geology successively established the Xiwang Road and Songzhuang ground fissure monitoring stations (). No maximum subsidence gradients were observed in both areas compared with the subsidence gradient in the south of Beijing Capital Airport (). However, several centimetre displacement difference was observed in Xiwang Road. The subsidence gradient is much larger along the south of Beijing Capital Airport subsidence (), and it could frequently lead to airport pavement rupture. This situation may result in huge economic losses due to the repeated sealing work of airport pavement in Terminal 2. Nevertheless, few studies are still currently carried out about the spatial distribution characteristics of the secondary geological disasters induced by high displacement gradient around land subsidence areas.
Figure 14. This map shows several field sites located in I, II, III and IV (labelled with black square in ). I and IV are ground fissure monitoring stations located in the Xiwang Road, Shunyi District and Songzhuang, Tongzhou District, and they have showed continuous development of ground fissures in recent years. II and III are ground surface rupture phenomena along the Shunyi–Liangxiang Fault (F3). The ground fissure of II occurred near Risheng Building Materials City, Shunyi District and was recorded in August 2020. The ground fissure of III occurred in the south of Terminal 2 of Beijing Capital Airport in 2017, and it has disappeared due to the sealing work of airport pavement.
7. Conclusion
To clearly show the spatial distribution and temporal variation of land subsidence in the Beijing Plain, we use four modes of SAR images from three types of satellite platform, Image Mode S2 of Envisat, Wide mode of Radasat-2, Extra-Fine mode of Radasat-2 and Strip mode of TerraSAR-X, to annually achieve dynamic monitoring of surface deformation and multi-year accumulated subsidence of the Beijing Plain during the period between 2007 and 2019 based on InSAR time-series analytical method. Critical land subsidence areas and their subsidence rates and temporal–spatial distribution, such as Laiguangying–Ciqu, Yangfang–Pingxifu, Xiaotangshan and Houshayu subsidence, are identified and mapped. Meanwhile, we study in detail the monitoring accuracy of different SAR data by levelling measurement within the same period. The physical parameters and monitoring period of different measurement data may have a certain measurement deviation because they are not the completely same; however, their variation trend reflecting on the spatial surface deformation characteristics is consistent.
Over-exploitation groundwater is the dominant driving factor of land subsidence in Beijing. We utilize land use as a proxy for groundwater extraction and find that the land subsidence in Tongzhou and south of Changping is mainly caused by deep-confined groundwater exploitation for dry land and rural settlements/manufacturing enterprise land use. The large subsidence in the west of Shunyi and east of Changping is chiefly driven by shallow-groundwater exploitation for dry land, woodland and construction land use, and the patchy subsidence is also caused by exploiting deep-confined groundwater for rural settlements/manufacturing enterprises.
The subsiding area was overlaid with Quaternary landform, Quaternary strata and pre-existing faults. The good correlation between the land subsidence area and the geology system demonstrates that the subsiding areas in the Plain are distributed in the edge of the Alluvial–Proluval Fan of Yongding or Chaobai River or in the lacustrine or swampy sediments among the Alluvial–Proluval Fans. Thicker compressible deposits and high subsidence gradients are observed on the hanging wall of those active faults and moreover parallel to these active faults. This notion could suggest that those active faults in Beijing make the aquifer system and laterally material discontinuity. Therefore, conversely, we could take advantage of the InSAR displacement or velocity maps, especially based on high resolution SAR data, to identify or precisely revise some active faults in the fracture systems. However, some fault traces may be difficult to be identified, such as in the north edge of Laiguangying–Ciqu subsidence and in the middle of Laiguangying–Ciqu subsidence, the Sunhe-Nankou fault dose not spread along the north edge of Laiguangying–Ciqu subsidence, and meanwhile unmapped faults exist along the X-shaped narrow zones where a high differential displacement occurs with a limited spatial extent. Above all, further study between subsiding areas, faults and ground fissure could be needed to improve our knowledge of their interaction relationship, spatial heterogeneity of Quaternary strata in the structural and material properties and better hazard mitigation proposals.
Acknowledgments
This work is supported by Multi-source Remote Sensing Monitoring and Early-warning of Geological Environment Evolution in Urban Agglomeration (2017YFB0503803), New SAR Integrated Environmental Monitoring System and its Application (2017YFB0502700), which are organized and implemented by the Ministry of Science and Technology of the People’s Republic of China, and the National Land Subsidence Survey and Monitoring in China based on InSAR (DD20190513), which belongs to Geological Survey Project. The radar data processing and surface deformation extraction have been carried out on the basis of Gamma software of Switzerland Gamma Remote Sensing coupled with SRTM DEM (http://srtm.csi.cgiar.org/SELECTION/inputCoord.asp) and ArcGIS software. We thank ESA for providing the Envisat data and MDA for the Radarsat-2 data. We also thank Yi Wang from China Areo Geophysical Survey and Remote Sensing Center for Land and Resource for field surveys, Kunchao Lei and Minghuan Qi from the Beijing Institute of Hydrogeology and Engineering Geology for providing the comparison between InSAR-velocity and levelling data, and Haochuan Li from State Geospatial Information Centre for the land use data. Finally, we sincerely convey our gratitude and thanks to the anonymous reviewers for their suggestions and comments for the manuscript improvement.
References
- Amelung F, Galloway DL, Bell JW, Zebker HA, Laczniak RL. 1999. Sensing the ups and downs of Las Vegas-InSAR reveals structural control of land subsidence and aquifer-system deformation. Geology 27(6):483–486.
- ASAR Product Handbook of Envisat. 2007. Available online: https://earth.esa.int/pub/ESA_DOC/Envisat/ASAR/asar.ProductHandbook.2_2.pdf.
- Bai LY, Li X, Qin HM, Zhang XL, Zhang YZ. 2018. Study on the cyclic stratigraphy activity of Nankou–Sunhe fault in Beijing Plain since quaternary and its tectonic significance. Geoscience. 32(2):270–278.
- Bai LY, Zhang L, X. M. Wang, J. M C, Yang TS, Wu HC, He J, et al. 2014. Quaternary magnetostratigraphic time framework constraints on activity characteristics of the Shunyi Fault, Beijing Plain. Geoscience. 28(6):1234–1242.
- Beijing Water Resources Bulletin. 2007–2019. http://swj.beijing.gov.cn/zwgk/szygb/.
- Beijing. 2019. https://baike.baidu.com/item/beijing/128981.
- Bell JW, Amelung F, Ferretti A, Bianchi M, Novali F. 2008. Permanent scatterer InSAR reveals seasonal and long-term aquifer-system response to groundwater pumping and artificial recharge. Water Resour Res. 44(2):1–18.
- Berardino P, Fornaro G, Lanari R, Sansosti E. 2002. A new algorithm for surface deformation monitoring based on small baseline differential SAR interferograms. IEEE Trans Geosci Remote Sens. 40(11):2375–2383.
- Bianchini S, Moretti S. 2015. Analysis of recent ground subsidence in the Sibari plain (Italy) by means of satellite SAR interferometry-based methods. Int J Remote Sens. 36(18):4550–4569.
- Bianchini S, Solari L, Soldato MD, Raspini F, Montalti R, Ciampalini A, et al. 2019. Ground subsidence susceptibility (GSS) mapping in Grosseto Plain (Tuscany, Italy) based on satellite InSAR data using frequency ratio and fuzzy logic. Remote Sens. 11(17):1–27.
- Cai XM, Luan YB, Guo GX, Liu H. 2009. Geological system in Beijing Plain area. Theor Investig. 4(3):6–12.
- Canova F, Tolomei C, Salvi S, Toscani G, Seno S. 2012. Land subsidence along the Ionian coast of SE Sicily (Italy), detection and analysis via Small Baseline Subset (SBAS) multitemporal differential SAR interferometry. Earth Surface Processes and Landforms. 37(3):273–286.
- Chaussard E, Amelung F, Abidin H, Hong S-H. 2013. Sinking cities in Indonesia: ALSO PALSAR detects rapid subsidence due to groundwater and gas extraction. Remote Sens Environ. 128:150–161.
- Chaussard E, Wdowinski S, Cabral-Cano E, Amelung F. 2014. Land subsidence in Central Mexico detected by ALOS InSAR time-series. Remote Sens Environ. 140:94–106.
- Chatterjee RS, Fruneau B, Rudant JP, Roy PS, Frison P-L, Lakhera RC, Dadhwal VK, Saha R. 2006. Subsidence of Kolkata (Calcutta) City, India during the 1990s as observed from space by differential synthetic aperture radar interferometry (D-InSAR) technique. Remote Sens Environ. 102(1–2):176–185.
- Chen FL, Lin H, Li Z, Chen Q, Zhou JM. 2012. Interaction between permafrost and infrastructure along the Qinghai–Tibet Railway detected via jointly analysis of C- and L-band small baseline SAR interferometry. Remote Sens Environ. 123:532–540.
- Chen FL, Lin H, Zhou W, Hong TH, Wang G. 2013. Surface deformation detected by ALOS PALSAR small baseline SAR interferometry over permafrost environment of Beiluhe section, Tibet Plateau, China. Remote Sens Environ. 138:10–18.
- Cianflone G, Tolomei C, Brunori CA, Dominici R. 2015. InSAR time series analysis of natural and anthropogenic coastal plain subsidence: the case of Sibari (Southern Italy). Remote Sens. 7(12):16004–16023.
- Cigna F, Cabral-Cano E, Osmanoglu B, Dixon TH, Wdowinski S. 2011. Detecting subsidence-induced faulting in Mexican urban areas by means of persistent scatterer interferometry and subsidence horizontal gradient mapping. Geoscience & Remote Sensing Symposium. IEEE. 2125-2128..
- Cigna F, Osmanoğlu B, Cabral-Cano E, Dixon TH, Ávila-Olivera JA, Garduño-Monroy VH, DeMets C, Wdowinski S. 2012. Monitoring land subsidence and its induced geological hazard with synthetic aperture radar interferometry: a case study in Morelia, Mexico. Remote Sens Environ. 117:146–161.
- Cui WJ, Lei KC. 2018. Some ideas on land subsidence working from the view of coordinated development in Beijing–Tianjin–Hebei regions. Urban Geol. 13(2):25–30.
- Elias P, Kontoes C, Papoutsis I, Kotsis I, Marinou A, Paradissis D, Sakellariou D. 2009. Permanent scatterer InSAR analysis and validation in the Gulf of Corinth. Sensors (Basel)). 9(1):46–55.
- Erban LE, Gorelick SM, Zebker HA. 2014. Groundwater extraction, land subsidence, and sea-level rise in the Mekong Delta, Vietnam. Environ Res Lett. 9(8):084010.
- Ferretti A, Prati C, Rocca F. 2000. Non-linear subsidence rate estimation using permanent scatterers in differential SAR interferometry. IEEE Trans Geosci Remote Sens. 38(5):2202–2212.
- Ferretti A, Prati A, Rocca F. 2001. Permanent scatterers in SAR. IEEE Trans Geosci Remote Sens. 39(1):8–20.
- Figueroa-Miranda S, Hernández-Madrigal VM, Tuxpan-Vargas J, Villaseñor-Reyes CI. 2020. Evolution assessment of structurally-controlled differential subsidence using SBAS and PS interferometry in an emblematic case in Central Mexico. Eng Geol. 279:105860.
- Ge DQ, Wang Y, Guo XF, Liu SW, Fan JH. 2007. Surface deformation monitoring with multi-baseline D-InSAR based on coherent point target. J Remote Sens. 11(4):574–580.
- Ge DQ, Wang Y, Guo XF, Fan JH, Liu SW. 2008. Surface deformation field monitoring by use of small-baseline differential interferograms stack. J Geodesy Geodyn. 28(2):61–66.
- Ge DQ, Zhang L, Wang Y, Guo XF, Wang Y. 2017. Regional ground settlement monitoring method based on multiple track and long strip CTInSAR (coherent target synthetic aperture radar interferometry).
- Guo HP, Bai JB, Zhang YQ, Wang LY, Shi JS, Li WP, et al. 2017. The evolution characteristics and mechanism of land subsidence in typical areas of the North China Plain. Geol China. 44(6):1115–1127.
- Heleno SIN, Oliveira LGS, Henriques MJ, Falcão AP, Lima JNP, Cooksley G, Ferretti A, Fonseca AM, Lobo-Ferreira JP, Fonseca JFBD, et al. 2011. Persistent scatterers interferometry detects and measures ground subsidence in Lisbon. Remote Sens Environ. 115(8):2152–2167.
- Hooper A, Zebker H, Segall P, Kampes B. 2004. A new method for measuring deformation on volcanoes and other natural terrains using InSAR persistent scatterers. Geophys Res Lett. 31:L23611.
- Hu B, Wang HS, Sun YL, Hou JG, Liang J. 2014. Long-term land subsidence monitoring of Beijing (China) using the Small Baseline Subset (SBAS) technique. Remote Sens. 6(5):3648–3661.
- Hu L, Dai K, Xing C, Li Z, Tomás R, Clark B, Shi X, Chen M, Zhang R, Qiu Q, et al. 2019. Land subsidence in Beijing and its relationship with geological faults revealed by Sentinel-1 InSAR observations. Int J Appl Earth Obs Geoinform. 82:101886.
- Jia SM, Wang HG, Zhao SS, Luo Y. 2007. A tentative study of the mechanism of land subsidence in Beijing. Anal Res. 2(1):20–26.
- Jiang LM, Lin H, Ma JW, Kong B, Wang Y. 2011. Potential of small-baseline SAR interferometry for monitoring land subsidence related to underground coal fires: Wuda (Northern China) case study. Remote Sens Environ. 115(2):257–268.
- Lei KC, Luo Y, Chen BB, Guo GX, Zhou Y. 2016. Distribution characteristics and influence factors of land subsidence in Beijing area. Geol Chain. 43(6):2216–2225.
- Li M, Ge D, Liu B, Zhang L, Wang Y, Guo X, Wang Y, Zhang D. 2019. Research on development characteristics and failure mechanism of land subsidence and ground fissure in Xi'an, monitoring by using time-series SAR interferometry. Geomat Nat Hazards Risk. 10(1):699–718.
- Liu YP, Zhang FL, Wang Y, Hu LY. 2014. Research on land subsidence of recent years Beijing. Sci Surv Mapp. 39(10):68–70.
- Liu MK, Kou WJ, Luo Y, Wang R, Tian F, Zhao CX, et al. 2016. Analysis of the relationship between groundwater exploitation and land subsidence in Beijing. Urban Geol. 11(1):21–25.
- Luo Y, Jia SM, Zhao B, Tian F. 2011. Characteristics and causes of land subsidence in the south of Beijing. Res Investig. 6(3):1–21.
- Luo Y. 2017. Research in the new trends of Beijing land subsidence. Shanghai Land & Resources. 38(2):13–17.
- Haghshenas Haghighi M, Motagh M. 2019. Ground surface response to continuous compaction of aquifer system in Tehran, Iran: Results from a long-term multi-sensor InSAR analysis. Remote Sens Environ. 221:534–550.
- Meisina C, Zucca F, Fossati D, Ceriani M, Allievi J. 2006. Ground deformation monitoring by using the permanent scatterers technique: the example of the Oltrepo Pavese (Lombardia, Italy). Eng Geol. 88(3–4):240–259.
- Metternicht G, Hurni L, Gogu R. 2005. Remote sensing of landslides: an analysis of the potential contribution to geo-spatial systems for hazard assessment in mountainous environments. Remote Sens Environ. 98(2–3):284–303.
- Pacheco J, Arzate J, Rojas E, Arroyo M, Yutsis V, Ochoa G. 2006. Delimitation of ground failure zones due to land subsidence using gravity data and finite element modeling in the Querétaro valley, México. Eng Geol. 84(3–4):143–160.
- Qu FF, Zhang Q, Lu Z, Zhao CY, Yang CS, Zhang J. 2014. Land subsidence and ground fissures in Xi'an, China 2005–2012 revealed by multi-band InSAR time-series analysis. Remote Sens Environ. 155:366–376.
- Radarsat-2 Satellite Characteristics. 2015. http://www.asc-csa.gc.ca/eng/satellites/radarsat/radarsat-tableau.asp.
- Raucoules D, Cartannaz C, Mathieu F, Midot D. 2013. Combined use of space-borne SAR interferometric techniques and ground-based measurements on a 0.3 km2 subsidence phenomenon. Remote Sens Environ. 139:331–339.
- Scharroo R, Visser P. 1998. Precise orbit determination and gravity field improvement for the ERS satellites. J Geophys Res. 103(C4):8113–8127.
- Sharma P, Jones CE, Dudas J, Bawden GW, Deverel S. 2016. Monitoring of subsidence with UAVSAR on Sherman Island in California's Sacramento-San Joaquin Delta. Remote Sens Environ. 181:218–236.
- Tian F, Luo Y, Zhou Y, Jiang Y, Yang Y, Chen ZZ. 2014. Dynamic changes of layered monitored land subsidence in Beijing. Shanghai Land Resour. 35(4):76–80.
- Tian F, Luo Y, Zhou Y, Li Y, Kou WJ, Jiang Y, et al. 2017. Contrastive analysis of spatial–temporal evolution between land subsidence and groundwater exploitation in Beijing. South-to-North Water Transfers Water Sci Technol. 15(2):163–169.
- Yang Y. 2013. Effectiveness of InSAR monitoring of land subsidence in Beijing. Shanghai Land Resour. 34(4):21–24.
- Yang Y, Zheng FD, Liu LC, Wang SF, Wang R. 2013. Study on the correlation between groundwater level and ground subsidence in Beijing plain areas. Geotechnical Investigation & Surveying. (8):44–48.
- Zhang Q, Zhao CY, Ding XL, Chen YQ, Wang L, Huang GW, et al. 2009. Research on recent characteristics of spatio-temporal evolution and mechanism of Xi’an land subsidence and ground fissure by using GPS and InSAR techniques. Chin J Geophys. 52(5):1214–1222.
- Zhang XL, Zhang L, Cai XM, Bai LY. 2016. A study of structure and activity characteristics of the northern segment of Huangzhuang–Gaoliying fault in Beijing Plain area. Geol China. 43(4):1258–1265.
- Zhao ZH. 2009. Analysis of the neotectonic activity and the bad geological phenomenon caused by it in Beijing Plain areas. J Geol Haz Environ Preserv. 20(2):66–70.