
 ?Mathematical formulae have been encoded as MathML and are displayed in this HTML version using MathJax in order to improve their display. Uncheck the box to turn MathJax off. This feature requires Javascript. Click on a formula to zoom.
Abstract
With the acceleration of urbanization and industrialization, coal cities in China are suffering from the conflicts between urban construction and coal mining (land- mining). Land-mining conflicts in coal cities have caused serious destruction of land resources and the aggravation of ecological and economic conflicts. In order to deal with the land-mining conflict, we proposed a new three-dimensional spatial analysis framework to overall plan the underground coal exploitation and aboveground land use based on economic comparative advantage and value equilibrium theory. First, estimating aboveground land resource value (LP) and underground coal resource value (MP), then comparing MP and LP by equilibrium analysis method to recognize three-dimensional development boundary. Last three boundaries derived were used to divide the study area into four parts (construction/mining-forbidden area, construction put-off/mining-limited area, construction limited/mining-put-off area and construction forbidden/mining area). Ji’ning, a typical Chinese land-mining conflict city, is taken as a case to verify the effectiveness of the new method. The results show that the amount of coal mining and urban construction area increased by about 2 times, the new method can resolve land-mining conflicts in coal cities. It can contribute to a better reference for the design of coal city regulation and control policies design.
1. Introduction
In the past century, coal has been one of the most primary energy resources in the world, accounting for more than 30% of the total energy consumption for a long time (Wu and Chen Citation2018). Coal is also one of the most important energy and industrial raw materials in China, and it accounted for more than 65% of China’s total energy production and consumption (Yang et al. Citation2015). Coal cities have produced a total of 52.9 billion tons of raw coal since 1949, making historic contributions to the establishment of a complete industrial system and the promotion of national economic development in China. However, rapid urbanization and industrialization in China have resulted in increasingly serious land use conflict, especially the continuous haze from 2012 being of an alert to urban living ecological environment (Jiang Citation2016; Jin et al. Citation2020). Land use conflict refers to the phenomenon of spatial competition and conflict of rights and interests between the people and the land generated by the stakeholders around the land use method and structure in the process of land resource use (Zou et al. Citation2020). In this study, land-mining conflict means the spatial conflict between urban construction aboveground and coal mining underground.
Understanding the reasons of land-mining conflict is necessary to solve land-mining conflict in coal city. Reviewing the previous studies, we found that the land-mining conflicts in coal cites are mainly caused by the special background of the development of coal cities in China. First, many coal cities built around the coal resources. During 1938 to 1945, industrial and mining areas mixed with residential place, and even some important buildings constructed on the coal seam, which resulted the malformation of the whole city’s layout and serious potential danger. After 1949, in order to boost the economy, a large numbers of cities still built in the range of coal mining area. This is the main reason of the land-mining conflict. Second, no enough attentions had payed to the coordination of coal city construction and coal resource extraction until year 2014. Different departments separately approve and formulate development plans, which make it difficult to connect the planning technical regulations before 2014. Specifically, the National Development and Reform Commission is responsible for the approval of coal mining area planning and the determination of the main body of coal resource development. Provincial or municipal governments are responsible for reviewing and approving regional development project construction plans, and local land and resources management departments determine the development main body of land resources.
As a gathering place of land and coal resources, the land use conflicts have escalated. More specifically, the first is that the increasing coal resources were found under the cities, villages, roads and water with the improvement of exploring techniques and the intensification of exploring reserve resources (Larondelle and Haase Citation2012; Jiang et al. Citation2015; Bi et al. Citation2015; Xie Citation2015; Zhang et al. Citation2018; Liu et al. Citation2019). Second is the serious damages of land resource due to exploring coal underground (X. Li et al. Citation2013; Mao Citation2014), and the third is the ‘increasing intensification’ of Coal city eco-economic conflicts (Lin and Liu Citation2010; Huang et al. Citation2013; Cieślak Citation2019).
To resolve or prevent land-mining conflicts, previous studies proposed many methods. Such as comprehensive planning and management of coal mining and land use before coal exploiting (Hilson Citation2002; Delang et al. Citation2013; Wawryk Citation2014; Johnsen Citation2016), systematic engineering approaches through simultaneously considering social, economic, and environmental factors to optimize mining design for more sustainable mining activities (Craynon et al. Citation2016), and land use policies. They concluded that mining companies, governments, communities, and the public should focus on factors such as mining disturbance to land, mine waste management and land reclamation and mining right transfer fees. Among them, the government establishes a complete legislative framework for stakeholders in mining activities and strengthen social management responsibilities and reuse of mining land can avoid controversies surrounding permitting at the site (Barkemeyer et al. Citation2015; Popović et al. Citation2015). Sandström et al. (Citation2003) used ‘3S’ technology to monitor and analyze Swiss land activities and demonstrated that using participatory management of stakeholders can effectively resolve conflicts.
A few studies have given legal solutions to resolve land use conflict and found that the fixed time and space tax is enough to motivate the company to restore the damaged land (Doole and White Citation2013; Wawryk Citation2014). On the reclamation and management of damaged land after exploring mining, many studies agreed that land reclamation and ecological reconstruction measures can improve the environment of the mining area (Bian Citation2005; Bai and Zhao Citation1999; Zhou and Wang Citation2014; Bai et al. Citation2018). Han et al. (Citation2012) explored the reasonable system of open-pit mines based on its characteristics and the evolution of open-pit mines. Based on analyzing the problems of coalmines in coal cities, Yuan and Zhou (Citation2012) proposed that there are four subsystems of economy, society, environment, and management in the coordinated development of cities and mines. And concluded that the systematic construction of a city-mine collaborative development system requires the combination of resource development and sustainable urban development through a game analysis between the government and coal enterprises.
In order to make the overall development of the urban construction and mine resource exploring, Li (Citation2015) pointed out that the connotation of the coordinated mining site should include three aspects such as the integrated management of mining and land administration, the integrated utilization of mining resources and the coordinated development of mining, urban and rural areas. Among them, the key technical system of the overall development of the mine and the direction that the overall development should be strengthened. Geng et al. (Citation2012) proposed measures such as adhering to the principle of planning first, and establishing and standardizing ecological compensation mechanisms in mining areas, which are beneficial to the city's coal mines' overall development. Chen and Deng (Citation2014) built a new model for the integrated development of urban, mining, and rural areas in view of the problems of regional urban compaction and the exploitation of mineral resources to reduce the available space in cities and towns.
Previous studies have carried out many researches on finding effective ways to resolve land use conflicts. However, few scholars contact on coordinating urban construction and coal resource extraction in coal cities from the perspective of equilibrium Value between coal resource value and land resource value within the three-dimensional space.
To this aim, we integrate urban construction aboveground and coal mining underground into a unified research framework, and establish a new frame based on theory of equilibrium value to solve the land–mining conflict. Taking Ji’ning city, a typical coal city as a case to demonstrate the model, providing decision-making references and scientific evidences for coal cities, especially resources overburden cities, to decide whether to choose underground coal resources to protect the national energy supply or to utilize land resources to support regional urban construction.
2. Method
A three-dimensional space optimization model was proposed through the equilibrium analysis of land resources value (LP) aboveground and coal resources value underground (MP, including reserve benefits MPreserves, gross profit MPgross and net benefits MPnet). Land price equilibrium model was first used to resolve conflicts between urban expansion and coal mines under urban in coal cities. There were three steps in three-dimensional space optimization. First, coal resource value underground and land resource value aboveground were evaluated, among them MP underground included reserve benefits MPreserves, gross profit MPgross and net benefits MPnet. Second, the three-dimensional development boundary of land-mining conflicts was recognized through comparing MP underground and LP aboveground, and it consisted of the forbidden-mining/building (FMB) boundary, limited-mining/put-off building (LMPU) boundary, and available-mining/forbidden-building (AMFB) boundary. Third, four control areas in three-dimensional space were ascertained with the boundary delimiting, combined with the boundaries of land use and underground mineral exploitation, namely the construction/mining-forbidden (CMF) area, construction put-off/mining-limited (CPML) area, construction limited/mining-put-off (CLMP) area and construction forbidden/mining (CFM) area, as shown in The detailed meaning and steps are as follows.
2.1. Estimation of coal value and land resource value
Underground coal resource value and aboveground land resource value were estimated based on previous research results and calculated methods (Xu et al. Citation2004; Li and Liu Citation2010; Hua and Bao Citation2012; X. Li et al. Citation2013).
2.1.1. Estimation of underground coal value per unit area
There are three kinds of underground coal value per unit area, respectively, the Coal reserves value (MPreserves), Coal resource gross profit (MPgross), and Coal resource net profit (MPnet). Specially, MPreserves means the unit area coal reserves value, which only considers the positive utility value generated by mining underground coal resources. MPgross, the unit area coal gross value, which is the value that deducted the financial cost such as manpower, material and financial resources from MPreserves. MPnet is the net coal value per unit area that deducted the environmental cost such as environmental pollution, ecological damage and ground subsidence from MPgross.
① MPreserves evaluation
MPreserves is the benefit value of coal reserves per unit area that does not consider the coal mining cost. Following previous literatures (Xu et al. Citation2004; Li and Liu Citation2010; Hua and Bao Citation2012; X. Li et al. Citation2013), it was constructed as follows:
(1)
(1)
Where P stands for average price of coal per ton, m stands for coal yield (tons) per unit area.
② MPgross evaluation
MPgross is the gross value of coal reserves per unit area that deducting the financial cost of raw coal such as manpower, material resources, financial resources. It can be calculated by following model (Bourassa et al. Citation2011; Hua and Bao Citation2012).
(2)
(2)
Where m represents the coal yield (tons) per unit area, Px stands for the average financial cost of raw coal per ton. It is weighted by the financial cost per ton of each mining area.
(3)
(3)
Where n indicates the number of mining area, i represents the i-th mining area; Pi represents the financial cost per ton of each mining area, ki indicates each weight and it based on the degree of influence of each mining area on the central city. Specially, it is defined as the ratio of the overlapping area about each mining area and urban planning area to the sum overlapping area.
③ MPnet evaluation
MPnet is the value of minerals per unit area after deducting such as environmental pollution, ecological damage, ground subsidence and other environmental cost from MPgross (Li and Liu Citation2010; Bourassa et al. Citation2011; Hua and Bao Citation2012).
(4)
(4)
Where is the residual per unit area of the mineral, S is the total area of the overlying area in the urban are. M is the total cost of the ecological environment treatment, including the value of water loss, soil erosion loss, surface subsidence loss, cultivated land loss, vegetation loss and other uncertain factors ecological damage, ground subsidence and other environmental investment value from MPgross (Li and Liu Citation2010).
can be calculated by EquationEq (5)
(5)
(5)
(5)
(5)
Where b is average mining right value per ton, m represents the reserves of mineral resources per unit area.
(6)
(6)
Where GY stands for average mining right per ton, GY can be obtained by formula (7).
(7)
(7)
Gi represents the unit price of mining rights for each mining area, ki stands for the weight of each mining area and it is same as ki in MPgross evaluation.
2.1.2 Aboveground land value evaluation
The value of land resource aboveground is generally divided into three types of prices such as industrial, commercial and residential, and the factors affecting land prices and assessment methods vary greatly between different types. Meanwhile, it is also difficult to grasp the law of spatial change. Therefore, assessing LP is a very complicated task. Fortunately, the benchmark land price can reflect the city’s comprehensive economic, social and environmental benefits and can be used as a quantitative indicator to measure regional land prices (Bourassa et al. Citation2011; A. Xu et al. Citation2011; Wei et al. Citation2011; J. Li et al. Citation2013; Zhu et al. Citation2018; Long et al. Citation2019). Meanwhile, the land department regularly updates the benchmark land price and the sample land price. Therefore, the LP was stimulated by an interpolation method based on the benchmark land samples.
2.2. Boundary determination of the land space of mining-land conflict cities
Three boundaries are identified by value equilibrium conditions model (8), (9) and (10).
(8)
(8)
(9)
(9)
(10)
(10)
FMB boundary refers to the spatial equilibrium curve where MPreserve is exactly equal to the LP. D1 is the distance to Central Business District (CBD, city centre O), the spatial equilibrium price on the curve is P1. The economics meaning is that under the scenario of only considering the benefit value of coal, LP on the curve as aboveground urban construction land equal the value of mining underground coal resources.
LMPU boundary refers to the spatial equilibrium curve on which MPgross is exactly equal to the LP. D2 is the distance to CBD, the spatial equilibrium price on the curve is P2. That means the use of land resources for aboveground urban construction and underground coal mining is equivalent under the condition of deducting the explicit financial cost of mining mineral resources.
AMFB boundary means the spatial equilibrium curve on which MPnet is just equal the LP, D3 is the distance to CBD, the spatial equilibrium price on the curve is P3. When both explicit financial cost of mining mineral resources and the hidden cost of ecological damage are deducted, the economic meaning is that LP as land for urban construction is equal to the value of the net benefit of underground mineral resources extracted as mining land.
2.3. Three-dimensional development zoning of land-mining conflict cities
Based on the delimitation of three boundaries, three-dimensional space was divided into four control areas including CMF area, CPML area, CLMP area and CFM area.
CMF area, the area nearest to city centre (the area in OD1 range of ), which is the area from the city centre (point O) to FMB boundary (D1 point). Specifically, this area is the current urban built-up area; most of them has been developed and constructed as commercial and high- density residential areas. LP gradually decreases with the distance increase from the city centre to outside according with the price of land rented by cities. In this region, LP is generally more than MPreserves, the land is selected for urban construction. When building new buildings, the geological conditions of the foundation, a reasonable span and height of the building, and distance from the blasting point of coal mining in the future should be considered.
Figure 1. The chart of space control types of coal covered areas.
Note: P stands for the land price aboveground, S stands for the distance to CBD, Pc, Pe stand for the explicit cost (financial cost) and hidden cost (environment cost) of underground mineral resources mining, respectively. LP stands for the total value of aboveground land resources. MP stands for the value of mineral underground, MPreserves stands for the maximum exploitation value of underground resources, MPgross stands for the positive value of coal resources deducting mining financial explicit cost; MPnet stands for the positive value of coal resources deducting financial explicit cost and ecological destruction hidden cost.
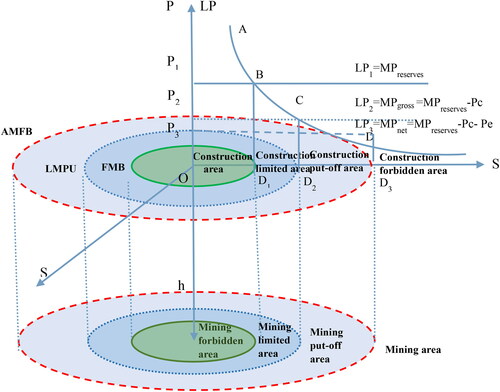
CPML area, a little away from the city centre (point O) and located in the urban planning and development area, which is the area from the border between the FMB border (D1) to the LMPU border (D2). In this region, LP is bigger than MPgross which deducted the financial explicit but smaller than MPreserves. In this area, urban construction aboveground has a slightly higher priority than coal mining underground. Coal mining underground should be avoided as much as possible, if coal mining is really needed, feasibility and necessity studies should be made. In this area, before coal mining, the impact of coal mining on surrounding building must be predicted using numerical simulation technology, and mining depth was determined according the predicted result.
CLMP area is far from the city centre (point O), but still in the range of city development in long term planning (from D2 to D3). In this region, LP is higher than MPnet that consider the loss ecological value brought by mining and the harmful effects on the continuous development of economic society and lower than MPgross. The mining of underground resources will be carried out under the acceptable ecological conditions based on the support of corresponding innovative technology conditions. In this region, coal mining underground has a slightly higher priority than urban construction aboveground. Urban construction should be avoided as much as possible. If there is a need for construction, a corresponding explanation should be made.
CFM is more far away from the city (> D3 area). In this region, the land value using for developing and constructing aboveground is lower than the coal resources mining value underground generally. LP is less than MPnet. The land in this region should be used as exploring coal resource underground instead of urban construction.
3. Empirical analysis
3.1. Study area
Ji’ning City, located in the southwest of Shandong Province, is one of the central cities of the Huaihai Economic Zone. It has a warm temperature monsoon climate with 11,187 Km2 and about 8.46 million resident population in 2018. As the main coal resource-based city and coal energy supply base in Shandong Province, Ji’ning is a veritable coal city and its raw coal production accounts for 52% of Shandong Province’s total output (Xiao et al. Citation2018). The coal area of Ji’ning city is 4,826 Km2 and it accounts for 45% of the total area of Shandong Province. According to statistics, Ji’ning City has 14 billion tons of coal reserves, accounting for 53.8% of Shandong Province.
and show that coal-bearing districts such as Tangkou, Daizhuang, Xuchang, Yang Village, Tianzhuang, Ji’ning Mine NO.2 and Anjv Mine (mainly includes NO.up3, down3, 6, down10, 15, 16, 17, 18 coal seam) are just tightly surround the urban area of Ji’ning. And there is a big conflict between urban land use and coal mining. The area of urban planning in downtown Ji’ning is 217.15 km2, among them the coal covered area accounts for 58.56% which has 127.16 km2. Overlap coal resources are as high as 1.025 × 10⁶ thousand tons that means nearly 60% of the future space expansion of Ji’ning city needs to be at the cost of forbidding overlap coal resources. Therefore, on one hand city development will continue consuming more construction land (such as urban area in Ji’ning was 2.12 km2 when the city was built and it increased to 7.04 km2 in 1950, 32.96 km2 in 1998 and 75.78 km2 in 2006). On the other hand, coal resource development restricts the expansion of land space and the transformation of city from resource superiority to economic superiority. So considering the spontaneity of ever-increasing urban spatial expansion, it is important to evaluate the comprehensive benefit of coal resources and urbanization on social economy, optimize layout under weigh and balance and provide decision and scientific basis for walking out the dilemma.
Figure 2. Distribution of coal resources in downtown Ji’ning.
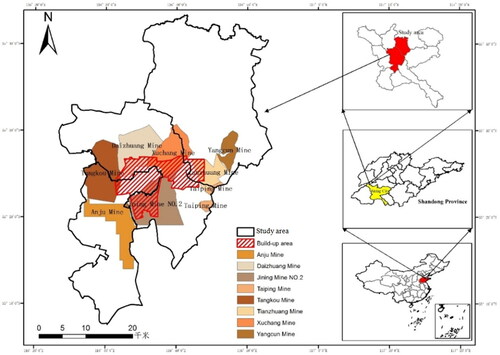
Table 1. Covered coal resources in Ji’ning downtown area.
3.2. Coal resources and land resource valuation
(1) Estimation of underground coal value per unit area
The underground coal value (MPreserves, MPgross, MPnet) was calculated respectively. The coal output per unit area, the unit cost and the weight of raw coal of each coalmine are determined with reference to the Ji’ning Coal Reserves Evaluation Report. In this case, we only taken the unit price of mining right and the cost of geological environment governance. Calculation results are in .
(2) Aboveground land resource value evaluation
Table 2. Evaluation of three – type’s underground mining exploitation and the corresponding three-dimensional space borders unit: Yuan/m2.
According to the calculation model of aboveground land resource value, and the updated report of urban land price of Ji’ning City in 2013, Ji’ning standard land price can be calculated. The results are showed in .
Table 3. Appraisal of standard land price in Ji’ning city.
With the reference to existing land price sample selection methods (J. Li et al. Citation2013; Ma Citation2019) and standard land price in ,we get the urban centre specimen land of Ji’ning city including Industrial, Commercial, Residential land as .
Figure 3. The sample points of industrial land, commercial land and residential land in Ji’ning central district (a show commercial sample points, b show industrial sample points and c shows residential sample points).
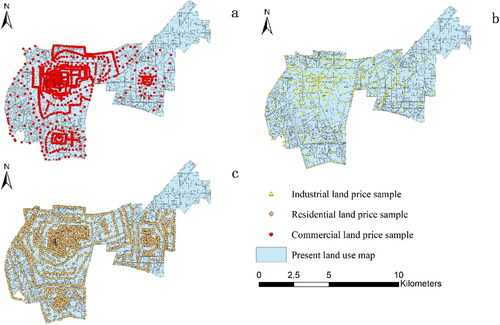
As a kind of space data, the feature of specimen land price is structural and heterogeneous. There are two most commonly used interpolation methods in all disciplines, Inverse distance weighted (IDW) and Ordinary Kriging (OK) (Zarco-Perello and Simões Citation2017). Among them, IDW uses arbitrary exponential weighting of the influence that each sample has according to distance, while OK involves a process of variography to model the spatial autocorrelation of the data to assign weights, which can result in better interpolations under an appropriate sampling design (Shukla et al. Citation2020). Therefore, the results Ordinary Kriging Interpolation is more accurate than Inverse Distance Weighted Interpolation (Zarco-Perello and Simões Citation2017; Ma Citation2019). The ordinary Kriging interpolation method is used to interpolate the known land price samples to obtain the spatial distribution map of the land comprehensive value in the research area and then draw the contour map of the land value. The land price of Ji’ning City shows the characteristics of ‘high centre and low surrounding areas’ and the contour of land value successively decreases from urban centre to its surrounding.
3.3. Boundary determination and result analysis
3.3.1. Boundary determination
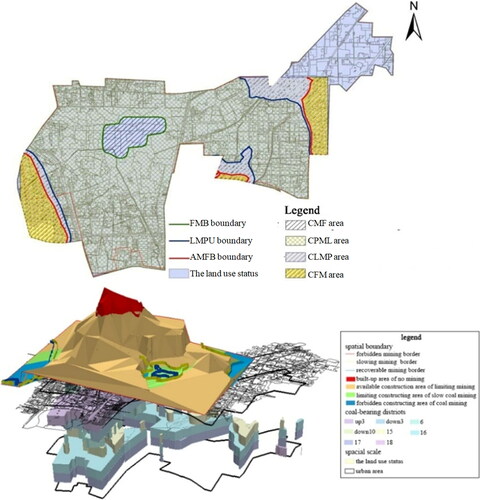
Based on the spatial distribution of LP, MP and the condition of boundary determination. We acquired the FMB boundary, LMPU boundary and AMFB boundary. Then used the three boundaries to divide the three-dimensional space into four regions including CMF area, CPML area, CLMP area, and CFM area. The result is shown in .
Figure 4. Space border delimitation and area restriction plan (above) and three-dimensional map (under).
3.3.2. Result analysis
According to the result of Equilibrium value analysis between coal value and land resource value, the area of land-mining conflict in Ji’ning city centre was divided into four control areas ( and ): CMF area (8.46 km2), CPML area (79.19 km2), CLMP area (12.63 km2) and CFM area (26.88 km2). CMF and CPML area are 87.65 km2, and they account for 68.93% of the entire land-mining conflict area. In CMF area, when building new buildings, it is necessary to consider the geological conditions of the foundation, a reasonable span and height of the building to enhance the seismic resistance, and distance from the blasting point of coal mining in the future. In CPML area, numerical simulation technology should be used to predict the impact of coal mining on surrounding building before mining and determine its mining depth. At the same time, the corresponding specific measures must be proposed for the infrastructure, mining and mine closure period of coal mining from the perspective of engineering measures. While CLMP and CFM area are totally 39.51 km2, occupied 31.07% of the full land-mining conflict area. In the view of underground mining, the area of land-mining conflict in Ji’ning city centre was divided into four control areas: mining- forbidden area (0 tons coal), mining-limited area (6.33 × 10⁸ tons coal), mining-put-off area (1.47 × 10⁸ tons coal), and mining area (8.72 × 10⁸ tons coal). The total coal resource of mining-forbidden and mining- limited area is totally 6.33 × 10⁹ tons, and it occupied 86.13% of the total coal reserves. However, the coal resource of mining-put-off and mining area are totally 1.02 × 10⁹ tons, accounting for 13.87% of the total coal reserves in the land-mining conflict area (). The mining output and development ratio will doubled if this method is applied in Ji’ning City.
Table 4. Covered area space restriction in Ji’ning central restricts.
Table 5. Comparison of mineral resources exploitation quantity and ratio in Ji’ning city before and after regulation.
4. Conclusions
In order to solve the land-mining conflicts, this study proposes a new frame to balance the urban construction aboveground and coal mining underground. Conclusion are as follows: (1) The separation of ownership of co-location resources is the root cause of the conflict land-mining, integrating urban construction aboveground and coal mining underground in three-dimensional space may solve the land–mining conflict. (2) Based on a unified analysis framework for urban construction aboveground and coal mining underground, a three-dimensional space optimization model for value equalization was constructed, and the three control boundaries (including FMB boundary, LMPU boundary and AMFB boundary) and four control areas such as CMF area, CPML area, CLMP area and CFM area. (2) The quantity of coal mining and area of urban construction are about two times as much as before, and this method can resolve land-mining conflicts in Ji’ning cities. It can contribute to a better reference for the design of coal city regulation and control policies design.
Disclosure statement
No potential conflict of interest was reported by the authors.
Additional information
Funding
References
- Bai Z, Zhao J. 1999. On ecological rehabilitation of mining areas. J Nat Resourc. 14(1):35–41.
- Bai Z, Zhou W, Zhao Z, Al E. 2018. Rethink on ecosystem restoration and rehabilitation of mining area. China Land Sci. 32(11):1–9.
- Barkemeyer R, Stringer LC, Hollins JA, Josephi F. 2015. Corporate reporting on solutions to wicked problems: Sustainable land management in the mining sector. Environ Sci Policy. 48:196–209.
- Bian Z. 2005. Research on the recultivation and ecological reconstruction in coal mining area in China. Resourc Indust. 7(2):18–24. http://en.cnki.com.cn/Article_en/CJFDTOTAL-ZIYU200502005.htm.
- Bi R, Bai, Z,Li H. 2015. Land use changes in opencast mine based on RS and GIS technology. Trans Chinese Soc Agric Eng. 12:201–204.
- Bourassa SC, Hoesli M, Scognamiglio D, Zhang S. 2011. Land leverage and house prices. Region Sci Urban Econ. 41(2):134–144.
- Chen X, Deng F. 2014. Exploring a new model for the integrated development of urban, mining and rural areas in Suzhou city. J Chifeng Univ. 30(9):39–41.
- Cieślak I. 2019. Identification of areas exposed to land use conflict with the use of multiple- criteria decision-making methods. Land Use Policy. 89(September):104225.
- Craynon JR, Sarver EA, Ripepi NS, Karmis ME. 2016. A GIS-based methodology for identifying sustainability conflict areas in mine design – a case study from a surface coal mine in the USA. Int J Min Reclam Environ. 30(3):197–208.
- Delang CO, Toro M, Charlet-Phommachanh M. 2013. Coffee, mines and dams: Conflicts over land in the Bolaven Plateau, southern Lao PDR. Geograph J. 179(2):150–164.
- Doole GJ, White B. 2013. Optimal dynamic regulation of the environmental impact of mining across diverse land types. New Zealand Econ Paper. 47(3):304–323.
- Geng H, Chen F, Zhao L, &, et al. 2012. Restraints and development countermeasures of coordinating development of coal enterprise and city where it is located. China Coal. 38(7):9–14. +49.
- Han W, Yin H, Bai Z. 2012. Research on the characteristics of the strip mine land use evolution and a land lease system. China Land Sci. 26(11):86–90.
- Hilson G. 2002. An overview of land use conflicts in mining communities. Land Use Policy. 19(1):65–73. (01)00043-6
- Hua W, Bao R. 2012. On assessing coal resource value using real option method. Shaanxi Coal. 31(6):86–88.
- Huang Y, Wang Y, Li X, Al E. 2013. Graphic analysis of spatio-temporal effect for vegetation disturbance caused by coal mining a case of Datong Coal Mine Area. Acta Ecologia Sinica. 33(21):7035–7043.
- Jiang D, Li X, Qu F et al. 2015. Simulation of cultivated land conversion trend and its effect on carbon budget in China, Tranactions Chinese Soc.Agric.Eng. 31(17):1–9.
- Jiang D. 2016. Research on the land-mining conflict and its control in coal city China University of Mining Technology.
- Jin G, Shi X, He D, Guo B, Li Z, Shi X. 2020. Designing a spatial pattern to rebalance the orientation of development and protection in Wuhan. J Geogr Sci. 30(4):569–582.
- Johnsen KI. 2016. Land-use conflicts between reindeer husbandry and mineral extraction in Finnmark, Norway: contested rationalities and the politics of belonging. Polar Geogr. 39(1):58–79.
- Larondelle N, Haase D. 2012. Valuing post-mining landscapes using an ecosystem services approach—an example from Germany. Ecol Indic. 18:567–574.
- Li G. 2015. Discussion on the overall development of the mine and key technologies. China Land Sci. 5(1):55–58.
- Li J, Li C, Yin Z. 2013. ArcGIS based kriging interpolation method and its application. Bullet Surv Map. 9:87–97.
- Li L, Liu Y 2010. Measurement and calculation method of ecological compensation standard for coal mining areas in the Southeast of China. Coal Sci Technol. 38(4):111–120.
- Li X, Lin Y, Liu S, Al E. 2013. Measurement of cultivated land compensation in mining areas based on the willingness of farmers. J Nat Resour. 28(9):1526–1537.
- Lin B, Liu X. 2010. China’s carbon dioxide emissions under the urbanization process: influence factors and abatement policies. Econ Res. 10:66–78.
- Liu H, Bi R, Wang G. 2019. Optimization and demonstration of land consolidation technical system in mining-under hilly billage region. Chinese J Agric Res Region Plan. 40(8):80–88.
- Long Y, Yan S, Jiang C, Al E. 2019. A new method for extracting lake bathymetry using multi-temporal and multi-source remote sensing imagery: a case study of Dongting Lake. Acta Geograph Sinica. 74(7):1467–1481.
- Ma Y. 2019. The study on benchmark land price updating of residential land BaoKang county based on the kriging spatial interpolation method. Central China Normal University.
- Mao J. 2014. The path selections of the resource-based cities transformation in China. Int J Financial Res. 5(2):171–174.
- Popović V, Miljković J, Subić J, Jean-Vasile A, Adrian N, Nicolăescu E. 2015. Sustainable land management in mining areas in Serbia and Romania. Sustainability. 7(9):11857–11877.
- Sandström P, Pahlén TG, Edenius L, Tømmervik H, Hagner O, Hemberg L, Olsson H, Baer K, Stenlund T, Brandt LG, et al. 2003. Conflict resolution by participatory management: remote sensing and GIS as tools for communicating land-use needs for reindeer herding in Northern Sweden. Ambio. 32(8):557–567.
- Shukla K, Kumar P, Mann GS, Khare M. 2020. Mapping spatial distribution of particulate matter using Kriging and Inverse Distance Weighting at supersites of megacity Delhi. Sustain Citi Soc. 54:101997.
- Wawryk A. 2014. Conservation and access to land for mining in protected areas: The conflict over mining in South Australia’s Arkaroola wilderness sanctuary. J Environ Law. 26(2):291–317.
- Wei X, Wang S, Lan H. 2011. Research on evaluation method of standard land price under conditions of sampling points without price or insufficient quantity. J Anhui Agric. 39(22):13694–13695.
- Wu XF, Chen GQ. 2018. Coal use embodied in globalized world economy: From source to sink through supply chain. Renew Sustain Energ Rev. 81:978–993.
- Xiao W, Fu Y, Wang T, Lv X. 2018. Effects of land use transitions due to underground coal mining on ecosystem services in high groundwater table areas: A case study in the Yanzhou coal field. Land Use Policy. 71:213–221.
- Xie H. 2015. Coal revolution is not ‘the life of revolutionary coal.’ China Science News.
- Xu A, Hu L, Shu H. 2011. Extension and implementation from spatial to spatiotemporal Kriging interpolation. J Comput Appl. 31(1):273–274.
- Xu Y, Jiang H, Zhang B, Al E. 2004. The design of the space structure about ecological land utilization on subsidence area of coal extraction in Xintai city. J Shandong Normal Univ. 19(4):1–21.
- Yang X, Jiao H, Xu J. 2015. A comparative study on the urban spatial structure evolution of different kinds of coal resource-based cities:taking Huainan and Huaibei as an example. J Nat Res. 30(1):92–105.
- Yuan Z, Zhou M. 2012. Collaborative development mechanism research on mines in transformation in resource-based city-with Huainan city as an example. Academics. 166(3):218–229.
- Zarco-Perello S, Simões N. 2017. Ordinary kriging vs inverse distance weighting: spatial interpolation of the sessile community of Madagascar reef, Gulf of Mexico. PeerJ. 5:e4078.
- Zhang YT, Wei CY, Xu YN, Yan J, Huang T, Yang XR, Li QM. 2018. An analysis of land use changes and driving forces in Ningdong coal base of Ningxia with remote sensing technology. Geolog Bullet China. 37(12):2169–2175.
- Zhou J, Wang L. 2014. Comprehensive study on ecological restoration and land exploitation of mining subsidence in suburbs of Chinese mining cities. Int J Coal Sci Technol. 1(2):248–252.
- Zhu L, Cheng J, Jin J, Al E. 2018. Space differentitaion patterns and influencing factors of “ecological-living-industrial” land use structure. Chin J Agric Res Region Plan. 39(8):105–115.
- Zou L, Liu Y, Wang Y. 2020. Research progress and prospect of land-use conflicts in China. Prog Geograp. 39(2):298–309.