
 ?Mathematical formulae have been encoded as MathML and are displayed in this HTML version using MathJax in order to improve their display. Uncheck the box to turn MathJax off. This feature requires Javascript. Click on a formula to zoom.
Abstract
Floods have become the most prevalent natural disaster in the world. Understanding the emotional impact of floods on people helps reduce negative mass incidents and contributes to the implementation of disaster prevention and mitigation. This study collected online discussions related to the great flood in the middle and lower reaches of the Yangtze River basin in China in 2020. Then, we obtained the sentiments of people and the deep thoughts behind their negative sentiment through the dictionary sentiment analysis and the LDA topic modeling, counting them according to the regions. The overall sentiment of Internet users during this flood was neutral, and the posts showing negative sentiment were mostly from the affected areas. People in the affected areas were highly concerned about personal safety and property, whose negative emotions were directed towards the flood prevention work and the relocation of affected people.
1. Introduction
From 2000 to 2019, the most frequent natural disaster around the globe was the flood, and China suffered the most from natural disasters (United Nations Office for Disaster Risk Reduction Citation2019). The Yangtze River is the longest river in China, with abundant precipitation in its basin. The mainstream flows through 11 provincial administrations, including Qinghai, Tibet, Sichuan, Yunnan, Chongqing, Hubei, Hunan, Jiangxi, Anhui, Jiangsu, and Shanghai. In addition to Qinghai and Tibet, which locate in the upper Yangtze River basin, others belong to the middle and lower Yangtze River basin. From June to August 2020, the heavy rainfall caused natural disasters in the middle and lower reaches, such as inundation and flash floods, affecting a total of 34.17 million people (Ministry of Emergency Management of the People's Republic of China Citation2021). From 11st to 17th July 2020, the nine provincial administrations of the middle and lower reaches of the Yangtze River basin heavily suffered from the flood (People's Daily Citation2020; China Meterological Administration Citation2021). Meanwhile, Poyang Lake, the largest freshwater lake in China, has exceeded the historical extreme of its water level in 1998 (Ministry of Emergency Management of the People's Republic of China Citation2021).
Social media has been widely used for the communication and dissemination of emergency information during natural disasters (Butt Citation2019; Said et al. Citation2019). Understanding the impact of natural disasters, especially the negative emotions triggered online, can contribute to the smooth implementation of disaster prevention and mitigation. Sun and Zhang (Citation2011) summarized the communication characteristics of the online public opinion in natural disasters and proposed strategies for the expression and guidance of the online public opinion based on the example of the 2011 East Japan earthquake and tsunami. Murthy and Longwell (Citation2013) analyzed the role of Twitter as a source of post-disaster information and communication platform in Pakistan Floods of 2010. Hassan et al. (Citation2019) collected images related to natural disasters from social media, analyzing the perceptions, attitudes, and sentiments of people towards these images. From the perspective of disaster information, this study examined the sentiments and opinions of the Chinese public on the 2020 flood through big data. Then, this study explored the concern of people in different regions to the flood through the geographical analysis of public opinion. Next, this paper compared the sentiments of people in different regions and discussed the emotional impact of the flood on people in different regions. Finally, this paper conducted a topic analysis of samples with negative sentiment, compared the differences between the content of negative sentiment directed by people in affected and non-effected areas in the 2020 flood and their concerned topics and demands. Also, this paper aimed to provide new perspectives for flood prevention and mitigation work (Cohn et al. Citation2000; Pang Citation2010; Xie et al. Citation2011).
2. Research method
2.1. Data collection
As the flood in the middle and lower reaches of the Yangtze River went severe from 11th to 17th July 2020, an explosion of discussion about the flood occurred on Sina Weibo. According to the characteristics of the sample distribution and the scale of the platform, this paper accessed the Sina Weibo API via a self-written python program to obtain the posts related to the keyword ‘the flood in the middle and lower reaches of the Yangtze River (Huang and Sun Citation2014; Zhu et al. Citation2021). The collected data were posted from 11th to 17th July 2020 and reached 142,854, containing information about the publisher, posting time, posting location, and content. Then, we removed adverting, repeated, topic-irrelevant, and unusual information, pure emojis, images, and videos, and finally gained a valid sample with 25,213 posts. Based on the valid data, we researched the following: (1) counting the locations of posts to conclude the geographical distribution of the flood-related posts; (2) conducting sentiment analysis of posts and matching with the posting locations to analyze the sentiments of people in different areas; (3) conducting topic analysis of texts with negative sentiment and matching with the locations of the posts to reveal the specific contents of the negative sentiment in different areas, and further exploring their demands and thoughts.
2.2. Sentiment analysis
This paper conducted the sentiment analysis with big data, which can avoid the errors caused by manual subjective evaluation. The methods of sentiment analysis with big data generally include sentiment dictionary and machine learning (Xu et al. Citation2008; Yadollahi et al. Citation2017). The sentiment dictionary is suitable for low granularity texts (texts with shorter lengths and sentences), with the advantages of speedy procedures and high accuracy (Liu and Liu Citation2012). This study employed the sentiment dictionary method for sentiment analysis because the sample posts were mostly short sentences or texts (Lan Citation2013). An applicable sentiment dictionary is necessary for identifying emotion words and clarifying emotions and sentiments. The Emotion ontology of Dalian University of Technology (DLUT-Emotion ontology) is the most widely used sentiment dictionary in Chinese sentiment analysis with over 85% evaluation accuracy, containing more than 30,000 emotion words (Shou et al. Citation2017; Zhang et al. Citation2018; Xu et al. Citation2019). According to the characteristics of the research sample and DLUT-Emotion ontology, this study classified the sample data into three sentiments: positive, neutral, and negative.
Specifically, we introduced DLUT-Emotion ontology firstly, which includes the list of emotion words, the part of speech of emotion words, the sentiments of words (positive, neutral, and negative), and the intensity of emotions. Secondly, we referred to the internal structure of the DLUT-Emotion ontology and constructed a secondary dictionary based on flood-related words from Wikipedia to improve the accuracy of evaluating emotion words. shows the example of emotion words with sentiments listed in the DLUT-Emotion ontology and the secondary dictionary. Thirdly, we wrote a program to split the samples into words and matched the sample words with two emotion dictionaries. The program counted the number of sentimental words (positive, neutral, and negative) and the intensity of emotions in each data to identify the sentiment. Lastly, we output the sentiment analysis results when the accuracy reached 85%. Here is an example of how we determined the sentiment of the data: sample 1 is a post of ‘Torrential rain has caused a flood crisis in Poyang Lake, 70,000 affected people need an urgent evacuation’. Sample 1 contained negative emotions words ‘torrential rain’, ‘urgent’, and ‘affected’, with strong intensity, and sample 1 was defined as negative.
Table 1. The example of emotion words with sentiments.
2.3. Topic analysis
To improve efficiency and accuracy, this study adopted topic modeling to extract the main topics of texts with negative sentiment, using the tool of Latent Dirichlet Allocation (LDA) (Jelodar et al. Citation2019; Wang et al. Citation2020). Blei et al. (Citation2003) originally proposed LDA, an unsupervised machine learning approach to text mining, and extracts potential topics from texts. LDA considers documents and words interchangeable, ignoring the order of the words in the documents and the order of the documents in the corpus (Blei et al. Citation2003; Ferner et al. Citation2020). It has proven performance in social media content mining, especially for topic extraction of short texts like Sina Weibo posts (Lan Citation2013; Wang et al. Citation2020; Yang et al. Citation2021). LDA generally sliced the sample into words and divided the words into groups based on word frequency and relationships between words (Blei et al. Citation2003; Xue et al. Citation2020). Researchers need to summarize the topics represented by the keywords in each group (Blei et al. Citation2003; Eichstaedt et al. Citation2018; Xue et al. Citation2020). Specifically to the operation, we wrote the program, modeling the texts through LDA. Step 2 is varying the number of output topics and training the dataset until the keyword groups are well differentiated. Step 3 is extracting the topics according to the output keywords.
3. Analysis of results
3.1. The heat of public discussion
The 2020 flood in China mainly affected the middle and lower reaches of the Yangtze River. To compare the public opinion raised by the flood in different regions, we sort these Weibo texts according to the regions where the posters were and obtain micro-blogs regional distribution in 34 provinces (including Hong Kong, Macao, and Taiwan). We used ArcGIS, a geographic information system (GIS) software, to draw a visual map reflecting the distribution of microblogs in 34 provinces of China.
indicated that Jiangxi Province released the most posts, reaching 3,140. In this flood, the water level of Poyang Lake in Jiangxi Province broke its historical extreme and directly affected the people in the northern part of Jiangxi. Posts from Beijing ranked second, with 2,535 posts. While Guangdong, Jiangsu, and Shanghai all topped over 1,500. And other regions like Shandong Province, Henan Province, Anhui Province, Chongqing City, Fujian Province, Hunan Province, Hebei Province, Shaanxi Province, Liaoning Province exceeded 500.
Figure 1. Geographic heat map of Sina Weibo flood-related posts.
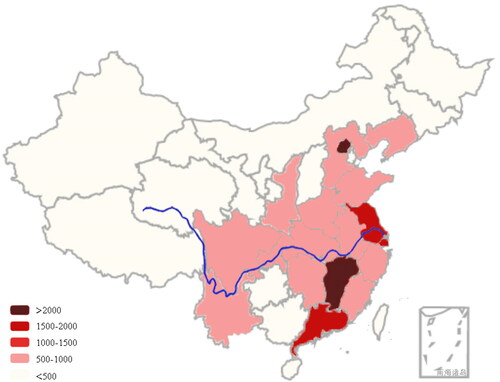
The online public opinion about the flood was mainly distributed in Eastern China and the Yangtze River Basin regions. Eastern China is composed of 11 provincial-level administrative regions: Beijing, Hebei, Tianjin, Shandong, Jiangsu, Shanghai, Zhejiang, Fujian, Guangdong, Hainan, Taiwan, Hong Kong, Macau, etc. . With its robust economy and large population, eastern China has always been home to hot debates on various social events (Zhou et al. Citation2019). It can explain why the discussion about the flood was mainly in East China, which presented a darker color on the map.
Nine affected regions located in the middle and lower reaches of the Yangtze River Basin regions, which are Sichuan, Chongqing, Hubei, Hunan, Jiangxi, Anhui, Jiangsu, and Shanghai, showed higher discussion heat than non-affected regions, presenting darker colors on the map. As the flood directly impacted work and life, people from the nine affected regions were more concerned about the flood than that of non-affected regions. According to statistics, the number of Weibo in the disaster area is 13,871, more than 11,342 in the non-disaster area.
3.2. The public sentiments
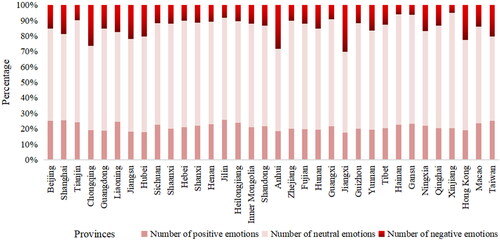
The method of sentimental dictionary-based analysis was applied to deal with all effective microblogs from Weibo. 20.95% (N = 5282) of them were defined as positive tendencies, 15.32% (N = 3863) as negative, and others neutral (63.73%, N = 16 068). Of the 3863 negative emotions on Weibo, 2593 came from disaster areas, 18.69% of the people in disaster areas showed negative emotions, and 1270 from non-disaster areas, only 11.20% of people in non-disaster areas had negative emotions.
In this research, all microblogs were classified into 34 groups in line with different provinces before being accounted for and calculated as percentages of the total(presented as ). After attaching
with unique labels of every province, we summarize and divide them into 3 groups according to their tendencies:
(positive sentiment),
(neutral sentiment),
(negative sentiment). The percentages of positive sentiment from 34 regions were marked by
(
), and
worked the same way with
and
Standard deviations of
and
were:
=2.32,
=5.41,
=5.95 (Tukey Citation1949; Scheffe Citation1999; Scott et al. Citation2020). As the bar chart () represented below, a relatively small gap in positive sentiment among provinces can be seen.
was around a range of 19%–22%, which was close to the national average. In contrast, neutral sentiment took a proportion of over 60%, and there is a significant difference among 34 regions.
also holds a huge wave among different regions and negative sentiment in Jiangxi Province reaches the highest of 30.09%. Among the six regions with the highest proportion of negative sentiment, five were located in the middle and lower reaches of the Yangtze River, which are Jiangxi, Anhui, Chongqing, Jiangsu, and Hubei. The values of in the five regions were all over 20%, well above the national average, and that of all regions in the middle and lower reaches of the Yangtze River were over 11.65%.
Figure 2. The proportions of text with three sentiments in different regions.
3.3. The topic modeling
As mentioned above, compared with non-affected areas, affected areas (regions located in the middle and lower reaches of the Yangtze River) showed higher discussion heat about the flood, with higher negative sentiment. To explore the specific connotations behind the negative sentiment of people, this study divided the texts with negative sentiments (3,863 posts) into groups of affected and non-affected regions. The group of affected regions contained 2,593 posts from nine regions located in the middle and lower reaches of the Yangtze River, and the other group included 1,270 posts from 25 non-affected regions. This study carried out the LDA topic modeling of the two groups separately and compared the topic contents of the two groups. The number of samples in the two groups is similar, but the affected group has stronger negative sentiment and more samples than the non-affected group. We achieved the best topic classification through the model training and parameter comparison when the two groups were represented by five topics each (Xie et al. Citation2020; Zhou et al. Citation2021).
displays the extracted topics based on the output keywords. The last three topic keywords of the affected regions and non-affected regions are almost identical and can be regarded as the same topic. That is, the two groups contained three similar topics and four unique topics. The five topics contained in the negative sentiment of people in affected regions are 1-1 Resettlement of people, 1-2 Flood control deployment, 1-3 Official rescue work, 1-4 Flood warning information, and 1-5 Update of the dam. The topics of a negative sentiment of people in non-affected regions are 2-1 News releases, 2-2 Water level information, 2-3 Official rescue work, 2-4 Flood warning information, and 2-5 Update of the dam.
Table 2. LDA analysis of texts with negative sentiment in affected and non-affected regions.
4. Discussion
4.1. The sentiment of Weibo posts towards the post-disaster response
Most related microblogs were neutral emotional tendencies from the sentiment analysis perspective, and these microblogs were more positive than negative. Generally, netizens on Weibo reacted more positively towards Poyang Lake's water level exceeding historical extremes. On the one hand, the text data of Weibo was collected from the whole of China, which covers non-disaster areas. So, there may be a distinct difference in netizen's emotional response after the disaster. On the other hand, proactive emergency measures are taken by relevant departments support from other provinces, timely transferring, and appropriate resettlement should all be taken into account (Cheng Citation2020).
4.2. Relatively negative sentiment of people in affected regions
The regions in the middle and lower reaches of the Yangtze River basin showed the highest level of public discussion on the flood. There was a certain coincidence between the geographic distribution of public discussion and the flood. About 15.32% of all selected posts were defined as negative sentiment, and posts from nine affected regions accounted for 67.12% of the negative posts, exceeding the sum of the other 25 non-affected regions. 18.69% of Weibo in disaster areas had negative emotion, much higher than 11.20% in non-disaster areas. Besides, five of the six regions with the highest proportion of negative sentiment are all located in the middle and lower reaches of the Yangtze River. All aspects show that Netizens from affected areas are more negative than those from non-disaster areas as a whole. So it is particularly significant to give good instruction to people's negative emotions in the disaster area (Karmegam and Mappillairaju Citation2020).
4.3. Common concerns existing among people in different regions
The negative sentiments of affected and non-affected regions were directed towards official rescue work, flood warning information, and the update of the dam. The timeliness of official rescue, the obstacles encountered in the rescue process, the alerts of the rising water level, the weather warning information, and the overflow of the dam contributed to the negative sentiment from people in affected and non-affected regions. The information sources of official rescue, flood warning, and updates of the dam mainly were the Sina Weibo accounts of authoritative media, which had a large number of followers and wide influence. Information released by these media accounts spread instantly and massively, thus triggering common concerns among people in the affected and non-affected regions (Stieglitz and Dang-Xuan Citation2013; Ferrara and Yang Citation2015).
4.4. Affected regions concern more about resettlement and flood control
Information about the resettlement of people and the deployment of flood control have triggered negative sentiments among affected people. Local governments, armed police, firefighters, PLA, and grassroots cadres were involved in transferring, evacuating, and resettling affected people. They also started the flood control work, such as reinforcing embankments and adding sandbags, which were positive measures to prevent and mitigate the flood. However, a few regions did not organize well, causing a negative sentiment. The selected samples indicated that due to a lack of supporting workers in some places, the resettlement was processed slowly, which resulted in some people being trapped. Some resettlement in villages was too basic, causing discontent among the local people. Some dams have fallen into disrepair with gaps even breaches, leading to casualties and property loss. Although these were individual cases, once they were spread through social media, they triggered strong empathy and fostered negative sentiment among the affected people (Schipper and Petermann Citation2013).
4.5. Different benefit pursuit of people reflected by sentiments and topics
People in non-affected regions sough the updated information about the flood, including the official rescue work, the flood warning, the update of the dam, and the information of water levels. Some of them expressed their expectations for local governments and authoritative media to release information on the situation of the affected regions. Specifically, they hoped the local governments disclosed the number of affected people and the water level in a timely manner, and the media increased their frequency of live broadcasts and news reports. People in affected regions were more concerned about their safety and property interests. They hoped the relevant authorities to carry out the resettlement work in time, prepare for the flood control measurements, and care about the aftercare work, protecting their home, furniture, livestock, crops, and other property from being destroyed by the flood.
5. Conclusion
Disaster science research has been highly concerned about preventing disasters, protecting the personal safety of the affected people, and reducing property losses (Ogie and Verstaevel Citation2020). Today, information can be transmitted in real-time, which brings great convenience to people. However, some negative information has undoubtedly brought unnecessary panic to some people in disasters (Carroll et al. Citation2009; Yusoff and Yusoff Citation2021). This study examined the differences in the sentiments and connotations of the flood between people in affected and non-affected regions during the major flood in the middle and lower reaches of the Yangtze River. This paper provided suggestions for flood prevention and mitigation work. The findings indicated that people in affected regions cared more about the flood than people in non-affected regions. Also, people in affected regions have stronger negative sentiments and showed more concerns about resettlement and flood mitigation work. Besides, they expressed demands in terms of personal safety and property interests. From the perspective of this study, negative emotions destroy the psychological environment of people in disaster areas. It suggests that the government should improve the ability to rescue and deal with the negative emotions of victims in disasters. On this occasion, the government can prevent the adverse social events caused by panic and successfully carry out the rescue operation.
This study employed machine analysis for the public discussion heat, sentiment, and topic analysis, avoiding the interference and errors of manual evaluation. The research sample size is adequate and derived from the most severe flooding week in the middle and lower reaches of the Yangtze River basin. However, this study has some limitations in that the time span of the selected sample is only one week. A comprehensive analysis of online public opinion related to the 2020 flood can be achieved if the sample could grasp data within two months. Considering the large sample size and time span, the focus of the discussion is difficult to reach, and the operationalization is hard, we will seek a breakthrough in further study.
Disclosure statement
No potential conflict of interest was reported by the authors.
Data availability statement
The data that support the findings of this study are available from the corresponding author, Hao Gao, upon reasonable request.
Additional information
Funding
References
- Blei DM, Ng AY, Jordan MI. 2003. Latent dirichlet allocation. J Mach Learn Res. 3:993–1022.
- Butt TA. 2019. Context‐aware cognitive disaster management using fog‐based internet of things. Trans Emerging Tel Tech. e3646.
- Carroll B, Morbey H, Balogh R, Araoz G. 2009. Flooded homes, broken bonds, the meaning of home, psychological processes and their impact on psychological health in a disaster. Health Place. 15(2):540–547.
- Cheng X. 2020. Flood risk and flood management policies in China. In: Annual Report on China's Response to Climate Change; 2017; Singapore: Springer. p. 49–65.
- China Meterological Administration. 2021. China climate bulletin 2020. China Meterological Administration; [accessed 2021 Feb 9]. http://www.cma.gov.cn/2011xwzx/2011xqxxw/2011xqxyw/202102/t20210209_571871.html.
- Cohn R, Carley KM, Harrald JR, Wallace WA. 2000. Emotions in crisis management: an analysis of the organisational response of two natural disasters. IJTM. 19(3/4/5):313–335.
- Eichstaedt JC, Smith RJ, Merchant RM, Ungar LH, Crutchley P, Preoţiuc-Pietro D, Asch DA, Schwartz HA. 2018. Facebook language predicts depression in medical records. Proc Natl Acad Sci U S A. 115(44):11203–11208.
- Ferner C, Havas C, Birnbacher E, Wegenkittl S, Resch B. 2020. Automated seeded latent Dirichlet allocation for social media based event detection and mapping. Inform. 11(8):376.
- Ferrara E, Yang Z. 2015. Measuring emotional contagion in social media. PloS One. 10(11):e0142390.
- Hassan SZ, Ahmad K, Al-Fuqaha A, Conci N. 2019. Sentiment analysis from images of natural disasters. In: International conference on image analysis and processing. Cham: Springer; p. 104–113.
- Huang R, Sun X. 2014. Weibo network, information diffusion and implications for collective action in China. Inform Commun Soc. 17(1):86–104.
- Jelodar H, Wang Y, Yuan C, Feng X, Jiang X, Li Y, Zhao L. 2019. Latent Dirichlet allocation (LDA) and topic modeling: models, applications, a survey. Multimed Tools Appl. 78(11):15169–15211.
- Karmegam D, Mappillairaju B. 2020. Spatio-temporal distribution of negative emotions on Twitter during floods in Chennai, India, in 2015: a post hoc analysis. Int J Health Geog. 19:1–13.
- Lan YX. 2013. Research on the model of public opinion diffusion law of emergency Weibo. Inform Sci. 3:31–34.
- Liu ZM, Liu L. 2012. An empirical study on emotion classification of Chinese Weibo based on machine learning. Comput Eng Appl. 48 (1):1–4.
- Ministry of Emergency Management of the People's Republic of China. 2021. The Ministry of Emergency Management announced the top 10 natural disasters in China for 2020. Ministry of Emergency Management of the people's Republic of China; [accessed 2021 Jan 2]. https://www.mem.gov.cn/xw/yjglbgzdt/202101/t20210102_376288.shtml.
- Murthy D, Longwell SA. 2013. Twitter and disasters: the uses of twitter during the 2010 Pakistan floods. Inf Commun Soc. 16(6):837–855.
- Ogie RI, Verstaevel N. 2020. Disaster informatics: an overview. Prog Disaster Sci. 7:100111.
- Pang A. 2010. Future directions of crisis communication research: emotions in crisis–the next frontier. [accessed 2010 Feb 1]. https://ink.library.smu.edu.sg/cgi/viewcontent.cgi?article=7036&context=lkcsb_research.
- People's Daily. 2020. Do a good job in flood control in the south and strengthen flood preparation in the north. [accessed 2020 Jul 14]. http://society.people.com.cn/n1/2020/0714/c1008-31781835.html.
- Said N, Ahmad K, Riegler M, Pogorelov K, Hassan L, Ahmad N, Conci N. 2019. Natural disasters detection in social media and satellite imagery: a survey. Multimed Tools Appl. 78(22):31267–31302.
- Scheffe H. 1999. The analysis of variance. Vol. 72. New York:John Wiley & Sons.
- Schipper M, Petermann F. 2013. Relating empathy and emotion regulation: do deficits in empathy trigger emotion dysregulation? Soc Neurosci. 8(1):101–107.
- Scott SB, Sliwinski MJ, Zawadzki M, Stawski RS, Kim J, Marcusson-Clavertz D, Lanza ST, Conroy DE, Buxton O, Almeida DM, et al. 2020. A coordinated analysis of variance in affect in daily life. Assessment. 27(8):1683–1698.
- Shou HR, Deng SQ, Xu J. 2017. Internet rumor recognition method based on emotion analysis. Data Anal Knowl Disc. 1(07):44–51.
- Stieglitz S, Dang-Xuan L. 2013. Emotions and information diffusion in social media – sentiment of microblogs and sharing behavior. J Manage Inform Syst. 29(4):217–248.
- Sun W, Zhang XL. 2011. The expression and guidance of network public opinion in sudden natural disasters: taking the earthquake and tsunami in eastern Japan as an example. Acad Explor. 06:115–118.
- Tukey JW. 1949. Comparing individual means in the analysis of variance. Biometrics. 5(2):99–114.
- United Nations Office for Disaster Risk Reduction. 2019. The cost of disasters to humanity: an overview of the past 20 years (2000–2019). United Nations Office for Disaster Risk Reduction; [accessed 2020 Oct 12]. https://www.under.org/news/drrday-un-report-charts-huge-rise-climate-disasters.
- Wang J, Zhou Y, Zhang W, Evans R, Zhu C. 2020. Concerns expressed by Chinese social media users during the COVID-19 pandemic: content analysis of Sina Weibo microblogging data. J Med Internet Res. 22(11):e22152.
- Wang Y, Wu D, Yuan X. 2020. LDA-based deep transfer learning for fault diagnosis in industrial chemical processes. Comput Chem Eng. 140:106964.
- Xie Q, Zhang X, Ding Y, Song M. 2020. Monolingual and multilingual topic analysis using LDA and BERT embeddings. J Informetr. 14(3):101055.
- Xie XF, Wang M, Zhang RG, Li J, Yu QY. 2011. The role of emotions in risk communication. Risk Anal. 31(3):450–465.
- Xu G, Yu Z, Yao H, Li F, Meng Y, Wu X. 2019. Chinese text sentiment analysis based on extended sentiment dictionary. IEEE Access. 7:43749–43762.
- Xu LH, Lin HF, Zhao J. 2008. Construction and analysis of affective corpus. Chin Inform J. 01:116–122.9.
- Xue J, Chen J, Chen C, Zheng C, Li S, Zhu T. 2020. Public discourse and sentiment during the COVID 19 pandemic: using latent Dirichlet allocation for topic modeling on Twitter. PloS One. 15(9):e0239441.
- Xue J, Chen J, Hu R, Chen C, Zheng C, Su Y, Zhu T. 2020. Twitter discussions and emotions about the COVID-19 pandemic: machine learning approach. J Med Internet Res. 22(11):e20550.
- Yadollahi A, Shahraki AG, Zaiane OR. 2017. Current state of text sentiment analysis from opinion to emotion mining. ACM Comput Surv. 50(2):1–33.
- Yang Y, Hsu JH, Löfgren K, Cho W. 2021. Cross-platform comparison of framed topics in Twitter and Weibo: machine learning approaches to social media text mining. Soc Netw Anal Min. 11(1):1–18.
- Yusoff S, Yusoff NH. 2021. Building social resilience after the 2014 flood disaster. Pertanika J Soc Sci Hum. 29(3):1–14
- Zhang S, Wei Z, Wang Y, Liao T. 2018. Sentiment analysis of Chinese micro-blog text based on extended sentiment dictionary. Future Gener Comp Syst. 81:395–403.
- Zhou X, Song Y, Jiang H, Wang Q, Qu Z, Zhou X, Jit M, Hou Z, Lin L. 2021. Comparison of public responses to containment measures during the initial outbreak and resurgence of COVID-19 in China: infodemiology study. J Med Internet Res. 23(4):e26518.
- Zhou Y, Tian XL, Zhong MH. 2019. Public opinion analysis of Notre Dame fire based on Weibo Crawler. J Wuhan Univ Technol. 41(05):461–466.
- Zhu Y, Li X, Wang J. 2021. Analysis and research of Weibo public opinion based on text. 5th International Conference on Computer Science and Information Engineering; Vol. 1769; No. (1); p. 012018.