
 ?Mathematical formulae have been encoded as MathML and are displayed in this HTML version using MathJax in order to improve their display. Uncheck the box to turn MathJax off. This feature requires Javascript. Click on a formula to zoom.
Abstract
With climate change and urbanization, the rainstorm disaster has become one of the major climate risks in constructing the Guangdong–Hong Kong–Macao Greater Bay Area (GBA). Based on daily precipitation, socio-economic data and a comprehensive evaluation method, the characteristics and risks of rainstorm disaster in the GBA at county level are investigated in this paper. Considering the hazard, vulnerability and exposure, the risks of rainstorm disasters are high (Level 3) and very high (Level 4) in Zhuhai, Zhongshan, Dongguan, Jiangmen and Shenzhen. From 1990 to 2018, the frequency and intensity of rainstorms in the GBA have increased by 10 times and 2 mm per decade, respectively. Moreover, the population, gross domestic product, and built-up areas have increased significantly in the GBA, while the vegetation coverage has decreased. The combination of these changes results in an increase in the frequency of rainstorm disasters by two times from 2005 to 2018 compared with that from 1990 to 2004. The findings of this study can provide a positive reference for local governments to improve the pertinence of the strategies for rainstorm disaster prevention and mitigation.
1. Introduction
In recent years, climate change has resulted in frequent extreme rainstorm events in coastal cities (IPCC Citation2014; Canters et al. Citation2014; Silva et al. Citation2017), which has seriously restricted the comprehensive, coordinated and sustainable development of the economy and society (Zhou et al. Citation2017; Demirdjian et al. Citation2018; Kang et al. Citation2018; Lyu et al. Citation2018). At the same time, land cover change, sea level rise, inadequate drainage facilities and emergency management furtherly exacerbate the vulnerability of rainstorm disasters in coastal cities (Reguero et al. Citation2015; Vousdoukas et al. Citation2018; Islam and Raja Citation2021). For example, from 2001 to 2018, rainstorm disasters affected more than 40 million people and caused more than $10 billion in economic losses each year in urban areas of eastern China (Sun et al. Citation2020).
Rainstorm disasters cover flood and waterlogging caused by excessive precipitation. The rainstorm disaster risk refers to the expected losses of human property and socioeconomic development caused by the flood and waterlogging (Li et al. Citation2020) and it is determined by the hazard, as well as the exposure and vulnerability (Cardona et al. Citation2012; Ahmad and Simonovic Citation2013; Kim and Marcouiller Citation2017; UNDRR 2019; Islam and Raja 2021). Recently, Scholars have made significant achievements in rainstorm disaster risk assessment in China (Zhou et al. Citation2019). For example, Sun et al. (Citation2020) revealed the spatial pattern of waterlogging risk in 89 cities of eastern China by comprehensive analyses on extreme rainfall, exposure and urban adaptability. Ma et al. (Citation2021) established an assessment index system based on urban vulnerability, adaptability and resilience to achieve multi-regional quantitative assessment of urban rainstorm and flood disasters in China. Moreover, some studies investigated the vulnerability and risks of flood disasters in a single city. For instance, Quan et al. (Citation2014) indicated that the water depth, vulnerability, and economic losses in Shanghai tend to increase as the rainstorm intensity increases based on hydrological modeling and a geographic information system. Hu (Citation2016) used a genetic programming algorithm to accomplish the risk zoning of rainstorm flood disasters in Beijing, and revealed that the risk values are higher in urban areas.
Guangdong–Hong Kong–Macao Greater Bay Area (GBA), as one of three megacity clusters in China, is located in the lower reaches of the Pearl River Basin and the central coastal region of Guangdong Province. In the context of global warming and urbanization, extreme precipitation and heavy precipitation days in the Pearl River Basin showed increasing trends since 1960 (Zhao et al. Citation2014; Liu et al. Citation2016). Since 1990, the frequency of regional heavy rainstorm processes in Guangdong has significantly increased by 0.21 times per decade (Wu et al. Citation2019). During 1961–2019, the number of heavy (daily precipitation ≥ 25 mm) and very heavy (daily precipitation ≥ 50 mm) precipitation days, the extreme precipitation amount, maximum 1-day precipitation amount and maximum 5-day precipitation amount have increased by 0.6 days·10a−1, 0.2 days·10a−1, 12.5 mm·10a−1, 0.7 mm·10a−1 and 3.5 mm·10a−1, respectively in GBA (Wang et al. Citation2021a). During 2010–2018, extreme precipitation in Guangdong caused a total direct economic loss of 49 billion yuan (Zhang et al. Citation2021). For example, the areal precipitation of 479.2 mm from June 12 to 24, 2005 caused a 100-year-return-period flood disaster in the West River and North River of the Pearl River Basin, which affected 4.4 million people, causing the deaths of 65 people and direct economic losses of 5 billion yuan in Guangdong (Guangdong Meteorological Service Citation2006).
Moreover, rapid population growth, unplanned urbanization, and climate extremes are the major triggering factors making rainstorm waterlogging disasters more frequent in recent years in the GBA (Xiao et al. Citation2013; Chen et al. Citation2015). Since China’s reform and opening-up in 1978, the GBA has experienced remarkable urbanization, resulting in a dramatic change in land use from vegetative cover to construction land (Yang et al. Citation2019). The urban impervious area in the GBA has increased from 12,129 km2 in 2006 to 20,189 km2 in 2016, with an annual growth rate of 6.65% (Feng and Fan 2018). Currently, urban rainstorm waterlogging has become an ‘urban agglomeration disease’ that must be mitigated by local government and urban agglomeration planning agencies in the planning and construction stages of the GBA (Liu et al. Citation2016). For example, the 3-h precipitation with 586 mm broke historical record in Zengcheng District of Guangzhou on May 7, 2017, resulting in 6 deaths as well as 118 spots of central city zone and 1,409 vehicles flooded. In this disaster, the direct economic loss was about 540 million yuan (Zhang et al. Citation2019).
Recently, several scholars investigated the vulnerability and risks of flood disasters in the Pearl River Delta (Yang et al. Citation2015; Wang et al. Citation2017; Zhang et al. Citation2019) or in a single city of the GBA such as Guangzhou (Li et al. 2014; Chen et al. Citation2015) and Shenzhen (Zhou et al. Citation2017). Li et al. (Citation2019) coupled hydrological and hydrodynamic models to simulate and assess risk and sensitivity of flash floods in a mountainous river basin of South China. Lin et al. (Citation2020) improved analytic hierarchy process method and integrated maximum likelihood clustering algorithm to assess the flash flood risk in Guangdong province. Liu et al. (Citation2016) applied the kernel density estimation and the spatial autocorrelation analysis to reveal the driving factors for rainstorm waterlogging in the GBA during 2013–2017. It is found that all of the driving factors enhance the impacts on rainstorm waterlogging through their interactions. Although there have been a lot of studies on rainstorm disasters risk assessment, there are still some research problems to be addressed. For instance, how to construct a comprehensive or systematic risk index to make the index reasonable? Are there any spatial differences in various driving factors of rainstorm disasters in the GBA? At county level, where are the areas with high risks of rainstorm disasters in the GBA?
Based on the above reasons, it is of great practical significance to analyze rainstorm disaster risks to reduce the disaster losses in the GBA. In this paper, we select 48 counties of the GBA as evaluation objects and proposed a comprehensive index for rainstorm disasters. This study aims to obtain a risk map at county level in the GBA. The risk assessment and zoning of rainstorm disasters can provide a scientific reference for mitigation measures and risk management strategies in the GBA, and also serves as a method reference for those well-developed regions in the world.
2. Study area
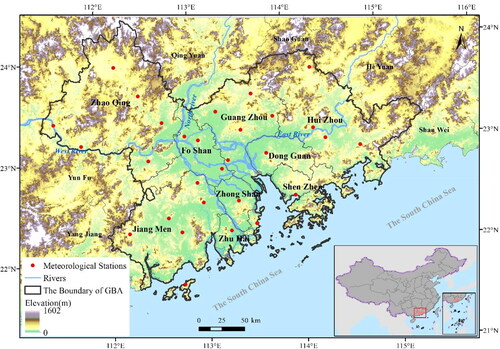
Located near the Pearl River Estuary, the GBA is surrounded by the South China Sea to the south and by mountains on other three sides, with a long coastline and complex natural geographical conditions. The terrains of the GBA are high in the north and low in the south. The central-southern GBA is mainly featured by alluvial plains, where the major cities of the GBA are located. The GBA is composed of two Special Administrative Regions (Hong Kong and Macao) and 9 cities (Guangzhou, Foshan, Zhaoqing, Shenzhen, Dongguan, Huizhou, Zhuhai, Zhongshan and Jiangmen) including 48 districts and counties, as shown in . It covers an area of 56,000 km2 and has a population of more than 70 million. The drainage network in the GBA includes the three main tributaries of the Pearl River, namely, West River, North River and East River.
Figure 1. Terrains, river system, cities and meteorological stations in the GBA.
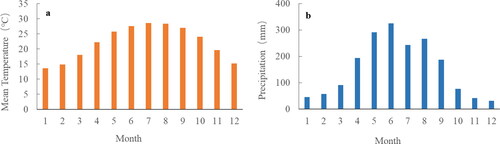
The GBA is located at a subtropical monsoon climate region, with the annual temperature averaged during 1981–2010 being 22.2 °C, the monthly temperature being highest in July (28.7 °C) and lowest being in January (13.9 °C), as shown in . In addition, the average annual precipitation in the GBA is 1874 mm, but the precipitation is unevenly distributed among different seasons, with less precipitation in winter and more precipitation in summer. Due to favorable configuration of water vapor, heat and dynamic conditions, this region has a long rainy season when rainstorms with strong intensity frequently occur, which causes severe disasters that affect widespread areas (Zhou et al. Citation2019).
Figure 2. Monthly mean temperature (a) and precipitation (b) in the GBA from 1981 to 2020.
3. Data and method
3.1. Data
The daily precipitation data during 1990–2018 is from 29 meteorological stations in the GBA of the Chinese mainland. It is derived from the National Meteorological Information Centre of China Meteorological Administration (CMA), which is subjected to strict data quality control (Ren et al. Citation2012). In the classification of meteorological disasters by the CMA, disasters caused by typhoon-induced rainstorms are categorized as typhoon disasters. Therefore, the rainstorm disasters investigated in this study are those caused by non-typhoon related rainstorms (hereinafter referred to as the rainstorm disaster).
The digital elevation model (DEM) data and river data with a spatial resolution of 1 km × 1 km used in this study paper are derived from the terrain database at a scale of 1:250,000 from the National Geomatics Center of China (Wang et al. Citation2001). The 1-km land use data is from the Institute of Geographic Sciences and Natural Resources Research, Chinese Academy of Sciences (Xu et al. Citation2018), and the vegetation coverage data is calculated based on the Normalized Difference Vegetation Index (NDVI) product (1-km resolution) from the Moderate Resolution Imaging Spectroradiometer (MODIS) (Didan Citation2015). The population and gross domestic product (GDP) data with a spatial resolution of 1 km × 1 km in the GBA are from the Resources and Environmental Science and Data Center, Chinese Academy of Sciences (http://www.resdc.cn/Default.aspx).
3.2. Methods
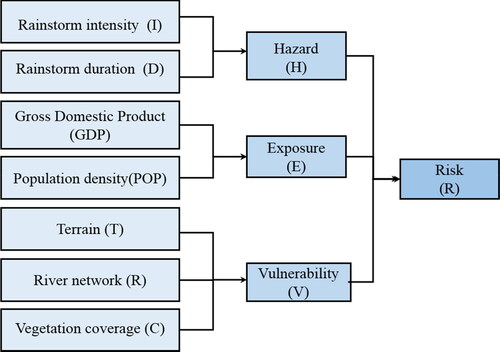
The rainstorm disaster risk index consists of three indexes, namely, the hazard index (), the exposure index (
) and the vulnerability index (
), as shown in EquationEq. (1)
(1)
(1) (Cardona et al. Citation2012):
(1)
(1)
By utilizing the hazard, exposure, and vulnerability assessments, a rainstorm disaster risk map is developed for the GBA at the county level for the first time. The schematic diagram of components for assessing rainstorm disaster risk is presented in . The detailed methods for hazard, exposure, vulnerability and risk index are described in the following sections.
Figure 3. Schematic diagram of components for assessing the risks of rainstorm disasters.
In order to make the scales of different indexes comparable, the normalization method of all elements in this study is as follows (EquationEq. 2(2)
(2) ) (NCC 2009).
(2)
(2)
where
denotes the normalized value of the
th element,
the
th element value,
the minimum of the
th element, and
the maximum of the
th element.
3.2.1. Hazard index
The hazard of rainstorm disasters is mainly determined by the intensity and frequency of rainstorms. Generally, the greater the intensity and the higher the frequency, the more the losses caused by rainstorm disasters. According to the Grade of precipitation issued by the CMA (GB/T 28592-2012), the day with the daily precipitation amount greater than or equal to 50 mm at a meteorological observation station is regarded as a rainstorm day. In addition, if the number of consecutive rainstorm days recorded at a single station is greater than or equal to one day, or there is no more than one day with the precipitation amount reaching the moderate rain level (≥10 mm and <50 mm) between two rainstorm days, it is recorded as a rainstorm process. The hazard index () of rainstorm disasters reflects the danger level of a rainstorm process. There are some other hazard indexes for rainstorm processes (Ren et al. Citation2012; Ye et al. Citation2019), but they are quite similar. In this study, the hazard index is calculated by EquationEq. (3)
(3)
(3) (Ye et al. Citation2019).
(3)
(3)
where I denotes the intensity of a rainstorm process, which is expressed by the average daily precipitation during the rainstorm process; D represents the duration of a rainstorm process, which is expressed by the number of days that the rainstorm process lasts.
Based on comprehensive consideration of the study period (∼30 years) and the uncertainty in return period calculation, the hazard index value of 20-year return period is selected to represent the danger level of rainstorm disasters (Kharin et al. Citation2013; Sillmann et al. Citation2013), which is estimated through the generalized extreme value distribution.
3.2.2. Exposure index
Many existing researches adopt the population density or per unit of GDP as the exposure indicator, especially for grid-based risk assessments (Wu et al. Citation2011; Li et al. Citation2021). In this research, both the two indicators of per unit of population and GDP at 1-km grid spacing in the GBA are used to establish the socio-economic exposure index (), which is calculated with equal weight after normalization, as shown in Eq. (4) (Sun et al. Citation2020).
(4)
(4)
where POP denotes the population data per square kilometer.
3.2.3. Vulnerability index
There are significant differences in the understanding and definition of vulnerability among scholars, and most of them believe that the vulnerability is a combination of natural and human factors (Cardona et al. Citation2012). In this study, the vulnerability refers to the sensitivity of geographical environment to rainstorm disaster (NCC 2009). For rainstorm with the same intensity, the higher the sensitivity of disaster–pregnant environment, the more the losses caused by rainstorm disasters. Numerous researches have indicated that terrain, land cover/land use, river network density, infrastructure, and drainage pipeline density are natural factors driving the frequent occurrence of rainstorm disaster (Sun et al. Citation2020; Islam and Raja Citation2021; Li et al. Citation2021; Wang et al. Citation2021b). Here, we adopt the terrain (T), river network (R) and vegetation coverage (C) to characterize the integrated vulnerability of rainstorm disaster–pregnant environment. The terrain and drainage network are positive contributors to increase rainstorm disaster vulnerability, while the vegetation coverage is a negative contributor. Considering different contributions of the three indicators to the sensitivity of rainstorm disaster–pregnant environment, the weighting coefficients for
and
are respectively set as 40, 30, and 30% based on the expert scoring method. The expert scoring method is mainly based on the results of questionnaires to determine the weight of each evaluation index through the hundred-mark system (He et al. Citation2008). Note that in this study, 10 questionnaires are collected from experts with abundant knowledge and practical experiences.
The vulnerability index (V) can be calculated by Eq. (5) (NCC 2009).
(5)
(5)
3.2.3.1. Terrain
Elevation and slope are considered to be two influencing factors for rainstorm disasters (Meraj et al. Citation2015; Bui et al. Citation2016). In general, rainstorm disasters tend to occur in regions with relatively lower elevations and flatter slopes. Therefore, in this study, the two topography factors of the absolute elevation and slope are selected to represent the terrain characteristics. Slope is expressed by the standard deviation of elevation with a grid spacing of 1 km. The terrain index (T) is assigned according to different combinations of the absolute elevation and the standard deviation of elevation graded by experts. The lower the elevation and the smaller standard deviation of elevation, the greater the T and the more sensitive the rainstorm disasters. The specific assignment scheme is shown in , which refers to the technical specification for risk zoning of rainstorm and flood disaster (NCC 2009).
Table 1. Terrain factor assignment.
3.2.3.2. River network
River density and distances from waterbodies are common factors charactering the drainage network (Liu et al. Citation2019; Sun et al. Citation2020). The places with greater drainage density and closer to rivers, lakes, and large reservoirs are at a higher risk of rainstorm disasters. A local standard in Zhejiang, i.e., the Assessment technical specification for the risk level of rainstorm processes (DB33/T 2025-2017), specifies that the total length of the rivers within 1 km × 1 km is adopted as the drainage density of the central grid point, and the distances to water bodies can be obtained by calculating the buffering function zones through the Geographic Information System. Buffer zones categorized into three levels of 4, 8 and 12 km are assigned with 0.9, 0.8 and 0.7, respectively. In addition, the value for non-buffer zones is assigned with 0.5. After normalizing the drainage density and the impacts of buffer zones, the river network index () is obtained by the weighted average method, with a weight of 0.5 for each factor (NCC 2009).
3.2.3.3. Vegetation coverage
Green space is the typical land use/land cover type that can characterize surface permeability, and has a negative impact on rainstorm disasters (Liu et al. Citation2021). Since the vegetation has a strong function of water and soil conservation, the higher the vegetation coverage, the lower the risks of rainstorm disasters. Vegetation coverage refers to the percentage of the area with vegetation to the total land area. Based on the meteorological industry standard QX/T494-2019 (CMA 2019), the vegetation coverage index () can be obtained by the 1 km resolution NDVI product of the MODIS, as shown in Eq. (6).
(6)
(6)
3.2.4. Risk index
The risk of rainstorm disasters is the comprehensive result of hazard, exposure and vulnerability. In this study, the rainstorm disaster risk index at grid spacing of 1 km can be calculated by EquationEq. (1)(1)
(1) . The risks of rainstorm disasters are classified into four levels by the classification method of natural breaks in the ArcGIS, including low risk (Level 1), medium risk (Level 2), high risk (Level 3) and very high risk (Level 4). The ranges of risk values at each level are shown in .
Table 2. Definition and level intervals for the risks of rainstorm disasters.
4. Results
Due to the lack of both the daily precipitation and the number of records of rainstorm disasters in Hong Kong and Macao, the results of this research only include 9 cities of the GBA in Chinese mainland.
4.1. Hazard
From 1990 to 2018, a total of 4,286 non-typhoon related rainstorm processes are recorded at 29 meteorological stations in the GBA. Among them, the rainstorm processes lasting for 1 and 2 days account for 83% and 12%, respectively.
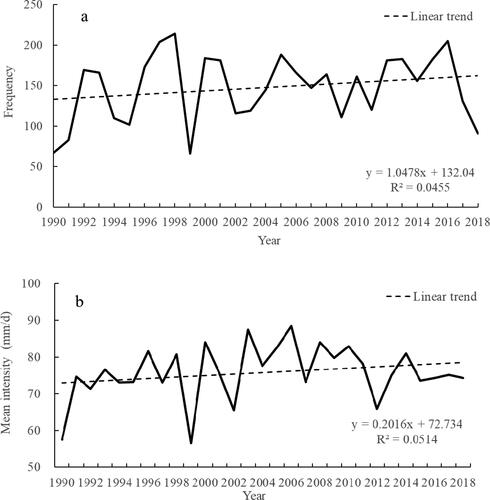
The changes in the frequency of non-typhoon related rainstorm processes in the GBA during 1990–2018 () suggest that the maximum frequency appeared in 1998 (214), followed by 2016 (205). Since 1990, the total number of rainstorm processes in the GBA has increased at a tendency rate of 10 times per decade. However, the tendency rate failed the significance test (p < 0.05). In addition, the average intensity of rainstorm processes has increased at a tendency rate of 2 mm10a−1, but with significant interdecadal changes (p < 0.05). The intensities of rainstorm processes during the period of 2000–2009 were relatively stronger, with the strongest being 88.4 mm day−1 in 2006, while those during the period of 1990–1999 were weaker. During the period of 2010–2018, although the rainstorm intensity presented a decreasing trend, it was still stronger than those in 1990–1999 ().
Figure 4. Changes in the frequency (a) and mean intensity (b) of rainstorm processes in the GBA from 1990 to 2018.
From the spatial distribution of the frequencies of the annual rainstorm processes (), it is found that the southwestern coastal area of the GBA has the most rainstorm processes, among which Enping and Doumen have an average annual rainstorm processes of 6.9 times. The reason for this situation is that this area is located at the southeastern foot of the Yunwu Mountain, which is thus affected by terrain conditions and water vapor transport over the ocean, and it is one of the rainstorm centers in Guangdong Province (Zheng et al. 2019). The frequency of rainstorm processes in the northwest of the GBA is relatively lower, being only 3.2 and 3.5 times in Deqing and Fengkai, respectively. The spatial distribution of the changes in rainstorm frequency () suggests that increases in the frequencies of rainstorm processes are found at 79.3% of the observation stations since 1990. Among them, the frequencies in Guangzhou, Dongguan, Foshan and Southeastern Zhaoqing have increased the most significantly (p < 0.05), with a tendency rate of 0.6–1.3 times10a−1.
Figure 5. Annual average frequency of rainstorm processes (a) and tendency rate of the frequency (b), as well as average rainstorm intensity (c) and tendency rate of the intensity (d).
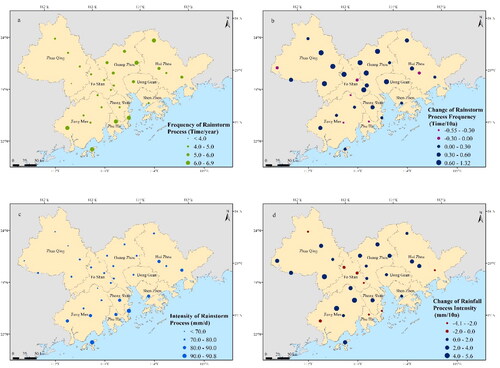
The large value areas of the average intensity of rainstorm processes from 1990 to 2018 are located in coastal areas of the GBA, where the largest is in Zhuhai (90.8 mm), followed by Shangchuan Island (90.7 mm). The average intensity of rainstorm processes from 1990 to 2018 is relatively small in the northwestern cities of Zhaoqing, with the smallest in Fengkai (68.1 mm) and Huaiji (68.9 mm), as shown in . The changes in rainstorm process intensity in the past 30 years indicate that 72.4% of the observation stations have recorded an increase in intensity (). Among them, the intensities in Guangzhou, Zhongshan, northern Jiangmen, western Huizhou, and Southern Zhaoqing have increased significantly (p < 0.05) at a tendency rate of more than 2.0 mm10a−1.
shows that the hazard index in coastal areas is mostly greater than 0.7. At county level, the hazard index is the highest (greater than 0.8) in Xiangzhou, Doumen and Jinwan Districts of Zhuhai, Taishan and Enping Districts of Jiangmen, as well as Futian, Nanshan and Luohu Districts of Shenzhen. While it is the lowest (less than 0.6) in Chancheng and Sanshui Districts of Foshan as well as most counties of Zhaoqing. At city level, the average hazard index is the highest in Zhuhai (0.91), followed by Jiangmen (0.80), Zhongshan (0.78) and Shenzhen (0.78), while the lowest in Zhaoqing (0.55) ().
Figure 6. The distribution of hazard index of 20-year-return-period in the GBA. Inverse distance weighted (IDW) interpolation technique in ArcGIS was used to create the figure.
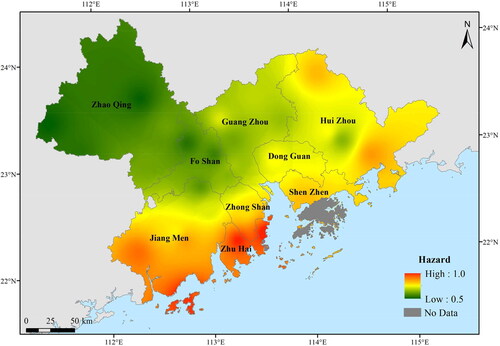
Table 3. Averages of hazard, exposure, vulnerability and risk indexes of cities in the GBA.
4.2. Exposure
In the GBA, the high GDP densities with more than 1 billion yuan per square kilometer are located in the most of Shenzhen, central Dongguan, and Yuexiu, Huangpu and Tianhe Districts of Guangzhou, while Zhaoqing, Jiangmen and most of Huizhou have less than 100 million yuan per square kilometer (). The high population density with more than 10,000 people per square kilometer are located in southern Shenzhen and Tianhe, Zhuzhou and Yuexiu Districts of Guangzhou, while Zhaoqing, Jiangmen and the most of Huizhou have less than 1,000 people per square kilometer (). suggests that Guangzhou, Shenzhen, Dongguan Zhongshan and Foshan have relatively higher socio-economic exposure, while the exposure is relatively lower in Huizhou, Zhuhai, Jiangmen, and Zhaoqing. At county level, the exposure is the highest in Yuexiu and Haizhu Districts of Guangzhou and Futian District of Shenzhen, which exceeds 0.8. In 2018, the more densely populated and developed cities in the GBA were Shenzhen, Dongguan, Foshan, Zhongshan and Guangzhou, where the population densities per square kilometer in these cities were 6705, 3426, 2083, 1898 and 1286, respectively, and the GDP densities were 1247 million yuan, 340 million yuan, 262 million yuan, 175 million yuan and 317 million yuan, respectively ().
Figure 7. The spatial distribution of GDP (a), POP (b) and exposure index (c) in the GBA. Inverse distance weighted (IDW) interpolation technique in ArcGIS was used to create the figure.
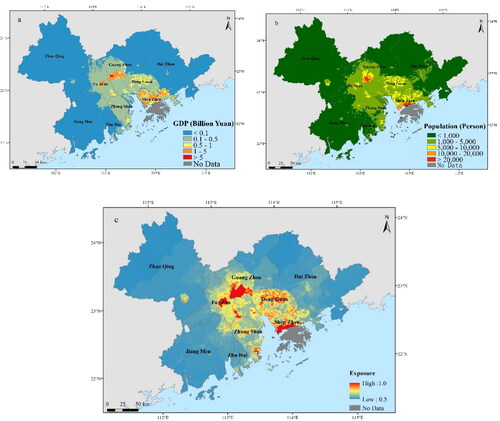
Table 4. Changes in urban land use and socio-economic indicators in cities of the GBA (Didan Citation2015; http://www.resdc.cn/Default.aspx.).
4.3. Vulnerability
For the distribution of terrain vulnerability, the northern and western GBA are mountainous area with high altitude, which are thus less sensitive to rainstorm disasters. The central GBA has low-lying and flat terrains, making it more sensitive to rainstorm disasters (). In terms of river network, the central GBA has a relatively denser distribution of rivers, making it more sensitive to rainstorms and floods than other areas (). The multi-year average vegetation coverage in the GBA during 1990–2018 suggests that Zhaoqing and Huizhou have high vegetation coverage and low sensitivity to rainstorm disasters, while the central and southern GBA have low vegetation coverage and are thus more sensitive to rainstorm disasters (). Based on topography, river network and vegetation, the vulnerability index is calculated following Eq. (5). As shown in , the result suggests that Foshan, Western Guangzhou, Northern Zhongshan, Eastern Zhuhai, Northern Dongguan, Central Huizhou and Zhaoqing along the West River are highly vulnerable to rainstorm disasters, with the vulnerability index exceeding 0.7. However, most of Zhaoqing and northern Huizhou are less vulnerable to rainstorm disasters.
Figure 8. The distribution of terrain (a), river network (b), vegetation coverage (c) and vulnerability (d) indexes in the GBA. Inverse distance weighted (IDW) interpolation technique in ArcGIS was used to create the figure.
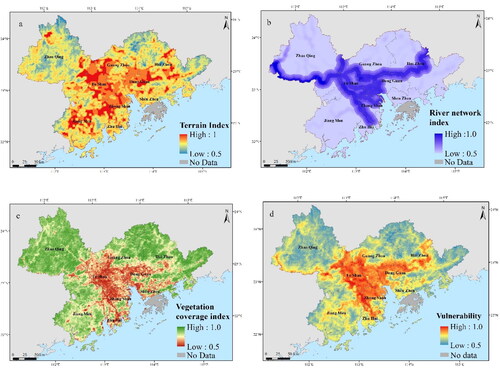
At county level, the vulnerability index is the highest (more than 0.83) in Liwan District of Guangzhhou, Shunde, Nanhai and Chancheng Districts of Foshan, as well as Jianghai District of Jiangmen. While it is the lowest (less than 0.61) in Conghua District of Guangzhou, Yantian District of Shenzhen and most counties of Zhaoqing. At city level, the vulnerability index is the highest in Foshan (0.89), followed by Zhongshan (0.78) and Dongguan (0.75), and the lowest in Zhaoqing (0.63), as shown in .
4.4. Risk
4.4.1. Risk map
The distribution of rainstorm disaster risk levels () suggests that the Pearl River Estuary area in the GBA has a higher risk level of rainstorm disasters. The average risk index reaches Level 4 in Zhuhai and Zhongshan, Level 3 in Dongguan, Jiangmen and Shenzhen, Level 2 in Huizhou, Foshan and Guangzhou and Level 1 in Zhaoqing. The areas of the risk of Level 4 in Zhuhai, Zhongshan, and Dongguan account for 87.7%, 82.3% and 58.9% of their total areas respectively (). The main reason is that these places have higher disaster dangerousness, low-lying and flat terrains, higher sensitivity to rainstorm disasters, as well as developed economy and dense population. At county level, there are 12 counties (districts) with the risk of Level 4, 14 counties (districts) with Level 3, 14 counties (districts) with Levels 2 and 5 counties (districts) with Level 1. Among them, the risk index is the highest (greater than 0.75) in Yuexiu and Haizhu Districts of Guangzhou, Doumen and Xiangzhou Districts of Zhuhai, as well as Futian District of Shenzhen. However, Guangning, Huaiji, Fengkai and Deqing Counties of Zhaoqing and Longmen County of Huizhou have the lowest risk of rainstorm disasters.
Figure 9. Risk levels of rainstorm disasters in the GBA from 1990 to 2018.
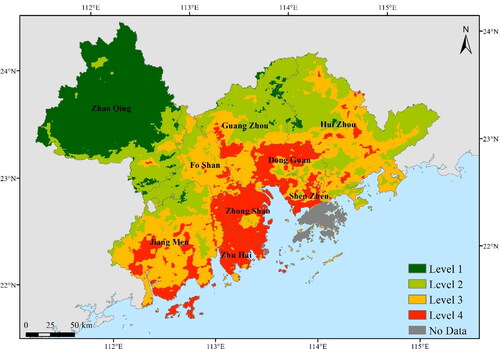
Table 5. Area percentages (%) of rainstorm disaster risk levels in the GBA.
4.4.2. Risk verification
In this research, the historical rainstorm disaster data is used to verify the rationality of the rainstorm disaster risk map. In addition, a disaster-inducing rainstorm is defined as a rainstorm that causes casualties or economic losses.
From 1990 to 2018, 956 disaster-inducing rainstorms are recorded at 29 meteorological observation stations, accounting for 22.3% of the total rainstorms (4286) in the GBA. indicates that the number of disaster-inducing rainstorms is more than 30 in Baoan and Longgang Districts of Shenzhen, Huicheng District and Longmen County of Huizhou, Guangning County, Huaiji County, and Gaoyao District of Zhaoqing, as well as Shunde District of Foshan. At county level, the spatial correlation coefficient between the risk index and the number of disaster-inducing rainstorms has passed the significance test at 99.5% confidence level. A total of 584 disaster-inducing rainstorms are recorded in areas with the risk of Levels 3 and 4, accounting for 60.02% of the total disaster-inducing rainstorms. Therefore, the risk index constructed in this study can well reflect the characteristics of rainstorm disasters. However, rainstorm disasters also frequently occur in mountainous areas, such as Zhaoqing, northeastern Guangzhou, and northern Huizhou, but the risks in these areas are not high. This is because we do not consider the potential spots of geological disasters as a vulnerability factor.
Figure 10. Distributions for the numbers of rainstorm disasters (a), urban waterlogging disasters (b), floods (c) and geological disasters (d) in the GBA from 1990 to 2018.
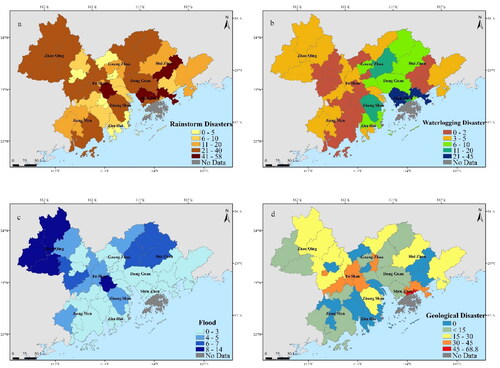
Rainstorms may cause floods (including basin-wide flood and mountain torrent), urban waterlogging, and geological disasters (collapse, landslide and debris flow). In past 30 years, 299 urban waterlogging disasters, 145 floods, and 159 geological disasters are recorded in the GBA, accounting for 31.2, 15.1 and 16.6% of the rainstorm-induced disasters, respectively. Specially, urban waterlogging disasters account for more than 60% of the rainstorm-induced disasters in 17 districts including Huangpu, Baiyun, Zengcheng, Liwan, Nansha, Tianhe, and Yuexiu Districts of Guangzhou, Nanshan, Futian, Longgang, Baoan, and Luohu Districts of Shenzhen, Doumen, Jinwan, and Xiangzhou Districts of Zhuhai, Dongguan and Zhongshan (). The risks in most of these regions are Level 3 and above. Therefore, it can be regarded that the high-risk areas of rainstorm disasters in the GBA mainly suffer urban waterlogging. In addition, the risk is Level 3 in Chancheng and Shunde Districts of Foshan, as well as Enping City of Jiangmen. The floods account for 50.0, 36.7 and 46.3% of the rainstorm-induced disasters, respectively (). Because Zhaoqing is located in the hilly and mountainous region, the frequency of geological disasters in Zhaoqing reaches as high as 33 (). However, the risk level is relatively lower in this area, which is mainly because the potential spots of geological disasters are not considered as a vulnerability factor in this study.
4.4.3. Disaster-induced rainstorm
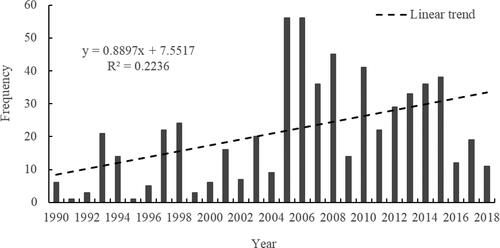
Mainly due to increases in extreme rainstorms and vulnerability, statistics on the frequency of the GBAs rainstorm disasters in the calendar year 1990–2018 () show that the tendency rate of rainstorm disasters has increased significantly with 8.9 times/10a (p < 0.01). Of these, 11 occurred each year on average from 1990 to 2004, while 32 occurred each year on average from 2005 to 2018, three times the frequency of the previous 15 years. Besides the increase of frequency and intensity of rainstorm process analyzed in Section 4.1, the causes of the increase in rainstorm disasters are also related to the development of the GBA’s urbanization.
Figure 11. Changes of the disaster-induced rainstorms in the GBA from 1990 to 2018.
Over the past 30 years, the population density in the GBA increased from 525 per square kilometer people to 1,180 people per square kilometer. The population density in Shenzhen (6,705 people per square kilometer), Dongguan (3,426 people per square kilometer), and Foshan (2,083 per square kilometer) exceeded 2,000 people per square kilometer in 2018, which have respectively increased by 6.8 times, 3.8 times and 1.8 times, compared with those in 1990. The GDP per square kilometer have increased from 1.3 million yuan to 149 million yuan by more than 100 times. The GDP growth rate is the fastest in Shenzhen. Overall, the exposure to rainstorm disasters in the GBA has increased significantly in the past 30 years, which undoubtedly increases the risk of rainstorm disasters.
Comparing the land use in 1990 and with that in 2015 in the GBA, it is found that the urban built-up area has expanded significantly (). The built-up area in 1990 was only 3,177 km2, accounting for 5.8% of the area of Guangdong, Hong Kong and Macao. By 2015, it increased to 7,591 km2, accounting for 13.7% of the area of Guangdong, Hong Kong and Macao, which is 2.39 times that of 1990. Specially, the built-up areas of Guangzhou, Dongguan and Foshan are relatively larger, reaching 1,435, 1,268 and 1,112 km2, respectively, in 2015. Over the past 30 years, Zhuhai, Zhongshan and Dongguan have experienced the fastest urban expansion, and the urban built-up areas in 2015 have respectively increased by 3.2, 3.1 and 2.5 times compared with those in 1990. In contrast, the vegetation coverage (including forest, grassland and farmland) area in 2015 has decreased by 9.4% for the GBA compared with that in 1990, and by more than 20% for Dongguan, Shenzhen, Foshan, Zhongshan and Zhuhai ().
5. Discussion and conclusions
In this study, the hazard, exposure and vulnerability are used to assess the rainstorm disaster risk at county level in GBA. The main conclusions are as follows.
The frequency and intensity of rainstorm processes during 1990–2018 in the GBA have increased by 10 times and 2 mm per decade, respectively. The increases are found at 79.3% of observation stations for the frequency of rainstorm process and at 72.4% of stations for the intensity of rainstorm process. Rainstorms in southwestern coastal area of the GBA are the most frequent.
The socio-economic exposure is relatively higher in Guangzhou, Shenzhen, Dongguan Zhongshan and Foshan. The vulnerability is higher in Foshan, Zhongshan and Dongguan. In city level, the rainstorm disaster risks of Level 4 locate in Zhuhai and Zhongshan, Level 3 in Dongguan, Jiangmen and Shenzhen, Level 2 in Huizhou, Foshan and Guangzhou, and Level 1 in Zhaoqing. At county level, there are 12 districts reaching the risk of Level 4, including Doumen, Doumen and Xiangzhou Districts of Zhuhai, Zhongshan, Futian, Nanshan and Luohu Districts of Shenzhen, Jianghai Districts of Jiangmen, as well as Yuexiu, Haizhu, Tianhe and Liwan Districts of Guangzhou.
Over the past 30 years, the population, GDP and built-up areas in the GBA have respectively increased by 1.25 times, 100 times and 1.39 times compared with those in 1990, while the vegetation coverage has decreased by 9.4%. Such changes combined with hazard changes made the frequency of rainstorm disasters during 2005–2018 increase by 2 times compared with 1990–2004. Moreover, urban waterlogging, floods, and geological disasters account for 31.2%, 15.1% and 16.6% of the rainstorm disasters, respectively. The Levels 3 and 4 risk areas mainly suffer urban waterlogging, which accounts for more than 60% of the rainstorm disasters.
In this study, for the hazard index, the historical observation data has limitation in spatial resolution. The precipitation at only one station cannot accurately describe the precipitation situation across the whole county. In the vulnerability assessment, indicators such as terrain, river network and vegetation coverage adopted all belong to natural conditions, while the differences in urban adaptability and emergency management capacity are not considered. The weights mainly indicate the relative importance of the three indicators. The risk of rainstorm disasters is the result of the interaction among multiple influencing factors, while some factors cannot be accurately described by mathematical models (Fang et al. Citation2015). For example, over the past 30 years, rainstorms in Zhaoqing have caused frequent geological disasters such as landslides and debris flows. However, since potential spots of geological disasters are not considered as a vulnerability factor, the risk of this city is quite different from the observed rainstorm disasters. At present, it is difficult to find all specific quantifiable factors to evaluate the risks of rainstorm disasters, which should be considered in future research work.
In the future construction of the GBA, it is necessary to take corresponding measures to prevent rainstorm disasters according to the different levels of rainstorm disaster risks. For the areas with high and very high risk of rainstorm disasters, improving the defenses against floods through engineering measures, increasing green space and reasonably designing the spatial patterns of impervious surfaces would provide useful ways to mitigate the risks of rainstorm disasters. For the areas with low and moderate risks of rainstorm disasters, the spatial structure of impervious surfaces should be further rationally planned, and the underground drainage pipe network system should be optimized to mitigate the risks of rainstorm disasters.
Credit author statement
All authors have participated in the research and article preparation. Dr. Yujie Wang designed the methods, analyzed the results and wrote the paper. Dr. Jianqing Zhai calculated and analyzed the results. Dr. Ge Gao provided the data and analyzed the results. Dr. Qiufeng Liu analyzed the results. Prof. Lianchun Song analyzed the results.
Acknowledgments
This work was supported by the National Key R&D Program of China (Grant No. 2019YFC1510400). We thank the editor and four anonymous reviewers who all made very valuable suggestions for improvement of this manuscript.
Disclosure statement
The authors declare that they have no conflict of interest.
Data availability statement (DAS)
The data that support the findings of this study are openly available on websites (www.resdc.cn and www.data.cma.cn).
Correction Statement
This article has been republished with minor changes. These changes do not impact the academic content of the article.
Additional information
Funding
References
- Ahmad SS, Simonovic SP. 2013. Spatial and temporal analysis of urban flood risk assessment. Urban Water J. 10(1):26–49.
- Bui DT, Pradhan B, Nampak H, Bui QT, Tran QA, Nguyen QP. 2016. Hybrid artificial intelligence approach based on neural fuzzy inference model and metaheuristic optimization for flood susceptibility modeling in a high-frequency tropical cyclone area using GIS. J Hydrol. 540:317–330.
- Canters F, Vanderhaegen S, Khan AZ, Engelen G, Uljee L. 2014. Land-use simulation as a supporting tool for flood risk assessment and coastal safety planning: the case of the Belgian coast. Ocean Coast Manag. 101:102–113.
- Cardona OD, Aalst MK, Birkmann J, Fordham M, McGregor G, Perez R, Pulwarty RS, et al. 2012. Determinants of risk: exposure and vulnerability. Cambridge, UK; New York, NY, USA: Cambridge University Press.
- Chen YB, Zhou HL, Zhang H, Du GM, Zhou JH. 2015. Urban flood risk warning under rapid urbanization. Environ Res. 139:3–10.
- China Meteorological Administration (CMA). 2012. Grade of precipitation (GB/T 28592-2012). Beijing: Science Press.
- China Meteorological Administration (CMA). 2019. Grade of monitoring and evaluating for terrestrial vegetation meteorology and ecological quality (QX/T494-2019). Beijing: China Meteorological Press.
- Demirdjian L, Zhou Y, Huffman GJ. 2018. Statistical modeling of extreme precipitation with TRMM data. J Appl Meteorol Climatol. 57(1):15–30.
- Didan K. 2015. MOD13A3 MODIS/Terra vegetation Indices Monthly L3 Global 1km SIN Grid V006, distributed by NASA EOSDIS Land Processes DAAC. https://doi.org/10.5067/MODIS/MOD13A3.006
- Fang J, Meng MJ, Wang JG, Shi PJ. 2015. Assessment and mapping of global fluvial flood risk. J Nat Disast. 24(1):1–8.
- Fang J, Lincke D, Brown S, Nicholls RJ, Wolff C, Merkens JL, Hinkel J, Vafeidis AT, Shi P, Liu M. 2020. Coastal flood risks in China through the 21st century – an application of DIVA. Sci Tot Environ. 704:135311.
- Feng SS, Fan FL. 2018. Spatial–temporal changes of impervious surface in the Guangdong–Hong Kong–Macao Greater Bay Area during 2006–2016. Trop Geogr. 38(4):536–545.
- Guangdong Meteorological Service. 2006. Guangdong Climate Bulletin in 2005.
- He C, Li M, Li TT, et al. 2016. Comparison and analysis of the four methods of determining weights in multi-objective comprehensive evaluation. J Hubei Univ. (Nat Sci). 38(2):172–178.
- He JH, Zhao P, Zhu CW, Zhang RH, et al. 2008. Discussions on the East Asian subtropical monsoon. Acta Meteorol Sin. 66(5):683–696.
- Hu HB. 2016. Rainstorm flash flood risk assessment using genetic programming: a case study of risk zoning in Beijing. Nat Hazards. 83(1):485–500.
- IPCC 2014. Climate change 2014: impacts, adaptation, and vulnerability. part a: global and sectoral aspects. Contribution of Working Group II to the Fifth Assessment Report of the Intergovernmental Panel on Climate Change. Cambridge: Cambridge University Press; p. 535–612.
- Islam MR, Raja DR. 2021. Waterlogging risk assessment: an undervalued disaster risk in coastal urban community of Chattogram, Bangladesh. Earth. 2(1):151–173.
- Kang Y, Park CS, Park JY, Cho D. 2018. Spatial differences in the heavy precipitation risk intensity in South Korea. Hum Ecol Risk Assess. 24(6):1579–1594.
- Kharin VV, Zwiers FW, Zhang X, Wehner M. 2013. Changes in temperature and precipitation extremes in the CMIP5 ensemble. Clim Change. 119(2):345–357.
- Kim H, Marcouiller DW. 2017. Mitigating flood risk and enhancing community resilience to natural disasters: plan quality matters. Environ Hazards. 17(5):1–21.
- Li W, Lin K, Zhao T, Zhao T, Lan T, Chen XH, Du HW, Chen HY. 2019. Risk assessment and sensitivity analysis of flash floods in ungauged basins using coupled hydrologic and hydrodynamic models. J Hydrol. 572:108–120.
- Li ZH, Song KY, Peng L. 2021. Flood risk assessment under land use and climate change in Wuhan City of the Yangtze River Basin, China. Land. 10(8):878.
- Li X, Pan AD. 2014. Flood risk assessment of Guangzhou city based on GIS. China Popul Resour Environ. 23(3):363–367.
- Li Y, Zhang ZR, Gong SY, Liu MJ, Zhao YQ. 2020. Risk assessment of rainstorm disasters under different return periods: a case study of Bohai Rim, China. Ocean Coast Manage. 187:105107.
- Lin K, Chen H, Xu C, Yan P, Lan T, Liu ZY, Dong CY. 2020. Assessment of flash flood risk based on improved analytic hierarchy process method and integrated maximum likelihood clustering algorithm. J Hydrol. 584:124696.
- Liu BJ, Chen JF, Lu WX, Chen XH, Lian YQ. 2016. Spatiotemporal characteristics of precipitation changes in the Pearl River Basin China. Theor Appl Climatol. 123(3–4):537–550.
- Liu F, Liu XD, Xu T, Yang G, Zhao YL. 2021. Driving factors and risk assessment of rainstorm waterlogging in urban agglomeration areas: A Case study of the Guangdong-Hong Kong-Macao Greater Bay Area, China. Water. 13: 770. https://doi.org/10.3390/w13060770
- Liu S, Lin M, Li C. 2019. Analysis of the effects of the river network structure and urbanization on waterlogging in high-density urban areas—a case study of the Pudong New Area in Shanghai. IJERPH. 16(18):3306.
- Lu E, Zhao W, Zou X, Ye D, Zhao C, Zhang Q. 2017. Temporal-spatial monitoring of extreme precipitation event: determining simultaneously the time period it lasts and the geographic region it affects. J Clim. 30(16):6123–6132.
- Lyu HM, Sun WJ, Shen SL, Arulrajah A. 2018. Flood risk assessment in metro systems of mega-cities using a GIS-based modeling approach. Sci Tot Environ. 626:1012–1025.
- Ma SQ, Shuran L, Zhang YD. 2021. Weighted clustering-based risk assessment on urban rainstorm and flood disaster. Urban Clim. 39:100974.
- Meraj G, Romshoo SA, Yousuf A, Altaf S, Altaf F. 2015. Assessing the influence of watershed characteristics on the flood vulnerability of Jhelum Basin in Kashmir Himalaya. Nat Hazards. 77(1):153–175.
- National Climate Center of China Meteorological Administration (NCC). 2009. Technical specification for risk zoning of rainstorm and flood disaster. Beijing: China Meteorological Press.
- Ning Y-F, Dong W-Y, Lin L-S, Zhang Q. 2017. Analyzing the causes of urban waterlogging and sponge city technology in China. IOP Conf Ser: Earth Environ Sci. 59:012047.
- Quan RS, Liu M, Lu M, Zhang LJ, Wang JJ, Xu SY. 2010. Waterlogging risk assessment based on land use/cover change: a case study in Pudong new area. Shanghai Environ Earth Sci. 61:1113–1121.
- Quan RS. 2014. Rainstorm waterlogging risk assessment in central urban area of Shanghai based on multiple scenario simulation. Nat Hazards. 73(3):1569–1585.
- United Nations Office for Disaster Risk Reduction (UNDRR). 2019. Global assessment report on disaster risk reduction. Geneva, Switzerland: United Nations Office for Disaster Risk Reduction (UNDRR); p. 137–157.
- Ren F, Cui D, Gong Z, Wang Y, Zou X, Li Y, Wang S, Wang X. 2012. An objective identification technique for regional extreme events. J Clim. 25(20):7015–7027.
- Ren Z, Yu Y, Zou F, Xu Y. 2012. Quality detection of surface historical basic meteorological data. J Appl Meteor Sci. 23(6):739–747.
- Reguero BG, Losada IJ, Díaz-Simal P, Méndez FJ, Beck MW. 2015. Effects of climate change on exposure to coastal flooding in Latin America and the Caribbean. PloS One. 10(7):e0133409.
- Sillmann J, Kharin VV, Zhang X, Zwiers FW, Bronaugh D. 2013. Climate extremes indices in the CMIP5 multimodel ensemble: Part 1. Model evaluation in the present climate. J Geophys Res Atmos. 118(4):1716–1733.
- Silva SF, Martinho M, Capit ∼ Ao R, Reis T, Fortes CJ, Ferreira GC. 2017. An index based method for coastal-flood risk assessment in low-lying areas. Ocean Coast Manag. 144:90–104.
- Sun S, Zhai JQ, Li Y, Huang D, Wang G. 2020. Urban waterlogging risk assessment in well-developed region of Eastern China. Phys Chem Earth. 115:102824.
- Tang Y. 2016. Analysis of hidden dangers from geological hazards, and safety recommendations in Shenzhen. Shanghai Land Resour. 37(3):82–85.
- Vousdoukas MI, Lorenzo M, Evangelos V, Bianch A, Dottori F, Feyen L. 2018. Climatic and socioeconomic controls of future coastal flood risk in Europe. Nat Clim Change. 8(9):776–780.
- Wang DH, Liu JJ, Shan YL, Ji JP, Song HY. 2001. The design and establishment of 1:250000 digital elevation model of China. Bull Survey Mapp. 10:27–29.
- Wang XF, Wang S, Ren L, Zeng Z. 2017. Spatial distribution of rainstorm hazard risk based on EW-AHP in mountainous scenic area of China. Hum Ecol Risk Assess. 23(4):925–943.
- Wang YJ, Han ZY, Gao R. 2021a. Changes of extreme high temperature and heavy precipitation in the Guangdong–Hong Kong–Macao Greater Bay Area. Geomat Nat Hazards Risk. 12(1):1101–1126.
- Wang YJ, Zhai JQ, Song LC. 2021b. Waterlogging risk assessment of the Beijing–Tianjin–Hebei urban agglomeration in the past 60 years. Theor Appl Climatol. 145(3–4):1039–1051.
- Wu S, Pan T, He S. 2011. Primary study on the theories and methods of research on climate change risk. Adv Clim Change Res. 7(5):363–368.
- Wu HY, Zou Y, Liu W. 2019. Quantitative assessment of regional heavy rainfall process in Guangdong and its climatological characteristics. J Appl Meteorol Sci. 30(2):233–244.
- Xiao H, Lu GH, Wu ZY, Liu ZY. 2013. Flood response to climate change in the Pearl River basin for the next three decades. J Hydraul Eng. 44(12):1409–1419.
- Xu N, Gong P. 2018. Significant coastline changes in China during 1991–2015 tracked by Landsat data. Sci Bull. 63(14):883–886.
- Xu XL, Liu JY, Zhang SW. 2018. China multi-period land use land cover remote sensing monitoring data set (CNLUCC). The data Registration and Publishing system of the Resource and Environmental Science data Center of the Chinese Academy of Sciences ( doi: 10.12078/2018070201.2018.
- Yang L, Scheffran J, Qin H, You Q. 2015. Climate-related flood risks and urban responses in the Pearl River Delta, China. Reg Environ Change. 15(2):379–391.
- Yang C, Li Q, Zhao T, Liu H, Gao W, Shi T, Guan M, Wu G. 2019. Detecting spatiotemporal features and rationalities of urban expansions within the Guangdong–Hong Kong–Macau Greater Bay Area of China from 1987 to 2017 using time-series Landsat images and socioeconomic data. Remote Sens. 11(19):2215.
- Ye DX, Wang ZY, Gao R, Wang R, Xiao C. 2019. Objective identification and climatic characters of the regional rainstorm event in China from 1961 to 2016. Climate Change Res. 15(6):575–583.
- Zhang A, Xiao L, Min C, Chen S, Kulie M, Huang C, Liang Z. 2019. Evaluation of latest GPM-Era high-resolution satellite precipitation products during the May 2017 Guangdong extreme rainfall event. Atmos Res. 216:76–85.
- Zhang LH, Zheng J, Wu H. 2021. Quantitative assessment of disaster loss caused by rainstorms and floods in Guangdong. Torrent Rain Disast. 40(1):87–93.
- Zhao Y, Zou X, Cao L, Xu X. 2014. Changes in precipitation extremes over the Pearl River Basin, Southern China, during 1960–2012. Quat Int. 333:26–39.
- Zhejiang Meteorological Observatory. 2017. Assessment technical specification for the risk level of rainstorm processes. DB33/T 2025–2017.
- Zhou B, Zeng H, Zhao L, Han Z. 2019. Climate change and climate risks in the Guangdong–Hong Kong–Macao Greater Bay Area. Annual report on actions to address climate change, pp. 239–258.
- Zhou L, Wu XH, Ji ZH, Ge G. 2017. Characteristic analysis of rainstorm-induced catastrophe and the countermeasures of flood hazard mitigation about Shenzhen city. Geomatics Nat Hazards Risk. 8(2):1886–1897.
- Zhu ZW, He JH. 2013. The vortex over Bay of Bengal and its relationship with the outbreak of South China sea summer monsoon. J Trop Meteorol. 29(6):915–923.
- Zhou YH, Peng T, Shi RQ. 2019. Research progress on risk assessment of heavy rainfall and flood disasters in China. Torrent Rain Disast. 38(5):494–501.