
 ?Mathematical formulae have been encoded as MathML and are displayed in this HTML version using MathJax in order to improve their display. Uncheck the box to turn MathJax off. This feature requires Javascript. Click on a formula to zoom.
Abstract
Remote sensing provides crucial support for building damage assessment in the wake of hurricanes. This article proposes a coupled deep learning-based model for damage assessment that leverages a large very high-resolution satellite images dataset and a flexibility of building footprint source. Convolutional Neural Networks were used to generate building footprints from pre-hurricane satellite imagery and conduct a classification of incurred damage. We emphasize the advantages of multiclass classification in comparison with traditional binary classification of damage and propose resolving dataset imbalances due to unequal damage impact distribution with a focal loss function. We also investigate differences between relying on learned features using a deep learning approach for damage classification versus a commonly used shallow machine learning classifier, Support Vector Machines, that requires manual feature engineering. The proposed model leads to an 86.3% overall accuracy of damage classification for a case event of Hurricane Michael and an 11% overall accuracy improvement from the Support Vector Machines classifier, suggesting better applicability of such an open-source deep learning-based workflow in disaster management and recovery. Furthermore, the findings can be integrated into emergency response frameworks for automated damage assessment and prioritization of relief efforts.
1. Introduction
Hurricanes have been the most expensive type of disaster in the USA (CRED 2019) and historically deathliest, continuing to drive the importance of improving techniques to assess post-hurricane urban damage. The process of such damage assessment involves detection, classification, and evaluation of disaster damage to an economy and society on local, county, state, or tribal levels (FEMA Citation2016). Remote sensing analysis has proved to be indispensable in aiding these assessment efforts (Adams et al. Citation2009; Waharte and Trigoni Citation2010; Stow et al. Citation2015). In particular, the Federal Emergency Management Agency (FEMA) relies on remote sensing analysis to rapidly assess a large-scale impact and monitor areas that cannot be effectively accessed on the ground. The timeliness, accuracy, and semantic information of such remote sensing analysis results are of key interest (Stow et al. Citation2015).
This paper focuses on damage assessment to buildings, which are of particular importance for distributing individual assistance to impacted households and businesses. In the past, assessment methods in remote sensing literature relied on pixel-based scene analysis to compare pre- and post-disaster images pixel-by-pixel with low-level, handcrafted visual features. For example, Yamazaki (2001) used color indices and edge intensity, variance, and direction uniformity to identify pixels within ranges of pre-determined threshold values as damaged buildings. Another study by Pesaresi et al. (Citation2007) developed a method for rapid detection of built-up area damage with multiple criteria and fuzzy logic using pre- and post‐disaster imagery. Overall, such pixel-based scene analysis is sensitive to small spurious changes (Chen et al. Citation2012) and produce inconsistent and lower accuracy change detection results (Gong et al. Citation2008). With an increasing availability of very high-resolution imagery (VHR) that allows for delineation of individual objects of interest, more recent damage assessment studies have been utilizing object-based and deep learning segmentation approaches (Li et al. Citation2018; Vetrivel et al. Citation2018; Gupta and Shah Citation2021; Liu et al. Citation2021). The assessment workflow in these studies is typically conducted in two stages: delineation of building footprints from pre-event scenes, and classification of post-event damage on an individual building scale.
The first task of damage assessment is building detection. Authoritative building footprint maps are not always readily available to emergency management agencies across the world (Mwange et al. Citation2018; Putra et al. Citation2019) or need to be frequently updated, necessitating the need for an automatic delineation of the building footprint. Deep learning-based building segmentation techniques have been gaining popularity over object-based analysis in remote sensing literature due to their ability to extract representations from big volumes of training data (Goldberg et al. 2017; Van Etten et al. Citation2018; Lu et al. Citation2019; Su et al. Citation2020; GFDRR Labs Citation2020), as well as increase delineation accuracy through a transfer of knowledge from the natural images to a medium to high resolution imagery (de Lima and Marfurt Citation2019). Compared to the traditional remote sensing methods that rely on hand-crafted features, deep learning has an architecture of many stacked modules with many parameters that are capable of learning very complex functions describing the data. Therefore, predictability of these deep models generally improves with an increase of training data sets volume (Zhong et al. Citation2019).
The second task of damage assessment workflow involves binary or multi-label classification of damage for individual building objects. Here, deep learning classification techniques have also shown to be more effective (Vetrivel et al. Citation2018) In addition to avoiding feature engineering, it provides flexibility of pattern exploration to derive more meaning from images (Li et al. Citation2018). Classifying change due to disasters in image time series is challenging due to the lack of their definitions and highly dynamic nature of events (Karpatne et al. Citation2019), which the architecture of deep learning models can address better compared to the conventional shallow techniques that are limited in learning vast semantic representations (Cheng et al. Citation2017). A common challenge for deep learning-based methods is an unbalanced class distribution that leads to poor classification rates for underrepresented classes. This problem is especially relevant in damage assessment studies due to an uneven hurricane damage distribution. For example, a recent study by Liu et al. (Citation2021) reported in the case of unbalanced samples, their damage classification model achieved lower producer accuracy by 57–62% for the most underrepresented class than the most common classes. Other deep learning-based damage assessment studies reported similar findings (Doshi et al. Citation2018; Endo et al. Citation2018) but did not explicitly address the problem of class imbalance in the study design. Another challenge often cited for deep learning is the need for high-volume and variety datasets of labeled imagery (Ball et al. Citation2017), which has been recently addressed with an increasing number of publicly available datasets specific to the task of hurricane building damage assessment (Choe et al. Citation2018; Gupta et al. Citation2019). More case studies utilizing such large-scale datasets are needed to be established, as it was observed that fine-tuning global models with regional samples relevant to the studied geographic area improves accuracy (Vetrivel et al. Citation2018; Hu and Tang Citation2021).
This study proposes a coupled disaster damage assessment workflow based on two CNNs for building delineation and multi-degree damage classification. A coupled nature of our models provides flexibility to emergency managers to supply an authoritative building footprint map and forgo the first delineation model. The models are trained with a publicly available labeled dataset of VHR satellite imagery for building damage assessment to examine a case study of Category 4 Hurricane Michael in 2018 (Gupta et al. Citation2019). The architecture of a CNN for a second stage of damage assessment, classification, provides for multi-label prediction output and addresses a class imbalance problem with a focal loss function. Proposed methods were implemented using Python programming language with TensorFlow, Keras, Numpy and Sklearn as core libraries. We also investigate the performance of our damage classification model in comparison with a traditionally deployed Support Vector Machines (SVM) model that relies on a careful selection of low-level, hand-crafted features. Section 2 in the remainder of this paper overviews the study event, dataset and introduces the research methodology. Section 3 provides the results and performance metrics, and Section 4 discusses the results, implications, limitations, as well as potential future research directions of this study. The conclusions are presented in Section 5.
2. Methodology
2.1. Study area and data
The study area is located in the state of Florida, the United States of America, which was struck by Hurricane Michael in 2018. Michael originated in the Gulf of Mexico on October 6th, 2018, shifted in the path near the coast of Florida, and started dissipating farther inland on October 16th, 2018 (National Weather Service Citation2019). According to a report by (Beven et al. Citation2019), large storm surge heights were recorded along the Florida Panhandle coast, as well as hurricane-force winds and heavy rains. The hurricane left major destruction across its path through Florida Panhandle and specifically, Bay County. The research study area includes heavily struck Bay County and parts of neighboring Calhoun, Gulf, Washington, Leon, and Holmes counties. Overall, NOAA National Centers for Environmental Information estimated the total damage to the U.S.A. economy from Hurricane Michael to equal $25 billion, out of which $18.4 billion occurred in Florida and $3 billion on Tyndall Air Force Base near Panama City.
We obtained labeled satellite images for the study area from the xBD dataset (Gupta et al. Citation2019). The xBD is a unique large-scale compilation of VHR RGB satellite imagery for building damage assessment, consisting of pre-event building polygons and their post-event damage levels for 19 varying types of disasters caused by natural hazards across the world. For our study area and event, the imagery was acquired by GeoEye-1 and WorldView-2 satellites on available cloud-free days in October or November 2017 for the pre-event dataset. The post-event imagery was obtained on cloud-free days directly after the hurricane impact, predominantly on October 13, 2018. All satellite images were calibrated and registered by the provider.
Within our study area, the dataset includes 22,686 delineated and labeled building footprint polygons ). The dataset does not include polygons for buildings under construction and severely obstructed by vegetation or cloud cover. The xBD dataset relies on a Joint Risk Scale as a simplified method of classifying damage to buildings across many geographical regions and due to various natural hazards. This unified approach to measure damage improves the ability to reproduce the analysis in a fast manner across various datasets (Gupta et al. Citation2019). describes a labeling classification scheme adopted by the authors in the data annotation. Post-event imagery was used to provide damage class labels. Majority of the buildings within our study area are labeled as undamaged, making the distribution of labeling classes highly skewed. Minor and major degrees of damage make the second and third most represented classes, respectively. A small fraction of building polygons is labeled as destroyed, and 232 unclassified polygons, or 1% of total, were not considered in our model training process.
Figure 1. Building footprint map for Hurricane Michael. Source: Esri, Maxar, GeoEye, Earthstar Geographics, CNES/Airbus DS, USDA, USGS, AeroGRID, IGN, HERE, Garmin, FAO, NOAA , © OpenStreetMap contributors, and the GIS User Community
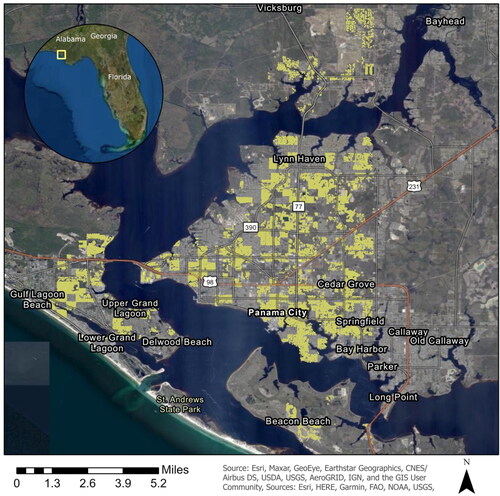
Table 1. Damage degree classification scheme.
2.2. Building footprint segmentation
We use CNNs as a basis for the building footprint segmentation and damage classification steps. The first step leverages a U-Net deep learning architecture. U-Net is a popular choice for a variety of semantic segmentation tasks that are based on natural images, as well as VHR (Pasquali et al. Citation2019; Yi et al. Citation2019). A U-Net is also a baseline model for the building segmentation challenge accompanying the xBD dataset (Gupta et al. Citation2019).
depicts architecture schematics of the U-Net model used in our study. It is built upon a convolutional network and resembles a U-shape asymmetric architecture to ensure the output image size is the same as an input. The downsampling path on the left side encodes an image into feature representations at various levels and decreases the grid size. The upsampling path on the right side is a decoder that increases the grid size and semantically projects these learned discriminative features into the actual pixel space of the output image, thereby recognizing each pixel as belonging to one class with its neighboring pixels (Ronneberger et al. Citation2015).
Figure 2. U-Net model architecture for the building footprint segmentation problem.
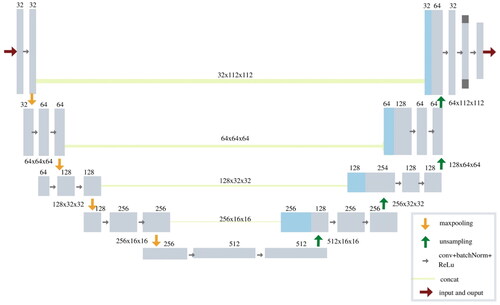
The input of the model consists of pre-event image chips in the size of 400 × 400 pixels and their building masks. We split the dataset into training, validation, and testing sets in the ratio of 60%–20%–20% and monitored the accuracy of validation to fine-tune the model parameters in the training process. Several data augmentation techniques were applied to the dataset to increase representativeness and diversity of data. In particular, these techniques included flipping, random cropping, and random color distortion (brightness, contrast, saturation, hue). The model outputs a mask, with pixels grouped into two categories: building and non-building categories.
2.3. Damage classification
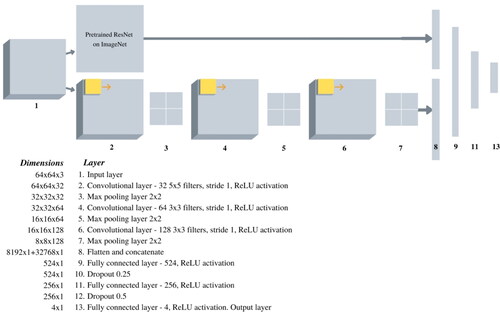
The second step aims to conduct a change type classification due to a hurricane impact. A modified version of a ResNet CNN architecture is proposed, as shown in Citation2016). A ResNet50 model consists of a fifty-layer CNN that learns residual functions during each step of propagation with reference to the input layer. The model is pre-trained on a large dataset of natural images, ImageNet (Deng et al. Citation2009) to improve the learning of low-level features. Previous research has also shown that transfer learning from such pre-trained NNs for RGB high-resolution imagery leads to higher accuracies than training from the scratch (de Lima and Marfurt Citation2019). Our pre-trained ResNet-50 model is combined with a smaller-sized network with random initial weights, consisting of three convolutional layers and three fully connected layers. A dropout technique is introduced in the fully connected layers to minimize overfitting and improve model generalization.
Figure 3. Architecture of the damage classification model.
Data augmentation is another important step to enrich representativeness in the case of limited dataset size. It artificially increases the dataset size to improve the ability of our model to generalize onto new, unseen, input images. There are various techniques for augmentation, such as scaling, rotating, blurring, shifting, etc., as well as combining simulated images of objects with satellite images to improve dataset quality (Yan et al. Citation2019). We applied four main techniques to the training dataset: width and height shifting, rescaling, vertical and horizontal flipping, zooming, and brightness adjustment.
The model input to our ResNet model constitutes a damage label for each building in the dataset and a corresponding post-event imagery. A challenge arising is how to crop this imagery to an extent of individual buildings. The optimal crop size is an important factor influenced by the physical size of buildings, sensor resolution, noise and needs to consider background information. For example, Cao and Choe Citation2020) considered window crop sizes of 128 × 128, 64 × 64, 400 × 400, and 32 × 32 for damage detection using similar WorldView satellite images during Hurricane Harvey. After visually examining the physical sizes of buildings in the study area, as well as a wind-related nature of damage without flooding, we decided to choose an optimal 64 × 64 crop size with several additions. Cropped input images, or image chips, are centered at each post-event building, scaled to fit the 64 × 64 crop window size, and extended to include a surrounding area by 30%, thereby introducing an element of spatial neighboring. The network learns the relationship between pixels of each image chip in the input (layer 1 in ) through operations (layer 2–12) and assigns a damage degree label d = 0,1,2,3 to an image chip as an output (layer 13).
Labeled post-event images are split into training, testing, and validation as 60%–20%–20%. Validation accuracy and loss are evaluated in the process of training to fine-tune model parameters.
It is important to address an extreme class imbalance that are outlined in . A class imbalance is typical in these damage classification problems. Johnson and Khoshgoftaar (Citation2019) overviewed several ways to address class imbalance problems in deep learning, citing algorithm-level methods as standard approaches to modify the loss function to assign higher weights based on the inverse class frequency to underrepresented classes. For instance, major damage and destroyed classes within our study area are the least represented. We utilize one of such loss functions in training our model whilst addressing a class imbalance problem called a focal loss (Lin et al. Citation2017). It is a modified cross-entropy loss function that reduces the influence of easily classified examples on the loss and is defined as
(1)
(1)
(2)
(2)
where p is an estimated probability, y is a class label, α ∈ [0, 1] is a weighting factor,
is a modulating factor, γ is a focusing parameter. The focusing parameter helps to downweigh easy, well-represented examples. The weighting factor balances loss based on class distribution between most rare and common labels. The modulating factor decreases contribution from easy examples and makes it more important to correct misclassifications. These hyperparameters for focal loss can be determined experimentally or set to recommended. Lin et al. (Citation2017) concluded that γ = 2 and α = 0.25 were most suitable for an object detection task. Nemoto et al. (Citation2018) classified building change from VHR images using a CNN model architecture and a focal loss function. The multi-class focal loss with γ = 2 performed best, while γ = 0 did not address the class imbalance, and γ = 5 stagnated the learning process. Based on these findings, we set γ = 2 as a default focusing parameter and the weighting factor, α, to inverse class frequencies.
2.4. Comparison of deep vs. shallow learning-based damage classification
The deep learning-based CNN damage classification model is further compared in performance to a shallow machine learning model. This allows comparing a traditional method for object classification used in remote sensing with a more novel deep learning-based technique. SVMs is a technique for supervised linear and non-linear data classification that performs well with heterogeneous classes given a few training samples. It is often implemented in remote sensing for damage assessment (Jiang and Friedland Citation2016; Tu et al. Citation2016; Wieland et al. Citation2016) to distinguish between several damage degree levels.
Textural, structural, and spectral features derived for each building sample from post-event images constitute an input to train a supervised SVM model that predicts four damage degree classes according to the labeled building footprint, as previously shown in . First, we derive structural features through a variogram. It is a function that describes the covariance structure of a studied spatial process, given as
(3)
(3)
where h is a lag distance, N is the number of observation pairs for a given lag, z(x) and z(xi+h) are pixel values at respective locations. Since a variogram allows the measurement of an autocorrelation degree and representative structural information, it proved to be useful in satellite imagery analysis. Balaguer et al. (Citation2010) suggested 14 parameters to characterize the variogram behavior at hand. Another study by (Wu et al., Citation2015) further concluded that out of those parameters 11 are significant for urban land cover classification via the principal component analysis. Therefore, the choice of parameters in this project is guided by those findings as well as representativeness due to some of the parameters being highly correlated. Nine parameters listed in were chosen to be implemented for feature extraction. Empirical variograms and their indices were estimated for gray-scale images.
Table 2. Structural, textural, and spectral indices input to SVM classifier.
Textural features are further obtained based on a grey-level co-occurrence matrix (GLCM). GLCM is defined over a grayscale image, measuring the joint probability of occurrence of pixel pairs and representing a relationship between pairs separated by a given distance in certain directions (Haralick et al. Citation1973). Probabilities to transition from the i grey level to the j grey level for (x,y) neighboring pixels are defined by a transition vector δ(a, b) in the following equation:
(4)
(4)
where I is the digital image, P is a probability matrix. GLCM-based texture analysis has been traditionally used in remote sensing to construct handcrafted features (Huang et al. Citation2014). We derived mean and variance values of four foundational texture features using the GLCM matrix: energy, entropy, correlation, and contrast (). Finally, in addition to the structural and textural features as an input to the SVM model, we derived spectral features using the signature means of each spectral band.
2.5. Accuracy assessment
We conducted an evaluation and comparison using the following metrics to measure the performance of our coupled damage assessment models. The basis of calculations is found in a confusion matrix in . Precision indicates how accurate the predictions are, while a recall represents a portion of correct predictions for a class to all instances in that class Equation(Eqs. 5(5)
(5) and Equation6
(6)
(6) , respectively). The overall accuracy, provided in EquationEq. (7)
(7)
(7) , indicates a proportion of all correct predictions to a total number of predictions, or instances. The F1 score, formulated in EquationEq. 8
(8)
(8) , considers both recall and precision values, thereby providing a more useful evaluation of model performance. It describes how precise and robust the classifier is, with the best score of one meaning perfect recall and precision values.
Table 3. Confusion matrix for binary classification.
Additionally, we used the Intersection over Union (IoU) score to evaluate building semantic segmentation results Equation(Eq. 9(9)
(9) ). The IoU evaluates how similar is the bounding box of prediction to the bounding box of ground truth, with values larger than 0.5 indicating an overall good score.
(5)
(5)
(6)
(6)
(7)
(7)
(8)
(8)
(9)
(9)
3. Results
3.1. Building footprint segmentation
The model was trained for 140 epochs on one Nvidia Tesla P100 graphics processing unit (GPU) computing processor with 16GB memory. A batch size of 16 and a learning rate of 0.001 were used. Weights of the network were initialized with random numbers and further updated using a first-order gradient descent-based optimization algorithm Adam (Kingma and Ba Citation2015), where the error estimate is the basis to modify the weights. The learning rate, batch size, and a particular optimizer were adjusted in the process of monitoring validation accuracy.
The model is converging over the epochs with small fluctuations, indicating an overall good choice for the learning rate and batch size hyper-parameters. shows the testing results of a trained U-Net segmentation model. It achieved an 84.6% overall accuracy, with a building IoU score of 0.611, precision of 0.785, and recall of 0.734.
Table 4. Performance metrics of the segmentation model on the test dataset.
3.2. Damage classification
The network was trained for 125 epochs on the same Nvidia Tesla P100 GPU with a batch size of 32 and a learning rate of 0.0001. β1 of 0.9 and β2 of 0.999 were used as recommended parameters for the Adam optimizer. These hyperparameters were adjusted to the given optimal values in the process of monitoring validation accuracy to improve the model’s performance.
shows an excellent rate of prediction for the buildings in the undamaged class. The model successfully identifies presence of no damage after hurricane with an F1 score of 0.954. Minor damage has a lower F1 score of 0.742 and a good precision rate of 0.825, which indicates a lower rate of false positive predictions in this class. Major damage and destroyed classes follow with relatively lower F1 scores and precision rates in the model. also reflects a comparison of our CNN damage classification model to a shallow learning algorithm SVM with hand-crafted features. The SVM overall performed inferior to our proposed model, with an overall accuracy of 75.3% compared to the 86.3% of the CNN. In particular, structural features provided interesting insights into the nature of damage characterization, where damaged and non-damaged objects had different empirical variograms. Non-damaged buildings have homogeneous spatial patterns at close distances and a smooth decrease in variance at large distances, whereas damaged buildings are more heterogeneous and can be characterized by two or more local maxima.
Table 5. Overall performance of the proposed CNN and SVM damage classification models.
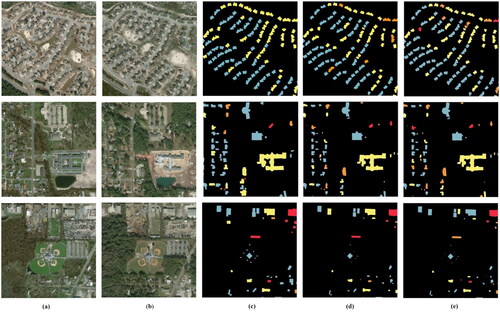
illustrates damage assessment for three different localities within the study area. Pre- and post-event scenes acquired by the Worldview satellite are provided in . shows manually delineated buildings and their annotated classes from the xBD training dataset. show segmented buildings using our U-Net model with their predicted damage classes from the CNN and SVM models, respectively. Overall, the segmented buildings closely match in location to the annotated examples and show smoothed object edges. The misclassification rate is pronounced within minor and major damage classes, however, almost all annotated undamaged buildings are correctly identified in the CNN model output as undamaged, showing a higher recall rate. The SVM predictions are overall less accurate and show discrepancy from the annotated labels especially in areas of varying color and debris.
Figure 4. Visual evaluation of the coupled damage assessment model at three localities. (a) Pre-event images, (b) post-event images, (c) annotated buildings and damage classes from the training dataset, (d) segmented buildings with CNN output classes, (e) segmented buildings with SVM output classes. Color legend: blue – undamaged, yellow – minor damage, orange – major damage, red – destroyed buildings.
4. Discussion
Responding to disasters requires prompt coordination of rescue efforts and damage assessment. Recently, more attention is brought to studying how this task can be achieved with a deep learning-based workflow and leveraging an increasing availability of labeled big datasets of satellite imagery. However, a gap in understanding the advantages and disadvantages of such workflows, particularly compared to conventional shallow learning-based approaches, as well as deployment implications in real-life emergency situations, requires further studying.
Here, we propose a damage assessment tool from a VHR imagery dataset, xBD, consisting of two complimentary CNN models that delineate building footprints and conduct multi-label classification. One promising application of this tool in emergency management would be during the response stage by providing fine-scale nadir damage degree proxies. During the recovery and relief stages, these quantitative damage proxies can be utilized in conjunction with more qualitative approaches, such as door-to-door assessments, to decide what is the overall damage and how it impacts individuals and communities.
Our results show overall high accuracies for damage presence identification ) and lend support to previous findings in the literate that utilized deep learning models in methodology design (Xu et al. Citation2019; Cao and Choe Citation2020; Gupta and Shah Citation2021; Valentijn et al. Citation2020). Unlike other arhitectures that conducted a binary classification of disaster damage (Cooner et al. Citation2016; Cao and Choe Citation2020), our approach offers more insightful predictions of multi-class damage in first response situations and is enabled by the availability of xBD big data. Whilst other research proposed a streamlined modeling approach of damage, such as Gupta and Shah (Citation2021), Xu et al. (Citation2019), ours stresses an advantage of a de-coupled approach to the concept of disaster damage assessment. If the situation necessitates a usage of existing authoritative building footprint map, OpenStreetMap or city parcel maps, emergency management authorities can effectively separate the architecture into two separate workflows and increase overall damage accuracy by only conducting the de-coupled damage classification workflow.
The first model we developed aims to delineate pre-disaster building footprint and belongs to the class of semantic segmentation models, which recognize objects of the same category as one entity. There are several potential sources of error. First, semantic segmentation can lead to some building masks contacting and merging into one another. This can be aided through the implementation of instance segmentation, which is more challenging as the output building masks must not contact (Su et al. Citation2020). An example of such an improved architecture can be an addition of two channels of building outline labels and contact points between buildings to the model input, alongside ground truth building masks. Second, the segmentation model struggles to distinguish buildings in close proximity to trees. This is a common disadvantage of using optical remote sensing without fusion with other data sources, such as radar data. Additionally, the model can struggle to distinguish entryways and roads in close proximity to buildings due to similar reflectance of rooftop materials. It is expected that introducing more input bands to the training process would enhance the segmentation accuracy.
We then propose to use these segmentation results in lieu of an official building footprint map as an input to the damage classification model. It is important to note owing to a coupled model, if emergency responders and appropriate institutions already possess an accurate georeferenced footprint of building within an impacted area, they can utilize it in place of our segmentation model as the ground-truth data. Our modified ResNet for damage classification has shown a significant overall accuracy of 86.3%. The model performance for minor and major damage classification was slightly disappointing compared to the damage presence identification. Such results can be explained by the semantical and visual similarity of these two classes and further corroborated by similar multi-label classification experiments (Gupta and Shah Citation2021; Liu et al. Citation2021). Furthermore, per-class and overall classification accuracy are expected to increase with an expansion of a training dataset to include other hurricane events besides Michael and fine-tuning the model before deployment using a small set of samples from a corresponding disaster event.
When comparing the CNN-based damage assessment approach to the shallow SVM approach, it is clear that the latter underperforms across all performance metrics. This finding can be explained by a deep learning architecture that is capable of learning very complex functions describing the data and increased predictability with larger training data sets. The process of designing input features to the SVM classifier shows that varied styles of buildings and surrounding vegetation might make it difficult to establish a unified building category solely based on variograms, necessitating the addition of Haralick texture and spectral features. The SVM struggles to distinguish between minor and major damage, suggesting again that the problem of correctly identifying these two classes is likely caused by their similarity and is common across all studied algorithms.
Overall, our results for Hurricane Michael are promising, and future work will concentrate on establishing the generalizability of the model on unseen events and geographic areas. Another direction for future research will include evaluation of model uncertainty and improvements in the segmentation model architecture, as suggested earlier. An interesting area to investigate would be a hybrid approach to damage classification that relies on both hand-crafted and learned features in deep learning, such as proposed in this research textural and structural features (Hu and Zheng Citation2019). Improvements to the building localization approach will be explored in the future work, in particular, utilizing models based on a pyramid structure to improve segmentation of multi-scale buildings in cities (Liu et al. Citation2021). Another challenge is posed by data limitation due to cloud cover in optical imagery and can be overcome by further addressing multi-source remote sensing specifically for large-scale and VHR applications like urban damage assessment.
5. Conclusions
In this study, we proposed a damage assessment workflow from VHR big data imagery, xBD, consisting of two CNNs that delineate building footprints and classify hurricane-incurred damage into four categories: un-damaged, lightly damaged, severely damaged, and destroyed buildings. The coupled model allows users to utilize an existing building footprint, unlike unified models. Another key contribution of this study was addressing a class imbalance problem in the xBD dataset with a focal loss function. We examined a case study of Hurricane Michael in 2018 around the Panama City metropolitan area, where our proposed models achieved an overall accuracy of 84.6% for building footprint segmentation and 86.3% for damage classification tasks. The model successfully identified undamaged buildings with an F1-score of 95.4% and predicts three damage classes (minor, major damage, and destroyed) with 59.3%, 68.7%, and 74.2% F1-score, respectively. An output of this model presents a probability vector of each building belonging to damage classes, thus, creating an opportunity for emergency management and first responders to set a higher or lower threshold for alerting about a hurricane damage presence. Considering the importance of this topic for decision-making and funding distribution, further experimental studies are needed to determine the transferability of this model to other geographic areas and the viability of introducing non-remote sensing geospatial data into the assessment model, such as social media data, FEMA insurance payouts, human mobility datasets, etc. While this work considered modeling of rapid hurricane damage assessment of buildings, investigating the applicational requirements of such model deployment in specific emergency response agencies can form another important avenue for future research.
Data availability statement
The data that support the findings of this study are openly available in xView2 Challenge at https://xview2.org/dataset, reference number 17.
Disclosure statement
No potential competing interest was reported by the authors.
References
- Adams B, Ghosh S, Wabnitz C, Alder J. 2009. Post-tsunami urban damage assessment in Thailand, using optical satellite imagery and the VIEWSTM field reconnaissance system. In The 1755 Lisbon Earthquake: Revisited pp. 523–539. Dordrecht: Springer Netherlands. 10.1007/978-1-4020-8609-0_32.
- Balaguer A, Ruiz LA, Hermosilla T, Recio JA. 2010. Definition of a comprehensive set of texture semivariogram features and their evaluation for object-oriented image classification. Comp Geosci. 36(2):231–240.
- Ball JE, Anderson DT, Chan CS. 2017. A comprehensive survey of deep learning in remote sensing: theories, tools and challenges for the community. J Appl Remote Sens. 11(04):1–54.
- Beven II, JL, Berg R, Hagen A. 2019. National Hurricane Center’s Tropical Cyclone Report: Hurricane Michael (AL142018). Retrieved from https://www.nhc.noaa.gov/data/tcr/AL142018_Michael.pdf.
- Cao QD, Choe Y. 2020. Building damage annotation on post-hurricane satellite imagery based on convolutional neural networks. Nat Hazards. 103(3):3357–3376.
- Chen G, Hay GJ, Carvalho LMT, Wulder MA. 2012. Object-based change detection. Int J Remote Sens. 33(14):4434–4457.
- Cheng G, Han J, Lu X. 2017. Remote sensing image scene classification: benchmark and state of the art. Proc IEEE. 105(10):1865–1883.
- Choe Y, Staneva V, Schneider T, Escay A, Haberland C, Chen S. 2021. Benchmark dataset for automatic damaged building detection from post-hurricane remotely sensed imagery. IEEE Dataport.
- Cooner AJ, Shao Y, Campbell JB. 2016. Detection of urban damage using remote sensing and machine learning algorithms: revisiting the 2010 Haiti earthquake. Remote Sens. 8(10):868.
- de Lima RP, Marfurt K. 2019. Convolutional neural network for remote-sensing scene classification: transfer learning analysis. Remote Sens. 12(1):86–106.
- Deng J, Dong W, Socher R, Li LJ, Li K, Fei-Fei L. 2009. ImageNet: a large-scale hierarchical image database. In 2009 IEEE Conference on Computer Vision and Pattern Recognition (pp. 248–255).
- Doshi J, Basu S, Pang G. 2018. From satellite imagery to disaster insights. ArXiv, abs/1812.07033,1-6.
- Endo Y, Adriano B, Mas E, Koshimura S. 2018. New insights into multiclass damage classification of Tsunami-induced building damage from SAR images. Remote Sens. 10(12):2059–2016.
- FEMA. 2016. Damage Assessment Operations Manual. Retrieved from https://www.fema.gov/media-library-data/1558541566358-30e29cac50605aae39af77f7e25a3ff0/Damage_Assessment_Manual_4-5-2016.pdf.
- GFDRR Labs. 2020. Open Cities AI Challenge Dataset. Radiant MLHub. Retrieved from.
- Goldberg H, Brown M, Wang S. 2017. A benchmark for building footprint classification using orthorectified RGB imagery and digital surface models from commercial satellites. In: 2017 IEEE Applied Imagery Pattern Recognition Workshop (AIPR) (pp. 1–7). IEEE.
- Gong J, Sui H, Sun K, Ma G, Liu J. 2008. Object-level change detection based on full-scale image segmentation and its application to Wenchuan Earthquake. Sci China Ser E Technol Sci. 51(S2):110–122.
- Gupta R, Hosfelt R, Sajeev S, Patel N, Goodman B, Doshi J, Heim E, Choset H, Gaston M. 2019. XBD: a dataset for assessing building damage from satellite imagery. ArXiv, abs/1911.09296,1-9.
- Gupta R, Shah M. 2021. RescueNet: Joint building segmentation and damage assessment from Satellite imagery. 2020 25th International Conference on Pattern Recognition (ICPR), 4405–4411.
- Haralick RM, Shanmugam K, Dinstein I. 1973. Textural features for image classification. IEEE Trans Syst Man Cybern. SMC-3(6):610–621.
- He K, Zhang X, Ren S, Sun J. 2016. Deep residual learning for image recognition. In: Proceedings of the IEEE Computer Society Conference on Computer Vision and Pattern Recognition (pp. 770–778).
- Hu Y, Zheng Y. 2019. A GLCM embedded CNN strategy for computer-aided diagnosis in intracerebral hemorrhage. ArXiv, abs/1906.02040.
- Hu Y, Tang H. 2021. On the generalization ability of a global model for rapid building mapping from heterogeneous satellite images of multiple natural disaster Scenarios. Remote Sens. 13(5):984.
- Huang X, Liu X, Zhang L. 2014. A multichannel gray level co-occurrence matrix for multi/hyperspectral image texture representation. Remote Sens. 6(9):8424–8445.
- Jiang S, Friedland CJ. 2016. Automatic urban debris zone extraction from post-hurricane very high-resolution satellite and aerial imagery. Geomat Nat Hazards Risk. 7(3):933–952.
- Johnson JM, Khoshgoftaar TM. 2019. Survey on deep learning with class imbalance. J Big Data. 6(1):1–54.
- Karpatne A, Ebert-Uphoff I, Ravela S, Babaie HA, Kumar V. 2019. Machine learning for the geosciences: challenges and opportunities. IEEE Trans Knowl Data Eng. 31(8):1544–1554.
- Kingma DP, Ba JL. 2015. Adam: a method for stochastic optimization. In 3rd International Conference on Learning Representations, ICLR 2015—Conference Track Proceedings. ArXiv, Abs/1412.6980.
- Li Y, Zhang H, Xue X, Jiang Y, Shen Q. 2018. Deep learning for remote sensing image classification: A survey. Wiley Interdiscip Rev Data Min Knowl Discov. 8(6):1–17.
- Lin TY, Goyal P, Girshick R, He K, Dollár P. 2017. Focal Loss for Dense Object Detection. In: Proceedings of the IEEE International Conference on Computer Vision (ICCV), pp. 2980–2988. ArXiv, abs/1708.02002.
- Liu T, Gong M, Lu D, Zhang Q, Zheng H, Jiang F, Zhang M. 2021. Building change detection for vhr remote sensing images via local-global pyramid network and cross-task transfer learning strategy. IEEE Trans Geosci Remote Sens. 1:1–17.
- Liu T, Yang L, Lunga D. 2021. Change detection using deep learning approach with object-based image analysis. Remote Sens Environ. 256:112308.
- Lu Z, Xu T, Liu K, Liu Z, Zhou F, Liu Q. 2019. 5M-Building: A Large-Scale High-Resolution Building Dataset with CNN Based Detection Analysis. In: 2019 IEEE 31st International Conference on Tools with Artificial Intelligence (ICTAI) (pp. 1385–1389).
- Mwange C, Mulaku GC, Siriba DN. 2018. Reviewing the status of national spatial data infrastructures in Africa. Surv Rev. 50(360):191–200.
- National Weather Service. 2019. Hurricane Michael 2018. Retrieved from https://www.weather.gov/tae/HurricaneMichael2018.
- Nemoto K, Hamaguchi R, Imaizumi T, Hikosaka S. 2018. Classification of rare building change using CNN with multi-class focal loss. In 2018 IEEE International Geoscience and Remote Sensing Symposium (pp. 4663–4666).
- Pasquali G, Iannelli GC, Dell’Acqua F. 2019. Building footprint extraction from multispectral, spaceborne earth observation datasets using a structurally optimized U-Net convolutional neural network. Remote Sens. 11(23):2803–2820.
- Pesaresi M, Gerhardinger A, Haag F. 2007. Rapid damage assessment of built-up structures using VHR satellite data in tsunami-affected areas. Int J Remote Sens. 28(13–14):3013–3036.
- Putra TYD, Sekimoto Y, Shibasaki R. 2019. Toward the evolution of national spatial data infrastructure development in Indonesia. IJGI. 8(6):263.
- Ronneberger O, Fischer P, Brox T. 2015. U-Net: convolutional networks for biomedical. Image Segmentation. In Medical Image Computing and Computer-Assisted Intervention Intervention – MICCAI 2015 pp. 234–241. Springer, Cham. https://doi.org/10.1007/978-3-319-24574-4_28.
- Stow DA, Lippitt CD, Coulter LL, Davis BA. 2015. Time-sensitive remote sensing systems for post-hazard damage assessment. In C. D. Lippitt, D. A. Stow, & L. L. Coulter (Eds.), Time-Sensitive Remote Sensing pp. 13–28. New York, NY: Springer New York. https://doi.org/10.1007/978-1-4939-2602-2_2.
- Su H, Wei S, Liu S, Liang J, Wang C, Shi J, Zhang X. 2020. HQ-ISNet: high-quality instance segmentation for remote sensing imagery. Remote Sens. 12(6):989.
- Tu J, Sui H, Feng W, Song Z. 2016. Automatic building damage detection method using high-resolution remote sensing images and 3D GIS model. ISPRS Ann Photogramm Remote Sens Spatial Inf Sci. III-8:43–50.
- Valentijn T, Margutti J, van den Homberg M, Laaksonen J. 2020. Multi-hazard and spatial transferability of a CNN for automated building damage assessment. Remote Sens. 12(17):2839–2829.
- Van Etten A, Lindenbaum D, Bacastow T. 2018. SpaceNet: a remote sensing dataset and challenge series. ArXiv, abs/1807.01232.
- Vetrivel A, Gerke M, Kerle N, Nex F, Vosselman G. 2018. Disaster damage detection through synergistic use of deep learning and 3D point cloud features derived from very high resolution oblique aerial images, and multiple-kernel-learning. ISPRS J Photogramm Remote Sens. 140:45–59.
- Waharte S, Trigoni N. 2010. Supporting search and rescue operations with UAVs. In: 2010 International Conference on Emerging Security Technologies (pp. 142–147).
- Wieland M, Liu W, Yamazaki F. 2016. Learning change from synthetic aperture radar images: performance evaluation of a support vector machine to detect earthquake and tsunami-induced changes. Remote Sens. 8(10):792.
- Wu X,Peng J,Shan J,Cui W. 2015. Evaluation of semivariogram features for object-based image classification. Geo-Spatial Information Science. 18(4):159–170. doi:10.1080/10095020.2015.1116206.
- Xu JZ, Lu W, Li Z, Khaitan P, Zaytseva V. 2019. Building damage detection in satellite imagery using convolutional neural networks. ArXiv, abs/1910.06444.
- Yan Y, Tan Z, Su N. 2019. A data augmentation strategy based on simulated samples for ship detection in RGB remote sensing images. IJGI. 8(6):276.
- Yi Y, Zhang Z, Zhang W, Zhang C, Li W, Zhao T. 2019. Semantic segmentation of urban buildings from VHR remote sensing imagery using a deep convolutional neural network. Remote Sens. 11(15):1774–1719.
- Zhong G, Ling X, Wang LN. 2019. From shallow feature learning to deep learning: Benefits from the width and depth of deep architectures. Wiley Interdiscip Rev Data Min Knowl Discov. 9(1):1–14. 10.1002/widm.1255.