
 ?Mathematical formulae have been encoded as MathML and are displayed in this HTML version using MathJax in order to improve their display. Uncheck the box to turn MathJax off. This feature requires Javascript. Click on a formula to zoom.
Abstract
Seismic disaster risk assessment results are an important way to reduce disaster losses and casualties. In this article, a seismic disaster risk assessment method is constructed based on the lethal level, and a quantitative assessment of the earthquake disaster risk in Guangzhou is carried out. There are four typical building types in this study area: brick-wood structures, brick-concrete structures, reinforced concrete structures, and civil structures. Typical building structural components (vertical load-bearing component, ring beam, mortar of infilled wall, roof or floor structure, foundation, height of building, nonstructural component, anti-seismic joint or other anti-seismic measures) are selected to build the lethal level index system of buildings. On the basis of the field survey, a lethal level of 431 survey points is obtained. The average lethal level in urban areas is 0.3476, and in rural areas is 0.4198, the overall lethal level of each township is 0.389, and the errors between the urban and rural areas are 0.0414 and 0.0308, and the fitting results coefficient of determination (R2) values are 0.6803 and 0.6714, respectively, the results is good. Furthermore, considering the seismic hazard (peak ground acceleration, PGA), population exposure and lethal level, the seismic disaster risk distribution of the Guangzhou area is determined. Under different intensities, the risk of death has shown obvious characteristics, as the intensity increases, the number of possible deaths increases rapidly, ranging from a few to several thousand, the higher risk areas are relatively fixed, generally mainly located in the central city, the quantitative assessment results of disaster risk also have obvious directivity. The areas with the highest risk are located in most areas of Tianhe District, Liwan District and Haizhu District, the highest grid death result is more than 1; the lethal level of Baiyun District and Huangpu District is low, but the death risk is also higher, generally between 0.5 and 1, in rural areas in the southern and northern regions of Guangzhou, the risk is relatively low, generally between 0 and 0.5. The distribution map of seismic disaster risk can provide solid scientific and technological support for the government to investigate potential risk points.
Introduction
Earthquakes are sudden and unpredictable, easily causing damage to buildings; additionally, secondary disasters, such as sand liquefaction, collapse, landslides, and mudslides, which often cause tremendous casualties and economic losses (Smith Citation2013). Seismic disaster risk assessment can provide an important scientific and technical basis for regional development planning, earthquake relief work, and effective reduction of casualties and property losses caused by earthquakes (Liu and Chen Citation2019). The seismic disaster risk is measured by its potential damage to buildings, as well as the number of people expected to be injured or killed, the process includes 3 steps: first, the earthquake hazard is estimated (earthquakes with probable intensity in a given geographical area); second, the damage of buildings based on different vulnerability assessment methods is evaluated; and third, based on the available data from the exposure model, the risk of losses, such as casualties and economic losses during the earthquake, is evaluated (Alexandru et al. Citation2017; Chieffo and Formisano Citation2019). At present, there are many different earthquake disaster risk research projects (Li et al. Citation2015), for example, global natural disaster hotspot projects, using the population death and economic loss recorded by historical earthquakes, the population death loss rate and economic loss rate caused by earthquake disasters as the vulnerability coefficient can be calculated, and then the coefficient with the earthquake frequency can be modified to estimate the world's earthquake disaster population death and economic loss risk level (Badal et al. Citation2005). Furthermore, for the Global Risk and Vulnerability Index Trends Program, using the data of the hazard factor intensity and the number of deaths recorded in historical earthquakes, the vulnerability of the earthquake can be calculated, and a loss function is constructed in combination with other economic indicators to estimate the average annual expected loss (UNDP. Citation2010). Apart from this, the research that addresses the indirect impact of earthquakes on communities (Miles and Chang Citation2011), which are focused on earthquake casualty estimation, such as the Interdependent Networked Community Resilience Modeling Environment (IN-CORE) which is under development as part of collaborative research work supported by the National Institute of Standards and Technology (NIST) (Milad Citation2020; Milad et al. Citation2021), the Prompt Assessment of Global Earthquakes for Response (PAGER) which is rapidly assesses earthquake impacts by comparing the population exposed to each level of shaking intensity with models of economic and fatality losses based on past earthquakes in each country or region of the world supported by the United States Geological Survey(USGS) (Jaiswal et al. Citation2011; Jaiswal and Wald Citation2008). The ultimate goal of seismic disaster risk assessment is to create a safer environment. This assessment can provide scientific support for earthquake prevention and disaster reduction planning, reduction of life and property losses, and emergency rescue after earthquakes.
Many scholars have carried out various studies on the cause mechanism of earthquakes, ground motions, building vulnerability, rapid assessment methods and disaster risk assessment. Based on different research purposes, different scholars have proposed various evaluation methods, including seismic hazard analysis (Ademovi et al. Citation2020; Ongkowijoyo et al. Citation2020; Jena et al. Citation2020a,b; Marshall Citation2020; Tsang et al. Citation2020; Zheng et al. Citation2020), building vulnerability analysis (Bessason et al. Citation2020, Citation2022; Maqsood et al. Citation2016; Gautam et al. Citation2020, Citation2021) and risk analysis (Chettri et al. Citation2021; Verderame et al. Citation2014), among them, building vulnerability assessment is a central component that includes hazard identification along with an accounting of social, cultural, economic, and built systems impacted (Bessason et al. Citation2012). Generally, the method is mainly divided into two types, qualitative methods and quantitative methods, the qualitative risk assessments are mainly based on expert knowledge, whereas quantitative risk assessments use mathematical methods (Bühlmann Citation1996; Li et al. Citation2018). Whether it is a qualitative method or a quantitative method, there is a certain degree of uncertainty; therefore, the expression and handling of fuzzy and random information is a key issue in modern risk assessment modeling (Yu Citation2017).
Although several different approaches have been developed in the world in recent years to estimate the seismic risk for whole countries or larger cities, all of these approaches are examples of very detailed studies that require a large amount of data (in particular, a detailed building database) (Bessason and Bjarnason Citation2016), which are not available in all countries. Although a greater focus has been placed on seismic hazards and vulnerability assessment in the scientific articles researched thus far, very little attention has been given to seismic exposure and the relationship to assessing seismic vulnerability. It can be said that risk assessment is a quantitative alternative to earthquake preparedness and response. The seismic disaster risk assessment process combines the results of the analyses of seismic hazards, exposed physical and social values, and seismic damage (Pavic et al. Citation2020).
Therefore, how to establish the relationship between buildings, etc. and the probability of death, and conduct risk assessment based on this, is the key to quantitative earthquake disaster risk assessment. This article is based on the lethal level obtained from field investigations, and through the improvement of the traditional earthquake disaster risk assessment model, the risk assessment method of earthquake casualties is carried out. This article is based on the lethal level of various types of buildings obtained by field investigation to obtain the overall lethal level of the area. The lethal level of area actually reflects when the area under different intensity, the possible probability of death is actually converting the probability of building damage, this reducing the uncertainty of traditional process of directly converting the proportion of building damage to the proportion of death, such as the "destroyed but not collapsed" situation of buildings after the earthquake, that is, serious damage to the building, but it does not necessarily cause death. Based on this, we can divide an area into different grid units, and each grid unit corresponds to a group of intensity personnel mortality. In this way, as long as the intensity range of each grid unit in the earthquake area is determined, it can be the rapid assessment and calculation based on the population, based on the mortality rate of each intensity represented by the lethal level, combines high-precision population data, and improves the accuracy and applicability of the results, it also provides a new idea and scientific basis for the pre-earthquake risk assessment and rapid post-earthquake assessment of earthquake casualties.
Data and method
Data
The data used in this paper include peak ground acceleration (PGA) data, historical loss data from earthquake disasters (mortality rate by intensity), grid population data, and the regional lethal level of field survey points, as shown in .
Table 1. Data resource and description.
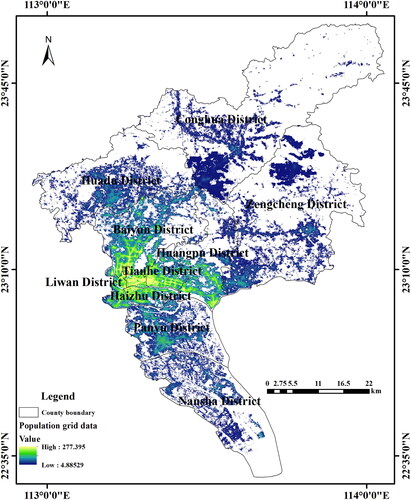
The population grid data are provided by the World Pop Project (Bondarenko et al. Citation2020), and the accuracy of the data is 0.1 km*0.1 km. The data have high accuracy and can better reflect the distribution characteristics of the population in the study area. The specific distribution results are shown in .
Figure 1. Results of the population grid distribution in the study area (0.1 km*0.1 km).
Method
The introduction highlights the need to create a reliable estimating model of earthquake losses that will cover all possible scenarios that arise during and after an earthquake. And many research groups develop a better framework, such as the principles and procedures behind seismic hazard and risk analysis (Baker et al. Citation2021), the new relationships between collapse and fatality rate, and proposing guidelines to rate functions in several quality dimensions (Porter et al. Citation2012), selected ground motion records by employing the information provided from the seismic hazard analysis (Elefante et al. Citation2010), based on different focuses, the evaluation methods and frameworks adopted are also different, based on these research results, we propose the framework of this study as shown in . The basic concept of the algorithm consists of seismic hazard evaluation, lethal level assessment, and earthquake risk assessment.
Figure 2. Technical process of the earthquake disaster risk assessment method based on the lethal level.
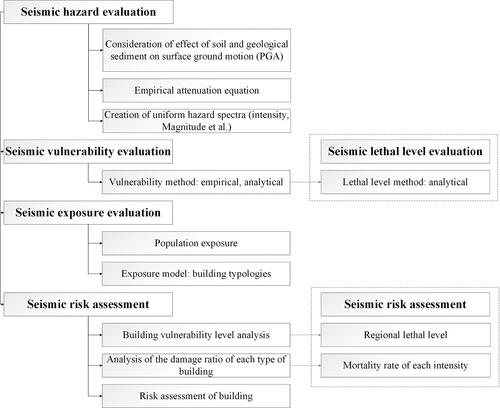
The basic process of the earthquake disaster risk assessment method is as follows: first, based on the PGA data and other parameters and the empirical attenuation model, obtain the possible intensity distribution location results in the area; second, experience or analysis methods are used to obtain the vulnerability analysis results of the area; and third, disaster risk assessment is performed based on the calculation results of the first two steps. This assessment method often only considers the possibility of different degrees of damage to the buildings in an area after the earthquake; that is, this method only considers the different degrees of damage corresponding to different mortality rates. There is no analysis of the ability of different buildings to cause casualties, which can easily cause errors.
In fact, after an earthquake, after a building is destroyed, different buildings have different possibilities of causing deaths. This difference is actually directly reflected in the mortality rate of different intensities. The lethal level and intensity in an area are different, so even at the same level of vulnerability and damage to buildings, the possibility of death is different. That is, the lethal level of an area and the intensity may together determine the level of earthquake risk. In this paper, the traditional method is changed. On the basis of obtaining the intensity distribution range in the first step, based on the lethal level in each region (districts, counties, towns), obtaining the corresponding mortality rate of the area under a certain intensity, combined with the results of high-precision population distribution, a quantitative assessment of earthquake disaster risk is carried out. Therefore, the acquisition of the lethality matrix and the regional lethal level is the key to it.
Matrix of the lethal level
The lethal level represents the comprehensive level of casualties after the earthquake. This indicates the mortality rate at different intensities. The higher the lethal level is, the higher the corresponding mortality rate at each intensity (Nie et al. Citation2020; Xia Citation2020, Xia et al. 2021). After an earthquake, the factors leading to death are very complex, including building destruction, wall collapse, gate tower collapse, falling wall hangings, rolling rocks, landslides, fires, and inadequate treatment. To comprehensively describe the possible level of deaths caused by earthquakes in various disaster areas, a new concept needs to be introduced, namely, the regional lethal level. The so-called lethal level is the comprehensive possibility of a variety of factors leading to death after a building is destroyed. It is expressed by the possible mortality rate of each intensity under a certain lethal level and under the same magnitude and intensity. Since the lethal level corresponds to the mortality rate of a component of intensity, the higher the lethal level of an area, the higher the corresponding mortality rate of the individual intensities. Therefore, this article is based on previous research results and uses the lethal level matrix as the basis for calculating the vulnerability data of personnel, as shown in (Xia Citation2020).
Table 2. Matrix based on the lethal level and intensity.
The lethality matrix in this article is mainly based on previous related research results, in the relevant literature (Xia Citation2020), the lethality matrix has been elaborated. The model construction based on historical earthquake data, such as building damage data, mortality data, etc., the damage ratio or damage probability of different types of buildings under different intensity ranges has been considered. This probability has been converted into the mortality rate of different intensities in the matrix. In fact, the traditional mechanics-based vulnerability functions focus on the damage probability of various types of buildings in different intensity areas, and then obtain the damage ratio based on the damage probability, and then calculate the number of deaths. We use the lethal level of each type to express the possibility of death caused by the destruction of buildings, this probability can be linked to intensity and mortality in terms of lethal levels. Therefore, this is also a new way of thinking and method different from traditional methods.
The seismic hazard evaluation
This article mainly adopts probabilistic seismic risk assessment (PSHA) methods, which are used to estimate the probabilities of experiencing a certain value of the selected ground motion parameter (Pavic et al. Citation2020), with the seismic hazard now being represented by PGA values. Numerous studies have also shown that there is actually a clear correlation between seismic intensity and seismic parameters. There have been many studies on the correlation between seismic intensity and ground motion parameters, such as the study of the relationship between intensity and PGA (Hershberger Citation1956; Sweny Citation2012; Tian et al. Citation2021) and research on the relationship between intensity and peak ground velocity (Ahmadzadeh et al. Citation2020; Wu et al. Citation2003). Based on different research methods, the quantitative relationship between different seismic intensities and different ground motion parameters is obtained (Baorong et al. Citation2017). Therefore, the key to earthquake disaster risk assessment is to determine the intensity level and range that the area may suffer and realize the conversion of ground motion parameters to seismic intensity.
Since PGA has been widely used in related work and research, such as earthquake disaster risk assessment and mapping, we have obtained the relationship model between PGA and seismic intensity based on related research results (Baorong et al. Citation2017), as shown in Equation (1):
(1)
(1)
where I is the intensity and PGA is the peak ground acceleration.
On this basis, the PGA of each township is converted into the corresponding seismic intensity. Based on this result, the hazard grid map with only seismic intensity information is vectorized, and a grid result of the intensity distribution is obtained. To determine the mortality rate of each grid in the study area, another major factor is the lethal level in the grid. Therefore, determining the distribution of the lethal level of the grid is the key.
Calculation method of the regional lethal level
Different building types have different probability levels to cause casualties after an earthquake. Even for the same types of buildings, due to a series of factors such as construction methods, construction materials, and construction ages, their respective lethal levels are different. Based on the range of lethal levels of different buildings, through field investigations, the lethal levels of different types of buildings are obtained. On this basis, combined with the proportion data of various types of buildings, the lethal level of an area can be obtained.
The lethal level range of different types of buildings is mainly based on the author’s previous research results, as shown in . Based on the analysis and calculation of historical earthquakes, the lethal levels of various types of buildings are obtained, and it is found that the lethal level of each type of building is a relatively fixed interval range, therefore, even for the same type of building, due to the influence of different factors such as building materials, building quality, and construction age, the actual lethal level is not completely the same, but no matter what the change, the actual lethal level is within the range of the lethal level of this type of building. At the same time, the lethal level range of various types of buildings is a non-equal interval range, and there are overlapping areas between each other, this is also consistent with the actual situation, the lethal level of a certain type of building is not necessarily lower than that of another type of building, for example, the lethal level of a brick-wood structure with a relatively good construction quality may be lower than that of a brick-concrete structure with a poor construction quality and a longer construction age (Xia Citation2020).
Table 3. The interval and influencing factors of the lethal level of buildings.
Based on the interval range of each type of building and the influence weight ratio coefficient of each influencing factor, a calculation method for the actual lethal level of each type of building is constructed, as shown in EquationEquation (2)(2)
(2) :
(2)
(2)
Among them, CLactual is the actual lethal level of a certain type of building, CLmax is the upper limit of the lethal level interval for a certain type of building, CLmin is the lower limit of the lethal level interval of a certain type of building, and n is the type of factor affecting the lethal level of a certain type of building, which is selected according to the actual conditions of different types of buildings. wi is the weight ratio coefficient of the i-th type of influencing factor in the building, and the selection is based on the actual situation of the building. wij is the weight ratio coefficient of the j-th building structure among the i-th type of influencing factor in the building, and it is selected based on the actual situation of the building.
Based on the lethal level of various types of buildings and the proportional data of each type of building, a calculation model for the overall lethal level of the survey area is established, as shown in EquationEquation (3)(3)
(3) :
(3)
(3)
where CLall is the lethal level of the region based on buildings, CLactual-i is the actual lethal level of the i-th type of building in the region, and Pi is the proportion of the i-th type of building.
On the basis of the lethal level of each survey site, a lethal level of the town-level calculation method is constructed based on the population proportion coefficient, as shown in EquationEquation (4)(4)
(4) :
(4)
(4)
where CLtown is the overall lethal level of the township administrative unit, CLtownship is the lethal level in the township area, CLcountryside is the lethal level of the village in the administrative unit of the township, α is the ratio coefficient of the population of the town to the population of the whole township, β is the ratio coefficient of the population of the administrative village to the population of the whole town, and α + β = 1.
Earthquake disaster risk model
Due to the influence of many factors such as buildings, geographical environment, and traffic roads, the lethal levels of various regions are different. Two adjacent administrative regions are in the same intensity range, but due to the different lethal levels, the corresponding mortality rates are also different. Similarly, for the same area, the lethal level is the same, but because the area is in a different intensity range, the corresponding mortality rate is also different. Based on this, each intensity can be divided into different ranges based on the lethal level, and if different regional ranges are grid-processed, then different grids correspond to different population numbers and mortality rates. Based on the mortality rate and population, an earthquake disaster risk assessment method can be carried out, as shown in EquationEquation (5)(5)
(5) :
(5)
(5)
where f(L/I) is the mortality rate of a certain grid at a certain intensity level at a certain lethal level, P is the number of people, that is, the population grid data, and D is the number of possible deaths number.
Results
The field survey method adopts the "town to town" method; that is, each administrative unit at the town level conducts a field survey, and the streets in the urban area are determined according to the town level. Each town unit selects 3–4 administrative villages as survey points. The survey points include 1 downtown area (central area) and 2–3 representative administrative villages. The contents of the survey include structural characteristics, construction methods, building materials, adhesive types, foundation types, roof types, construction years, connection methods and foundation forms of the samples of various building structures in the survey sites, as well as the geographical and geomorphic environment of the area, traffic road conditions, building ancillary structure conditions, etc.
However, because the building materials and methods in different cities are not completely the same, the types of buildings are uniformly classified according to structural materials, including the steel structure, reinforced concrete structure, brick-concrete structure (fortified brick-concrete, nonfortified brick-concrete), brick and wood structure, wood structure, civil structure and traditional structure types unique to each region (determined according to the actual situation of the survey area).
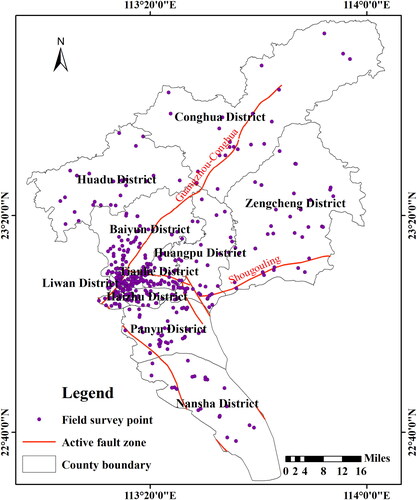
As shown in , Guangzhou city involves 11 districts and counties, including a total of 171 townships. The survey points are 431, the distribution of survey points achieves full coverage at the township level. The coverage is uniform, and the lethal level obtained by integrating the survey points of each township can represent the average situation of each town.
Figure 3. Distribution map of field survey points in Guangzhou city.
Based on the results of the field survey, the wall types of buildings in Guangzhou mainly include reinforced concrete structures, brick-concrete structures (fortified brick-concrete and nonfortified brick-concrete), brick-wood structures, and civil structures. The areas with good earthquake resistance are concentrated in the Baiyun, Huangpu and Tianhe districts, however, in the central areas of cities such as the Yuexiu, Liwan and Haizhu districts, the earthquake resistance of buildings is poor, the main reason is that although there are a large number of buildings with good construction quality, such as reinforced concrete structure in the central area of the city, there are also a large number of old brick-wood and brick-concrete structures, most of the construction time was from the 1970s to the 1990s, the building height is generally approximately 1–3 floors, the walls are mainly empty bucket walls, the wall thickness is generally 18 cm, and the roof types are mostly cast-in-roofs, with thicknesses of approximately 10 cm. In addition, most brick-concrete buildings do not have ring beams and structural columns, and the overall building quality is poor, with weak earthquake resistance and a high lethal level.
Based on the field investigation results, another obvious feature of buildings in Guangzhou is that the architectural form and quality of buildings are greatly affected by economic development. For self-built brick-concrete structures, there are a large number of buildings without structural columns, the first-floor roof is mainly a prefabricated slab roof, and with the improvement of economic level, the second floor added in the later stage is mainly cast-in-place roofs, which is also one of the reasons for the higher lethal level.
There are a large number of urban villages in the urban area of Guangzhou, and the construction age of the buildings in the urban area is generally in the 1970s and 1990s. The structural measures of the buildings are poor, there are no ring beams and no structural columns, and the building height is generally above 2 stories, another main feature is that the building spacing is small, especially in the central area where there are a large number of buildings above 5 floors, the layout of the buildings is messy and the building spacing is generally within 2 m. Another important aspect is that there are many hanging objects outside the walls of buildings, and there are a large number of nonstructural and accessory facilities such as air-conditioning external hanging objects and billboards.
The buildings in the rural areas of Guangzhou show different characteristics, the buildings are mainly brick-concrete structures, and also include civil and brick-wood structures, the walls are mostly 18 walls, and the wall bonding material is generally lime mortar or loess mud, the foundation is shallow, generally a gravel foundation of approximately 80–110 cm, the quality of the building is poor, the overall earthquake resistance of the building is not strong, and the lethal level is high, as shown in .
Table 4. Types and specific characteristics of buildings in Guangzhou.
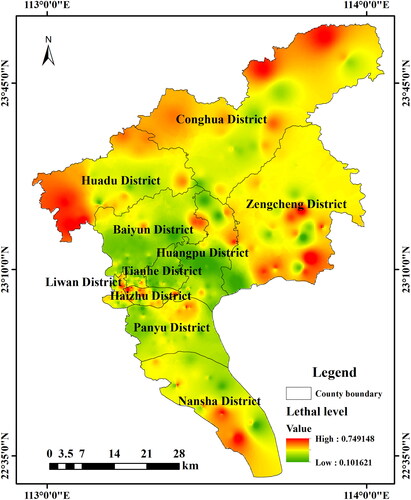
As shown in , based on the lethal level and the proportion data of each type of building in 431 survey sites, the actual lethal level of each survey site is obtained. The lethal level distribution shows obvious regional characteristics. The lethal level is relatively high in the rural area of the new city and in the urban center of the old city, and the lethal level in several other districts and counties is relatively low, this also shows a clear difference from the distribution characteristics of cities in other regions.
Figure 4. Distribution of lethality levels based on field survey results.
Based on the survey sites of each township and the population coefficients of different survey sites, the lethal level of each town is obtained, as shown in . Based on the logarithmic cumulative normal distribution function of the lethal levels in urban and rural areas, the lethal level in urban areas is much lower than that in rural areas. Among them, the average lethal level in urban areas is 0.3476, and the standard deviation is 0.1242. The average lethality level in rural areas is 0.4198, and the standard deviation is 0.117, which is also consistent with the actual situation, as shown in . Generally, the economic level of urban areas is higher than that of rural areas, and the quality of buildings and earthquake resistance are also better than those of rural areas.
Figure 5. The log cumulative normal distribution of the lethal level in urban and rural areas.
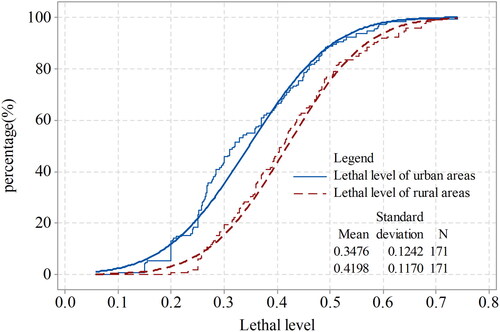
Table 5. Calculation results of the lethal level in various townships in Guangzhou.
The lethal level in urban areas is lower than that in rural areas, which does not mean that the lethal level distribution in urban areas is necessarily lower than that in rural areas. In fact, the main distribution interval of lethal level in urban areas is between 0.2–0.5, while that in rural areas is between 0.2–0.6. The reason for the difference is the influence of the population coefficient. At the same time, there are areas with relatively high lethal levels in the urban areas above 0.6. The main reason is that there are a large number of urban villages in Guangzhou, with poor construction quality and a relatively dense population.
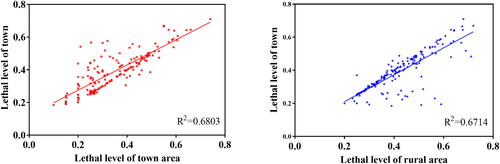
As shown in , the lethal level in the urban area is generally lower than the lethal level of each township, the combined result is good, the R2 value is 0.6803; the lethal level in rural areas is much higher than the lethal level of each township, and the R2 value is 0.6714. The distribution range of the overall lethal level of each township is more inclined to the level of the urban area. The lethal level of each township obtained through the population coefficient and the respective lethal level of the township and rural areas can also better reflect the overall level of each township. In this way, in the process of earthquake lethal risk assessment, the lethal level can also be used as a more accurate parameter to evaluate and calculate.
Figure 6. Fitting results of the overall lethal level of urban areas, rural areas and each town.
Based on the lethality matrix, it is possible to calculate the death risk in the study area under different intensity ranges. As shown in , we have calculated the number of possible deaths in the study area under different intensities based on the lethal level and the corresponding mortality data of different intensities. In general, when the study area suffered from different intensities, the overall distribution characteristics of death risk are relatively similar. Generally, they were mainly concentrated in the old urban areas located in the central area of the city, such as Liwan district, Tianhe district, Haizhu district etc. the regional distribution of death risks is relatively fixed.
Figure 7. Grid assessment results of earthquake lethal risk in Guangzhou with different intensity (a: the risk result when the study area suffers from an intensity of VI; b: the risk result when the study area suffers from an intensity of VI; c: the risk result when the study area suffers from an intensity of VI; d: the risk result when the study area suffers from an intensity of VI; e: the risk result when the study area suffers from an intensity of VI; f: the risk result when the study area suffers from an intensity of VI).
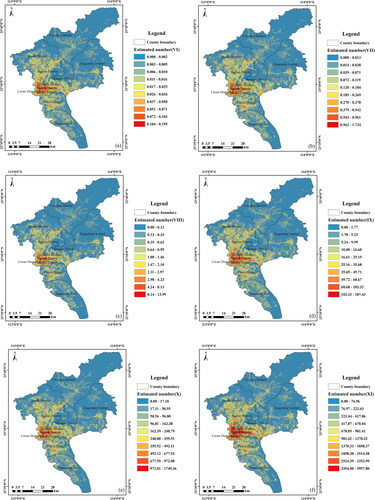
However, when the same area is subjected to different intensities, there is a big difference in the number of deaths, generally speaking, when the intensity of the study area is VI (), the highest risk of death of each grid is less than 1 person, which means that the risk of death is low or will not cause casualties; when the intensity of the study area is VII (), highest risk of death of each grid is 1.7 people, which means it may cause death, but it is usually between several people; when the intensity of the study area is VIII (), there is a significant difference in the risk of death, the highest is 14 people, which means that the risk of death is generally between dozens of people; when the intensity of the study area is IX (), the number of areas with a lower risk of death is also between 0 and 2, and should reach around 187 people, which means that the risk of death is between dozens and hundreds of people; when the intensity of the study area is X (), the highest risk of death may reach about 1750 people, which means that the risk of death is between dozens and thousands of people; when the intensity of the study area is XI (), the highest risk of death may reach about 5900 people, and the lowest risk of death is between 0 and dozens of people, which means that the risk of death is huge, based on the results of the possible death risks of different intensities in the study area, as the intensity increases, the risk of death is increases, and the location is relatively obvious, however, the calculation results based on each intensity can only reflects an overall trend in the risk of death, in fact, different regions may suffer from different levels of intensity, how to carry out targeted calculations according to different intensity ranges is the key to carrying out quantitative evaluation of the risk.
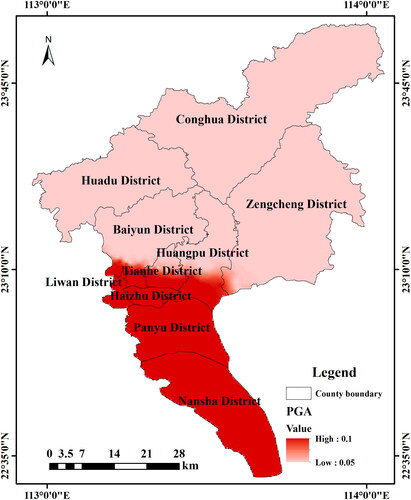
Therefore, in order to obtain a more targeted assessment result, based on the PGA of the study area, combined with the formula 1, we calculated the intensity distribution range of each area in the study area, as shown in , the distribution characteristics of PGA are more obvious, and the commission is centered at the boundary, the PGA of the southern area is 0.1, including Nansha District, Panyu District, Haizhu District, Liwan District and Tianhe District, which have a relatively high level, while the northern area, including Huangpu District, Baiyun District, Huadu District, Zengcheng District, and Conghua District, has a lower level of 0.05, there is a significant difference between the southern and northern regions. Since this article is mainly aimed at Guangzhou, the distribution map of PGA in the study area is mainly calculated based on the actual value of each township unit, fatalities can be better correlated with local scale PGA (site-specific) analysis since site characteristics are very much dominant when collapse or severe damage to structures is concerned, but because the final risk analysis results in this article are also for the entire city, Therefore, we did not perform local scale PGA analysis, at the same time, for a city, the PGA parameters at the township level are more in line with the actual scale.
Figure 8. PGA distribution results in Guangzhou.
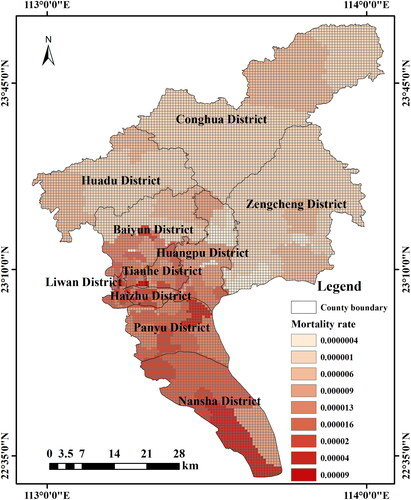
Based on the PGA distribution, combined with Formula 1, the intensity distribution range of the study area is obtained, and on this basis, the mortality rate of each area is obtained based on the lethality matrix. As shown in , based on the grid distribution result of the lethal level and intensity of each township, the mortality rate corresponding to each grid is obtained. Under different intensity levels, the mortality rate is different, including 9 levels. Areas with relatively high mortality rates are mainly concentrated in 3 urban areas, namely, Liwan District, Tianhe District, and Haizhu District, as well as some townships in Panyu District and Nansha District. The mortality rate is generally more than 0.000013. The mortality rate in counties is relatively low, generally below 0.000009. In general, the mortality rate in the southern region was higher than that in the northern region.
Figure 9. The grid distribution results of the mortality rate of various townships in Guangzhou.
Based on the mortality rate and population data of each grid, the results of the death risk of an earthquake are obtained. Since the population distribution accuracy is 0.1 km*0.1 km, the data accuracy is relatively high. However, for earthquake disaster risk assessment, such data accuracy has been able to meet the requirements. At the same time, because the lethal level obtained in this paper is based on the field survey results of the survey points at the administrative village level, relative to the population data accuracy, the granularity is relatively coarse. In fact, the lethal level according to the grid of 1 km*1 km can also reflect the distribution characteristics. Therefore, we will also use the population grid data according to the data accuracy of 1 km*1 km.
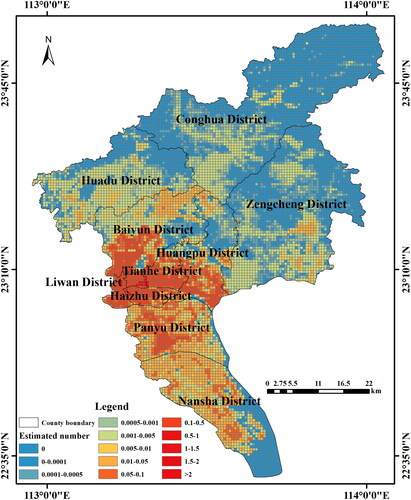
As shown in , it is found that the areas with a higher risk of death are mainly concentrated in urban areas such as Liwan District, Yuexiu District, Haizhu District, Changhua Street in Liwan District, Longfeng Street in Haizhu District, and Dongshan Street in Yuexiu District; the maximum number of deaths in the grid population is more than 2 people. However, the results in Huadu District, Conghua District and Zengcheng District are relatively small compared to the old city, and the average value is basically 0-1. At the same time, there are also a large number of low disaster risk areas in this area, and there may be no casualties after the earthquake.
Figure 10. Grid assessment results of earthquake lethal risk in Guangzhou.
Discussion
Traditional earthquake disaster risk assessment methods are mostly based on the vulnerability level of buildings and are combined with other relevant data to carry out risk assessments (Del Gaudio et al. Citation2017). Due to the limitation of the selected parameters, most of the disaster risk results are expressed in terms of risk levels, and it is difficult to obtain quantitative assessment results. At the same time, due to the relatively large number of parameters selected by traditional methods, the results are more redundant, especially for the assessment of the risk of casualties, most of the calculations are based on the vulnerability level of the building, and the lack of the ability of different building types to cause casualties under the same damaged state will also increase the error.
The basis of this method is the lethal level of the area, different regions are affected by factors such as buildings and the geographical environment and have different regional lethal levels, which represents mortality rates of different intensities. That is, the lethal level is the same in two different areas; if it is in a different intensity range after the earthquake, then the mortality rate is also different. Therefore, based on the PGA and the lethal level, the possible mortality rate for each grid is determined, and the result is combined with high-precision population grid data to evaluate the number of possible casualties.
This paper selected 431 survey points to conduct a field survey in Guangzhou, and obtained the lethality level of 171 township units based on calculations, integrated with additional data about the location and dimension of buildings collected during independent field surveys, the lethal level of the area is more accurate, and it is in line with the actual situation. The accuracy of the data can provide support for the quantitative assessment of earthquake disaster risk.
The overall quality of buildings in Guangzhou is good, and the earthquake resistance is strong. The areas with low lethal levels are concentrated in the districts and counties in the middle of the city, especially in the newly developed districts and counties that have been built in recent years, such as Baiyun District and Huangpu District. In contrast, the old urban areas of Guangzhou, such as Tianhe, Liwan, and Haizhu District, with poor economic development, have a relatively high lethal level, one of the main reasons is that there are more urban villages in these districts and counties, additionally, the construction is old, the structural measures are incomplete, the construction quality is poor, and the earthquake resistance is low.
The average level in urban areas is 0.3476, and the average level in rural areas is 0.4198. That is, the levels of urban areas and rural areas are actually not much different. Combining the population proportion coefficients in urban and rural areas, the overall lethal level of each township is obtained. The results indicate that the average lethal level of townships is 0.389, and the errors between the urban and rural areas are 0.0414 and 0.0308, respectively, which are relatively small. On the other hand, through the fitting analysis of the lethal level in urban areas and rural areas and townships, it is found that the fitting results coefficient of determination (R2) values are 0.6803 and 0.6714, respectively; these results are also relatively good.
Based on the mortality rate of each grid, it was found that the high mortality rate in Guangzhou was mainly distributed in the southern region, including some townships in Tianhe District, Liwan District, Huangpu District and Baiyun District, Panyu District and Nansha District. The mortality rate is generally between 0.000009–0.00009, while the areas with relatively low mortality rates are concentrated in parts of Huadu District, Conghua District, Zengcheng District and Baiyun District, which is generally between 0.0000004–0.000009. The mortality rate of some towns in the central area of Guangzhou is much higher than that of other regions. The main reason is that the intensity is relatively high, and the other is that the lethal level in the old city areas is relatively high.
In the study area under different intensities, the characteristics of death risk are relatively obvious, and the distribution locations are relatively concentrated, under different intensity situations, there are obvious differences in the quantitative results of death risk, generally speaking, when the intensity is VI, the death risk is relatively small, and it can be regarded as no casualties under normal circumstances; with the increase in intensity, the death risk is increasing, the maximum risk is as follows, degree VII, between a few people; degree VIII, between dozens of people; degree IX, around a hundred people; degree X, around a thousand people; degree XI, around thousands, different intensities have different death risks, but the location distribution of high-risk areas is relatively concentrated, mainly concentrated in the old urban areas located in the central area of the city, such as Liwan district, Tianhe district, Haizhu district etc.
However, based on the intensity distribution of each area obtained based on the PGA, the death risk of earthquake in the study area are significantly different, the risks of different regions are also quite different. First, for Tianhe District, Liwan District and Haizhu District in the center of the city, the result of the risk of death is still relatively high, generally above 1. Second, in Panyu District and Nansha District, where the mortality rate is relatively high, there is a large difference in the risk assessment results; the risk is at a medium level, generally between 0.1 and 1. Third, the risk of Huadu District, Conghua District and Zengcheng District showed obvious differences; the results of most areas is 0, and the risk is at a medium level, generally between 0-0.1.
Conclusions
In this work, we improved the traditional method and proposed a quantitative assessment method based on the level of regional lethal. Compared with traditional evaluation methods, the method transforms the vulnerability level into a lethal level.
The methodology is based on the structural characteristics of building data from the field survey to define the lethal level and based on the PGA to evaluate the seismic capacity, Infill elements are included in the model.
The determination of mortality is mainly based on the lethality matrix constructed by the previous research. Based on the intensity range and lethal level corresponding to each grid in the study area, the mortality rate of each grid is determined. This mortality rate actually refers to the probability of death for the grid to experience different intensities.
Analytical results showed good agreement with the field survey, the distribution of lethal levels in Guangzhou showed obvious regional characteristics, the lethal level of newly developed and constructed districts and counties in central Guangzhou are generally below 0.3. The lethal level of the districts and counties in the center of cities with more developed economies are generally above 0.6. The lethal level in rural areas with an average value above 0.4.
The distribution characteristics of PGA are more obvious, showing obvious north-south differences. With Tianhe District and Huangpu District as the boundary, the southern area is higher than the northern area. The mortality rate of each grid determined by the lethal level and the PGA is significantly different, the areas with higher mortality are mainly concentrated in the central city and parts of the south, while the mortality rate in the northern region is generally lower.
Under different intensities in the study area, the risk of death has shown obvious characteristics. As the intensity increases, the number of possible deaths increases rapidly, ranging from a few to several thousand. At the same time, the higher risk areas are relatively fixed, generally mainly located in the central city, combine high-precision population data, the quantitative assessment results of disaster risk also have obvious directivity. The areas with the highest risk are located in most areas of Tianhe District, Liwan District and Haizhu District. The highest grid death result is more than 1. The lethal level of Baiyun District and Huangpu District is low, but the death risk is also higher, generally between 0.5 and 1. In rural areas in the southern and northern regions of Guangzhou, the risk is relatively low, generally between 0 and 0.5.
The lethal level provides a feasible way to quantitatively assess earthquake risk. The application of the lethal level can usefully support the validation of its reliability in view of further applications to large scale seismic risk analyses, which may reduce the errors caused by qualitative expression of various factors, and more accurate quantitative evaluation results can be obtained.
Disclosure statement
The authors have no conflicts of interest to declare that are relevant to the content of this article.
Data availability statement
The data that support the findings of this study are available from the corresponding author, Chaoxu Xia, upon reasonable request.
Additional information
Funding
References
- Ademovi N, Hadzima-Nyarko M, Zagora N. 2020. Seismic vulnerability assessment of masonry buildings in Banja Luka and Sarajevo (Bosnia and Herzegovina) using the macroseismic model. Bull Earthquake Eng. 18(8):3897–3933.
- Ahmadzadeh S, Doloei GJ, Zafarani H. 2020. Ground motion to intensity conversion equations for Iran. Pure Appl Geophys. 177(11):5435–5449.
- Alexandru B, Lucian R, Ionel M, Adrian G. 2017. Towards urban resilience: a multi-criteria analysis of seismic vulnerability in Iasi city (Romania). Sustainability. 9(2):270.
- Badal J, Vzquez-Prada M, Gonzlez L. 2005. Preliminary quantitative assessment of earthquake casualties and damages. Nat Hazards. 34(3):353–374.
- Baker J, Bradley B, Stafford P. 2021. Seismic hazard and risk analysis. London: Cambridge University Press.
- Baorong D, Jingjiang S, Ke D, Huan L. 2017. Study on relationships between seismic intensity and peak ground acceleration, peak ground velocity. Earthquake Eng Eng Dyn. (02):26–36.
- Bessason B, Bjarnason JÖ. 2016. Seismic vulnerability of low-rise residential buildings based on damage data from three earthquakes (Mw6.5, 6.5 and 6.3). Eng Struct. 111:64–79.
- Bessason B, Bjarnason JÖ, Gudmundsson A, Sólnes J, Steedman S. 2012. Probabilistic earthquake damage curves for low-rise buildings based on field data. Earthquake Spectra. 28(4):1353–1378.
- Bessason B, Bjarnason JÖ, Rupakhety R. 2020. Statistical modelling of seismic vulnerability of RC, timber and masonry buildings from complete empirical loss data. Eng Struct. 209:109969..
- Bessason B, Rupakhety R, Bjarnason JÖ. 2022. Comparison and modelling of building losses in South Iceland caused by different size earthquakes. J Build Eng. 46:103806..
- Bondarenko M, Kerr D, Sorichetta A, Tatem AJ. 2020. Census/projection-disaggregated gridded population datasets, adjusted to match the corresponding UNPD 2020 estimates, for 183 countries in 2020 using Built-Settlement Growth Model (BSGM) outputs. World Pop, University of Southampton, UK.
- Bühlmann H. 1996. Mathematical methods in risk theory. Berlin: Springer.
- Chettri N, Gautam D, Rupakhety R. 2021. Seismic vulnerability of vernacular residential buildings in Bhutan. J Earthquake Eng.:1–16.doi:10.1080/13632469.2020.1868362
- Chieffo N, Formisano A. 2019. Geo-hazard-based approach for the estimation of seismic vulnerability and damage scenarios of the old city of Senerchia (Avellino, Italy). Geosciences (Switzerland). 9(2):59.
- Ongkowijoyo C, Doloi H and Gurmu A. 2020. Hybrid risk analysis model for analyzing the urban infrastructure risk – ScienceDirect. Int J Disaster Risk Reduct. 48:1-12. doi: 10.1016/j.ijdrr.2020.101600.
- Del Gaudio C, Ricci P, Verderame GM, Manfredi G. 2017. Urban-scale seismic fragility assessment of RC buildings subjected to L'Aquila earthquake. Soil Dyn Earthquake Eng. 96:49–63..
- Elefante L, Jalayer F, Iervolino I, , Manfredi G. 2010. Disaggregation-based response weighting scheme for seismic risk assessment of structures. Soil Dyn Earthquake Eng. 30(12):1513–1527..
- Gautam D, Adhikari R, Rupakhety R. 2021. Seismic fragility of structural and non-structural elements of Nepali RC buildings. Eng Struct. 232:111879..
- Gautam D, Adhikari R, Rupakhety R, Koirala P. 2020. An empirical method for seismic vulnerability assessment of Nepali school buildings. Bull Earthquake Eng. 18(13):5965–5982.
- Hershberger J. 1956. A comparison of earthquake accelerations with intensity ratings. Bull Seismol Soc Am. 46(4):317–320.
- Jaiswal K, Wald DJ. 2008. Creating a global building inventory for earthquake loss assessment and risk management. US geological survey open-file report-1160. Reston, VA: US Geological Survey; p. 103.
- Jaiswal K, Wald D, D'Ayala D. 2011. Developing empirical collapse fragility functions for global building types. Earthquake Spectra. 27(3):775–795.
- Jena R, Pradhan B, Beydoun G, Nizamuddin A, Sofyan H, Affan M. 2020a. Integrated model for earthquake risk assessment using neural network and analytic hierarchy process: Aceh Province, Indonesia. Geosci Front. 11(2): 613–634. doi:https://doi.org/10.1016/j.gsf.2019.07.006
- Jena R, Pradhan B, Beydoun G, Al-Amri A, , Sofyan H. 2020b. Seismic hazard and risk assessment: a review of state-of-the-art traditional and GIS models. Arab J Geosci. 13(2):50.
- Li M, Hong M, Ren Z. 2018. Improved Bayesian network-based risk model and its application in disaster risk assessment. Int J Disaster Risk Sci. 9(2):237–248.
- Liu X, Chen H. 2019. Integrated assessment of ecological risk for multi-hazards in Guangdong province in Southeastern China. Geomatics Nat Hazards Risk. 10(1):2069–2093.
- Li M, Zhenhua Z, Peijun S, Jingai W. 2015. World earthquake disaster risk assessment. J Nat Disasters. 24(05):1–11.
- Maqsood T, Edwards M, Ioannou I, Kosmidis I, Rossetto T, Corby N. 2016. Seismic vulnerability functions for Australian buildings by using GEM empirical vulnerability assessment guidelines. Nat Hazards. 80(3):1625–1650..
- Marshall T. 2020. Risk perception and safety culture: Tools for improving the implementation of disaster risk reduction strategies. Int J Disaster Risk Reduct. 47:101557.
- Milad R, van de Lindt JW, Rosenheim N, Hu Y, Cutler H. 2021. Implication of building inventory accuracy on physical and socio-economic resilience metrics for informed decision-making in natural hazards. Struct Infrastruct Eng. 17(4):534–554.
- Milad R. 2020. Performance-based seismic monitoring of instrumented buildings [Ph.D. Dissertation]. Department of Civil and Environmental Engineering, University of Vermont, Vermont. https://scholarworks.uvm.edu/graddis/1140.
- Miles SB, Chang SE. 2011. ResilUS: A community-based disaster resilience model. Cartograph Geograph Inf Sci. 38(1):36–51.
- Nie G, Chaoxu X, Xiwei F. 2020. Grading of anti-lethal level based on historical earthquake mortality data. Chin J Geol. 55(4):1298–1314.
- Pavic G, Hadzima-Nyarko M, Bulajić B. 2020. A contribution to a UHS-based seismic risk assessment in Croatia – a case study for the city of Osijek. Sustainability. 12(5):1796.
- Porter KA, Farokhnia K, Cho IH, Grant D, Jaiswal K, Wald D, Noh H. 2012, September. Global vulnerability estimation methods for the global earthquake model. In 15th World Conference on Earthquake Engineering, Lisbon, Portugal; p. 24–28.
- Smith K. 2013. Environmental hazards: assessing risk and reducing disaster. London: Routledge; p. 148.
- Sweny A. 2012. Relationships between earthquake ground motions and modified Mercalli intensity. Electronic Thesis and Dissertation Repository. 368. London, Ontario, Canada. https://ir.lib.uwo.ca/etd/368
- Tian X, Zengping W, Weidong Z, Jie Y. 2021. New ground motion to intensity conversion equations for china. Shock Vib. 2021(1):1–21.
- Tsang HH, Daniell JE, Wenzel F, Wilson JL. 2020. A universal approach for evaluating earthquake safety level based on societal fatality risk. Bull Earthquake Eng. 18(1):273–296.
- UNDP. 2010. Human development report. New York: New York Oxford University Press.
- Verderame GM, Ricci P, De Luca F, Del Gaudio C, De Risi MT. 2014. Damage scenarios for RC buildings during the 2012 Emilia (Italy) earthquake. Soil Dyn Earthquake Eng. 66:385–400..
- Wu YM, Teng TL, Shin TC. 2003. Relationship between peak ground acceleration peak ground velocity, and intensity in Taiwan. Bull Seismol Soc Am. 93(1):386–396.
- Xia C. 2020. Research on lethal assessment technique of earthquake death based on field investigation. Institute of Geology, China Earthquake Administration, Beijing.
- Xia C, Gaozhong N, Xiwei F, Junxue Z, Huayue L, Xiaoke P. 2020. Research on the rapid assessment of earthquake casualties based on the anti-lethal levels of buildings, Geomatics. Nat Hazards Risk. 11(1):377–398.
- Yu LY. 2017. Discussion of uncertainty risk theory. Mod Occup Saf. 3:75–77. in Chinese).
- Zheng H, Guo L, Liu J, Zheng T, , Deng Z. 2020. Evaluating seismic risk in small and medium-sized cities with the modified vulnerability index method, a case study in Jiangyou City, China. Bull Earthquake Eng. 18(4):1303–1319.