
 ?Mathematical formulae have been encoded as MathML and are displayed in this HTML version using MathJax in order to improve their display. Uncheck the box to turn MathJax off. This feature requires Javascript. Click on a formula to zoom.
Abstract
Himalayan mountain ranges separate the Tibetan plateau from the Indian subcontinent, where challenging topography, ongoing orogeny, and weather conditions are significant factors behind mass movements. The detachment of a composite rock-ice mass occurred on 7-Feb-2021 over the north-eastern slope of the Trisul mountain resulting in devastation along the Rishiganga-Dhauliganga valley, Uttarakhand. In this study, an attempt is made to understand the failure mechanism of the overhang wedge, where prolonged glacial mobility is seen as a possible factor behind the formation of such a structure. The temporal movement (2020–2021; annual & seasonal) of metamorphosed ice is assessed using sub-pixel offset tracking of Sentinel-1A-GRD data. Kinematic analysis checks failure susceptibility due to joint sets within the rockmass. Slope stability analysis is performed using probabilistic back analysis for three values of coefficient of variation (CoV), i.e., 10%, 15%, and 20% considering cohesion (c) and angle of internal friction (ϕ) as random variables. The detachment impact is quantified using rockfall simulation and parameters such as maximum bounce height, total kinetic energy, and translational velocity. Finally, probabilistic analysis of parameters is performed that may be useful in developing a mitigation system.
1. Introduction
The great Himalayan ranges, also spelled as the third pole, are a classic example of the youngest mountain ranges. It gained its origination from the tectonic collision of Indian and Eurasian plates between the upper Eocene period (65 Ma) and middle Miocene period (25 Ma) (Yin and Harrison Citation2000; Kumar et al. Citation2021). Situated near the tropic of cancer and away from the polar extremities of the globe, it encompasses massive storage of freshwater in its glaciated form, covering an area of more than 37,000 sq. km (Raina and Srivastava Citation2008). Over the past few decades, the western Himalayas have portrayed glacial expansion and mass gain (Copland et al. Citation2011; Bolch et al. Citation2012). Studies reveal that prolonged glacial expansion and mass gain episodes could be significant reasons behind surging (Quincey et al. Citation2011). Added to this, mass movement (Kargel et al. Citation2016), and slope instability (Panikkar and Subramanyan Citation1997) frequently occur in the western Himalayan region due to neotectonic and structural activities along the zone of main boundary thrust (MBT) (Valdiya and Bartarya Citation1989; Valdiya Citation2003) and the presence of highly fragmented, sheared and crushed rocks (Kumar et al. Citation2017) as well as steep slopes (Paul and Mahajan Citation1999). The Uttarakhand Himalayan region has witnessed more than 15 life-threatening hazards in the last 30 years, including earthquakes, landslides, avalanches, and flash floods (Bhambri et al. Citation2016). The 1998 Malpa rockfall (Pant and Luirei Citation1999), the 2001 Phata Byung landslide (Naithani et al. Citation2002), the 2012 Asia Ganga landslide (Gupta et al. Citation2013), and many more have devastatingly affected the Uttarakhand Himalayas. One classic example is the 2013 Kedarnath incident, where more than 5000 people died due to a breach of a high-altitude moraine-dammed lake (Allen et al. Citation2016; Champati Ray et al. Citation2016).
In the process of understanding natural hazards triggered in the high altitude Himalayan locations, field investigation is restricted due to challenging terrain and harsh weather conditions. Therefore, airborne and spaceborne-remote sensing datasets coupled with numerical modelling serve as an effective tool for analyzing and quantifying plausible factors behind a natural hazard (Ambrosi et al. Citation2018; Kääb et al. Citation2018). The advantage of remote sensing data and numerical modelling has been utilized to identify the significant factors responsible for the Kedarnath incident (Champati Ray et al. Citation2016) and the Balia Nala landslide in Nainital, Uttarakhand (Kumar et al. Citation2017). The study reveals the neotectonic activity and discontinuities in the rockmass such as joints, shear zones, and faults affect the slope’s stability. Kääb et al. (Citation2018) studied glacial surges and avalanches in western Tibet in 2016 using a combined approach of satellite remote sensing, field investigation, and numerical modelling. The findings explain the role of weather- and climate-driven external forcing as a factor behind the substantial reduction of basal friction that acts as a resisting force and holds the glacial tongues frozen to the ground/bed. Using the analytical hierarchy process in conjunction with remote sensing helped in the effective demarcation of potential avalanche-prone areas in various locations of the western Himalayas (Snehmani et al. Citation2014; Sethya et al. Citation2018). Nath et al. Citation2021 used a combination of multivariate logistic regression protocol, machine learning, and analytical hierarchy process to understand the slope failure mechanism of Darjeeling-Sikkim Himalayas through remote sensing, geographical information system (GIS), geotechnical and geophysical investigations, and numerical modelling.
Unfortunately, on 7th February 2021, a hazard cascade was triggered because of a massive avalanche due to the detachment of a rock-ice composite wedge structure from the north-eastern slope of Trisul mountain. The incident caused the death of more than 200 people downstream of Rishiganga and Dhauliganga valley (Shugar et al. Citation2021; Rana et al. Citation2021; Rao et al. Citation2021). The region also witnessed colossal damage to infrastructure, including two hydel power projects in the valley (Shrestha et al. Citation2021). Post-incident photographs captured from the helicopter survey on 12th February 2021 helped gather first-hand information of the mountain slope and Ronti gad. Studies conducted using high-resolution satellite imagery, and seismic signals from the local seismic networks confirm the collision of the glacial block with the valley floor followed by another block (Meena et al. Citation2021a). Several factors such as the topography of the area, heavy precipitation before the incident, long-term rise in air temperature, and change in the local climatic conditions were anticipated to be responsible for the rock-ice avalanche (Thayyen et al. Citation2021; Shugar et al. Citation2021). Investigations conducted using multiple satellite imagery of decade span and 3D geometrical model helped understand the progressive destabilization, top-corner cracks, and bergschrund breaking (Mao et al. Citation2022). The time series analysis conducted using Persistent Scatterer Interferometry (PSI) SAR technique captured an increment in the ground deformation considered responsible for the expansion of cracks lying in the vicinity of Vaikrita Thrust (VT), thus failure (Kothyari et al. Citation2022). Pandey et al. (Citation2022) observed an increment in the solar radiation and substantial changes in the temperature of the displaced material of the rockslide responsible for the instability of glacial blocks causing the failure. Studies conducted for the impact of the disaster using optical and microwave datasets helped capture changes in the water quality of Rishiganga and the flood plains (Meena et al. Citation2021b; Meena et al. Citation2021c). In this study, an attempt has been made to identify the formation mechanism and plausible triggering mechanism of the detachment from the north-eastern slope of Trisul mountain with the help of Synthetic Aperture Radar (SAR) datasets, kinematic and probabilistic back analysis of the failed slope. In addition, rockfall simulation with probabilistic analysis of identified parameters has been conducted that has the potential to be used while planning mitigation measures in the near future.
2. Study area
Western Himalayas, also called the Punjab Himalayas, are spread around 350 miles from Sutlej in the southeast to the Indus River in the northwest. It comprises of the Dhaola Dhar, Karakoram, Pir Panjal, Ladakh, Zarkar and parts of the Shiwalik ranges. The terrain can be distinguished into two categories: the southern slopes are steep and rugged, while the northern slopes are bare and gentle. Based on tectonic zonation, the western Himalayas are divided into Tethys, Trans, Lesser, Higher, and Outer Himalayas. In the western Himalayas, the Rishiganga catchment comprises ∼690 sq. km with several large valleys and hanging glaciers such as Changband, Hanuman, Trisul, Bethartoli, Ronti, and many more (Rana et al. Citation2021). The region has a rugged topography ranging between ∼1200 and ∼7800 m asl. Eight peaks enclose the catchment, with Nanda Devi the second highest peak rising to ∼7846 m asl. The region is prone to avalanches due to hanging glaciers with steep slopes, leading to ice calving from the glacier's terminus (Pralong and Funk Citation2006; Margreth et al. Citation2017). The region along the Rishiganga and Dhauliganga valley lies between the VT and the South Tibetan Detachment (STD), having weathered, pulverized, and fragmented rock strata (Rana et al. Citation2021). The area’s formations are mainly composed of muscovite-schist, Kyanite-biotite, leucogranite, and gneiss (Mukherjee et al. Citation2019). The area’s geology belongs to high-grade metamorphic rocks of the Vaikrita group.
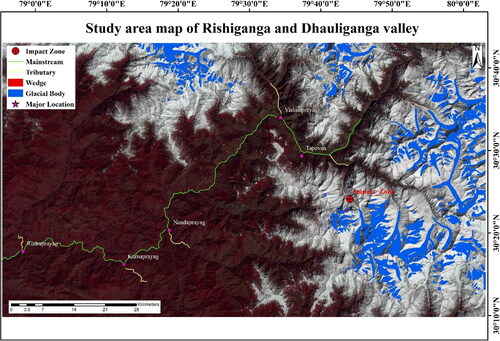
Ronti glacier falls in the category of the hanging glacier that lies adjacent to Nanda Gunti (6390 m asl) to its east and Trisul (7120 m asl) to its west. It is a northward-flowing glacial body with the main trunk (∼6 km long) and three connecting flanges accounting for a total area of about 11.8 sq. km. The snout of the Ronti glacier lies at an elevation of ∼4100 m asl, with its ablation zone characterized by crescentic crevasses, discernible traverse, fine-textured debris, and supraglacial lakes with an area of not more than 500 sq. m. Studies conducted using topographic maps and satellite datasets have suggested that two different categories of the moraine cover the glacier. One is vegetation-covered (conifer, juniper, birch, etc.) older moraine, mainly observed below ∼3000 m asl and characterized by the rolling crest. Another is non-vegetated or poorly vegetated fresh moraine, followed until the glacier’s snout and characterized by a sharp ridge (Rana et al. Citation2021). Down the valley, where the older moraine culminates, the morphology of the valley is steeper, and the river flows through the gorge with large boulders. The study area falls within the Alaknanda catchment on the north-eastern slope of Trisul mountain, standing beside the valley of the Ronti glacier ().
Figure 1. Standard False Color Composite (FCC) map of the study area highlighting impact location.
2.1. Rock-ice wedge failure
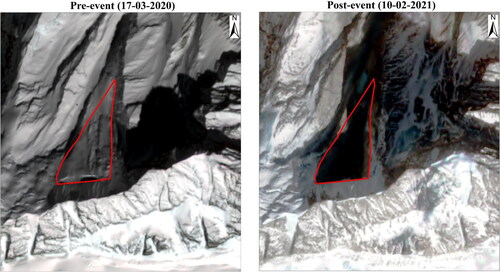
It was on 7th February 2021 (10:21 IST) that a significant rock-mass and glacial ice (79°43‵53.61□E, 30°22‵40.56□N; GLIMS ID: G079733E30381N) dissociated from the northern slope of Trisul mountain resulting in an avalanche with an average velocity ranging from 127 to 134 miles per hour ( and ). The dimensional analysis of pre and post-event using high-resolution satellite imageries and a digital elevation model (DEM) of the mountain slope revealed that a prismatic wedge (∼74 m deep) with a triangular face (850 m × 550m) accounting for about 60 million metric tonnes (80% rock and 20% metamorphosed ice) of mass crashed over the Ronti gad valley floor [report from Glacier and Permafrost Hazards in Mountains (GAPHAZ, Citation2021)]. It had a tremendous amount of potential energy (∼0.93 Petajoules) stored at an elevation of 5500 m asl and 1742 m above the valley floor (Pandey et al. Citation2021). Failure of rock profile above the wedge top was detected in 2016 with the help of feature tracking. Ongoing displacement of rock blocks has been observed in the subsequent years, with magnified displacement in the summer season of 2017 and 2018 (Shugar et al. Citation2021). This phenomenon opened an 80 m wide crevasse in the glacial ice and rock mass underneath above the topmost part of the wedge, confirming the instability and rockfall susceptibility of the north-eastern slope of Trisul mountain. Studies conducted using post-event satellite imagery explain the free suspension of the structure from the slope face. The avalanche might be airborne initially for a short period as the lower segment of the eastern glacier seems intact. No sign of abrasion is registered due to the movement of composite mass avalanche over it. Once the free-falling avalanche hits the valley floor of Ronti gad, the next episode of splash deposits begins (Orwin et al. Citation2004; Mitchell et al. Citation2020). High potential energy gained by the rock and ice avalanche soon gets converted into kinetic and thermal energy (frictional heating of ice), transforming it into very dynamic debris flow down the valley in the north-western direction (Shugar et al. Citation2021). The debris comprises boulders, ice blocks, meltwater, and sediments. These large boulders played a significant role in forming a ∼40 m thick debris-dammed reservoir where Ronti gad confluences with the Rishiganga river. With time, a free-flowing river gets transformed into a ∼700 m long lake upstream of Rishiganga valley that soon fails. This results in a flash flood, thus vandalizing two hydel power projects in the Dhauliganga and Rishiganga valleys and causing loss of life and property (Pandey et al. Citation2021; Shugar et al. Citation2021).
Figure 2. Image representing slope and impact location (Google Earth Pro image of 11-Feb-2021).
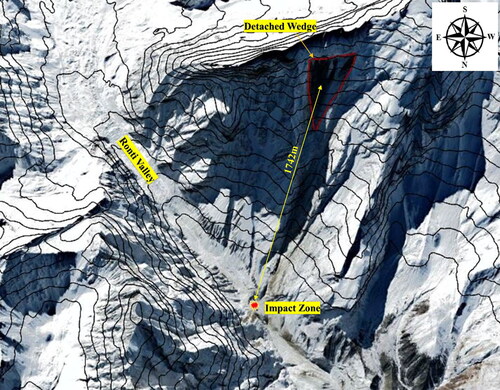
Figure 3. Wedge structure captured by Sentinel-2 MSI.
3. Data and methodology
3.1. Datasets and tools
In this study, Sentinel 1 level-1 GRD (Ground Range Detected) datasets () have been used to derive surficial mobility using SAR sub-pixel offset tracking on a seasonal and annual basis for the glacial bodies [Randolph Glacial Inventory (RGI 6.0); RGI Consortium Citation2017) present in the study area. The Sentinel-1 mission consists of a pair of near polar-orbiting satellites, Sentinel-1A/B acquiring data using a C-band SAR instrument in dual (HH + HV, VV + VH) and single (HH, HV) polarization, with a revisit time of 6 days (Filipponi Citation2019). The used GRD product consists of focused SAR data being detected, multi-looked, and projected to ground range using the Earth ellipsoid model (Sentinel-1 Team Citation2013). However, the product is rectified using terrain height that is constant in range but varying with azimuth. The multi-look GRD imagery consists of speckle reduced square pixels representing the sensor detected amplitude information, excluding the phase information. In addition, the topographic features around the location of failure have been visualized using Google Earth Pro imagery and Advanced Land Observing Satellite (ALOS) Phased Array Type L-Band Synthetic Aperture Radar (PALSAR) DEM. The kinematic analysis, numerical modelling, and rockfall simulation have been performed using the modules of Rocscience software (Dips v7.0, Slide, RS2, and Rockfall 6.0).
Table 1. Details of offset-tracking pairs from Sentinel-1A.
3.2. Methodology
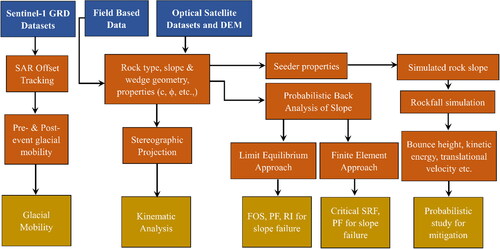
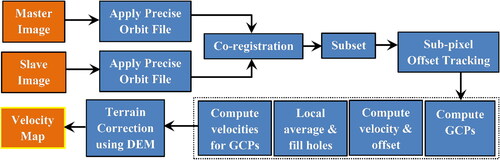
The adopted methodology has been presented in four distinct stages (). Stage one is for determining the surficial mobility of the Ronti glacier and triangular wedge over the north-eastern slope of Trisul mountain. The second stage is the kinematic analysis of the wedge structure to check for primary susceptibility to failure. Stage three is the probabilistic back analysis of the slope for failure. Finally, rockfall analysis followed by a probabilistic study of parameters as stage four of the study.
Figure 4. Flowchart indicating the adopted methods.
3.2.1. Glacial mobility using SAR offset tracking
The subpixel-scale SAR offset tracking and interferometry (InSAR) are widely used to study glacial surface mobility. Both the techniques require two different SAR scenes from the same orbital geometry acquired between two time periods (Strozzi et al. Citation2002a; Pritchard et al. Citation2005; Kumar et al. Citation2013). However, InSAR fails in the Himalayan glaciers unless the defined temporal baseline is at least 1–3 days and a minimum geometrical baseline exists between the pairs of repeat pass datasets. SAR amplitude or intensity offset tracking can be adopted if there is a high decorrelation between two repeat pass acquisitions. This method helps compute the two-dimensional (azimuth and range) velocity of the glacial surface to the sub-pixel level (Michel and Rignot Citation1999; Kumar et al. Citation2013). As Himalayan glaciers are mostly debris-covered, deposition of debris over the glacial surface proves helpful in deciphering the components of displacement in both range and azimuth directions.
In this study, SAR intensity offset tracking has been used that involves matching intensity between two temporally different but orbital geometry-wise similar images. Cross-correlation optimization of intensity pair has been adopted for offset tracking to sub-pixel level. GRD products of Sentinel-1 have been pre-processed in Sentinel Application Platform (SNAP) developed by European Space Agency (ESA) (). The feature window (matching window) of 128 × 128 pixels (range × azimuth) and searching step of 10 × 10 pixels have been considered. The oversampling factor has been set to 16 while considering the correlation coefficient threshold of 0.3 to mask out the unreliable offsets due to sharp surface changes and severe pixel distortions (Guo et al. Citation2020; Zhu et al. Citation2021). The obtained velocity vectors are compared with the user-defined maximum velocity threshold. The threshold value is considered depending on the type of feature to be monitored. From the previous studies on the glaciers of the Himalayas, a threshold of 15 m/day has been considered to capture anomalous surficial movements if any, and prevent underestimation of glacial velocity (Amitrano et al. Citation2019; Fan et al. Citation2019). Subsequently, geometric distortions introduced by topography, such as shadows and foreshortening, have been corrected through range Doppler terrain correction using SRTM 1arc-sec (30 m) DEM.
Figure 5. Sub-pixel offset tracking process flow for surficial displacement using Sentinel-1 GRD wide swath imagery.
3.2.2. Kinematic analysis
The Trisul Mountain slope lies close to VT and STD with weathered and fragmented rock strata. A physical model of the wedge structure is shown in . The kinematic analysis is done using the friction method. This is conducted as preliminary slope stability check considering the joint sets and their dipping properties. While considering various failure mechanisms for the rock mass, there are two types of considerations: stress- and structurally-controlled. Some cases are a composite of these two and may also involve weathering. This study attempts to check for two types of failures: planar sliding and wedge sliding. Five necessary criteria must be met for the kinematic admissibility of planar sliding. First, the sliding plane must strike almost parallel to the slope face (in the range of ±35°). Second, release surfaces providing negligible resistance to sliding must be present to define lateral slide boundaries. Third, the sliding face must daylight (the region around the poles belonging to the potentially unstable planes) in the slope face. Fourth, the friction angle must be smaller than the dip of the sliding plane. Fifth, the upper end of the sliding surface either terminates in a tension crack or intersects the upper surface (Wyllie and Mah Citation2004). Similarly, four essential criteria must be met for the kinematic admissibility of wedge sliding. First, the dip of the line of intersection must not exceed the dip of the slope. Second, the intersection line must daylight the slope face. Third, the dip of the intersection line must be such that the strength of both planes is reached. Fourth, the upper end of the line of intersection either terminates in a tension crack or intersects the upper face.
Figure 6. Generalized physical model of the wedge structure found in the study area.

3.2.3. Numerical modelling
Analysis of slope stability is performed in two different ways, namely forward analysis and back analysis. The forward analysis is used to assess whether a slope is performing safely as intended. The back analysis determines slope conditions and mobilized shear strength at failure (Mandal et al. Citation2017). The mobilized shear strength can be obtained from laboratory tests on the collected samples from the field. However, some discrepancy exists between the lab-based results and field observations, leading to uncertainties. To back analyze the stability of a failed slope, there are two distinct approaches, namely the deterministic and probabilistic approaches (Duncan et al. Citation2014). In deterministic back analysis, all the input parameters that may cause the slope failure are assumed to be known. In the probabilistic back analysis, some input parameters are treated as statistical distributions. This helps consider the uncertainties associated with the parameters (Mandal et al. Citation2017). In this study, the probabilistic back analysis has been performed using the limit equilibrium method (LEM) and finite element method (FEM).
Traditional LEM is one of the most widely used analytical methods for studying slope stability. The slope is analyzed using equivalent Mohr-Coulomb (MC) criteria for determining the shear strength along the failed surface, considering slope material to be homogenous. LEM works on the principle of static equilibrium. The shear strength of the slope material is reduced by a factor of safety (FOS) to attain equilibrium against the shear stresses. This can be done in two ways. The first way is to consider the slope mass as a single free body. Another way is to treat the slope as slices where the net force acting on each slice should satisfy equilibrium. To conduct the probabilistic back analysis using LEM, the Slide module of the Rocscience software is used. The global minimum is considered for probabilistic analysis with the count of samples as 1000. Monte Carlo is chosen as the sampling method for three different coefficients of variation (CoV) values, i.e., 10%, 15%, and 20% (Falae et al. Citation2021). The Monte Carlo works on pseudo-random or random numbers to sample from probability distributions and generate a distribution for the final output (say FOS). Here, two parameters of rock mass, namely the angle of internal friction (ϕ) and cohesion (c), are chosen as random variables (RVs). The other parameters are considered deterministic input as they do not affect the critical failure surface's location and strength reduction factor (SRF). Initially, the deterministic analysis takes the mean of input parameters. This is done to determine the critical failure surface. Then the probabilistic analysis is done for the critical surface, considering the generated samples of the parameters as RVs. Bishop Simplified Method (BSM) is used to establish a common platform to conduct a comparative study between LEM and FEM.
With the advancement in slope stability analysis, FEM has become a very effective method. The advantage of FEM over LEM lies in its flexibility. FEM has been very useful in studying slopes having complex configurations, progressive failures, and deformations at various stress levels. Using FEM, every failure mechanism can be modeled, and it does not require any pre-defined assumption for the location or shape of the failure surface. FEM uses the shear strength reduction (SSR) technique to analyze slope stability. In this study, 2D stability analysis is conducted in the RS2 module based on the finite element. Discretization of the rock slope is done using a hexa-nodal triangular mesh element. The process of mesh convergence is repeated till the results remain unchanged. The roller boundary condition is assigned at the vertical end on the model's left side (Face AB) to restrict displacement in the horizontal axis. The fixed boundary condition is assigned at the base to limit the displacement in both x- and y-axes. The other two slopes are kept free for displacement along the Cartesian plane. 0.1% energy tolerance is considered in the model as convergence criteria. Gaussian elimination is adopted to derive the solution of the FEM equation based on the principle of energy balance (EB). The in-situ stress generated in the vertical plane is considered twice the stress induced in the horizontal plane (Pain et al. Citation2014). Since the rock slope in this study lies in the vicinity of VT and STD consisting of weathered and fragmented rock strata (Pain et al. Citation2014; Rana et al. Citation2021), GSI equal to 52 is considered. The strength parameters considered in this study are mentioned in . FEM-SSR analysis is used together with Point Estimate Method (PEM) (Ng et al. Citation2014). The principle of PEM is to conduct an iterative FEM-SSR for several estimation points and derive the failure probability from a statistical distribution based on output results. For each parameter chosen as RV, cohesion (c), and angle of internal friction (ϕ), two-point estimates are derived as shown in Equation 1. FEM is performed for every possible combination of PEs generating 2 m solutions where m denotes the number of parameters chosen as RVs. As the count of samples is considered 1000, the FEM-SSR analysis is run 4000 times to determine the FOS.
Table 2. Inputs to analysis of slope stability.
3.2.4. Rockfall analysis
Rockfall comes in the category of geological hazard that mainly occurs over steep slopes of mountainous regions. Apart from the fragmentation of rock mass, this type of hazard may occur due to several factors that involve seismic tremors and heavy rainfall. A rock/ice mass may undergo sliding, bounce, roll, or freefall depending on slope characteristics. Understanding the risk and severity of rockfall requires understanding the potential/kinetic energy, translational velocity, bounce height, etc. Rockfall 6.0 is used to simulate the failure scenario using a deterministic approach in this study. The numerical simulation considers rock fragments as lumped mass and neglects the slope roughness. Since the simulation is conducted for a triangular wedge failure, rock and ice masses are assumed to be originated from the maximum height of the wedge. This is done to avoid underestimating results and adopt a pessimistic approach towards the hazard. As per previous investigation reports (GAPHAZ, Citation2021; Pandey et al. Citation2021), a composite wedge mass of about 25 million m3 detached from an elevation of 1742 m from a rock wall inclined at 35° from the vertical. In the rockfall simulation, 100 units of rocks/ice (seeder) are made to fall from the same height of modeled slope with a horizontal offset of a few meters to simulate the scenario. Considering non-seismic triggers, the initial horizontal, vertical, and rotational velocities of the falling rock masses are taken as 0.1 m/s, 0 m/s, and 0°/s respectively. Rock mass and the coefficient of restitution are stochastically modeled and served as an input in the simulation considering ‘truncated Gaussian distribution’ with a 10% coefficient of variation (Chatterjee and Dey Citation2019). The seeder properties and the stochastic parameters are listed in and , respectively.
Table 3. Inputs for numerical simulation of rock/ice fall.
Table 4. Stochastic parameters of rockfall.
4. Results and discussion
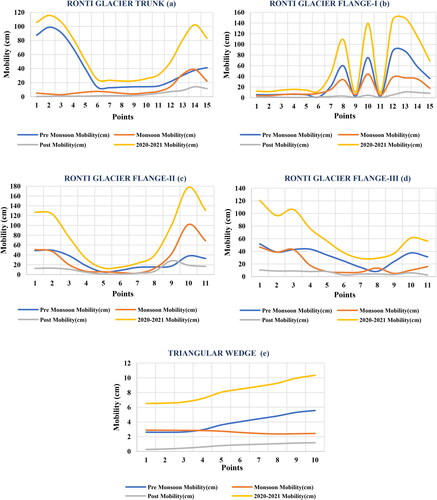
The surface mobility of glacial bodies in the Rishiganga and Dhauliganga valley between 2020 and 2021 is shown in . The mobility of the Ronti glacial body and triangular wedge along the north-eastern slope of Trisul mountain on both annual and seasonal (pre-monsoon, monsoon, and post-monsoon) basis is shown in . The pre and post-monsoon seasons mainly cover the ablation and accumulation period for the glacial bodies in the western Himalayas, respectively. The annual velocity follows almost a fixed pattern throughout each glacial body. The highest velocity is observed in the order of 1.2–5.8 ma−1 at the upper trunk of the glaciers in the valley, which progressively recede to less than 0.2 ma−1 towards the glacier’s snout. The velocity profile of the Ronti glacier follows a similar trend. Maximum annual surficial displacement is detected towards the end of glacial flanges ranging between 150–185 cm, which reduces to less than 10 cm near the snout. It is to be noted that the surficial displacement of the Ronti glacial body is comparatively less than neighboring glacial bodies such as Trisul and Bethartoli glacier. The minimum surface displacement is in the post-monsoon period, and maximum displacement is observed in the pre-monsoon period. The snout of the Ronti glacier has maximum mobility in the range of 100 cm during ablation. The trend in displacement along the trunk and flanges of the glacier is similar for annual and pre-monsoon timelines, as shown in . This indicates that the trend of glacial mobility during the ablation period governs the trend in annual mobility along a stretch of a glacier. It is to be noted that surficial displacement during the accumulation period is the least and therefore has less contribution in the annual mobility. For the triangular wedge, the rate of annual surface displacement is highest at the topmost edge with 11 cma−1 and reduces progressively towards the foot to 6 cma−1. Seasonal analysis of mobility for the wedge suggests that the surface displacement decreases from the top of the edge to the foot during ablation and accumulation period except during monsoon when the displacement is almost constant at 3 cm. Since the seasonal and annual investigation of surface displacement for the wedge structure shows no anomaly, mobility has nothing to do with the activation of the avalanche that occurred on 7th February 2021. The region is tectonically active with peaks and valleys with river channels which makes it hard to justify a stable ground. However, PSInSAR used by Kothyari et al. (Citation2022) gives long-term monitoring of ground movements which does not show any anomalous behavior of the glacial body in the Ronti Gad area and Slopes of Trisul Mountain as shown by the offset tracking results. However, increasing surface displacement from the foot to the topmost edge can be considered a factor behind forming a triangular wedge over the mountain slope. Higher glacial velocity means a higher displacement of the glacial surface at a location. With the resultant range of displacement along with the vertical profile of the wedge, it can be concluded that the slow but steady surface movement for a very long period can be a legitimate factor behind the formation of a prismatic wedge along a mountain slope. Also, the velocity of the glacier reduces with depth due to changes in the properties of the glacier as the glacier thickens. Ronti glacier falls in the category of hanging glaciers, and the standing wall of Trisul mountain exposes metamorphosed ice at the trench where a scenario of decreasing velocity can be observed. This can lead to the formation of the prismatic structure with greater displacement at the uppermost surface and lesser displacement with depth.
Figure 7. Map showing annual mobility of the glacial bodies in the Rishiganga and the Dhauliganga valley between 2020 and 2021.
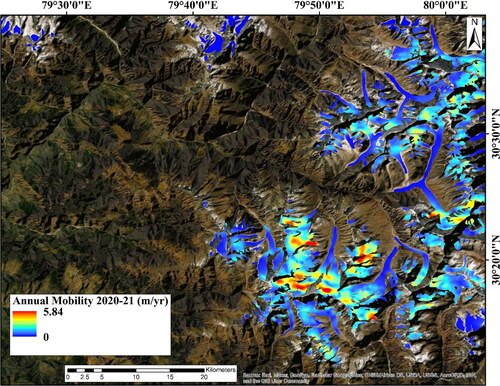
Figure 8. Map showing annual (a) and seasonal (pre-monsoon: (b); monsoon: (c); post-monsoon: (d)) mobility of the Ronti glacier and wedge between 2020 and 2021.
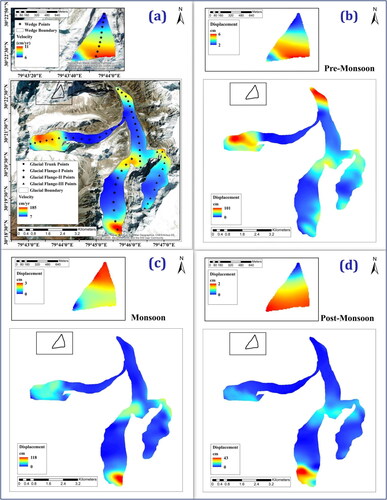
Figure 9. Indicating the mobility trend of (a) trunk, (b-d) flange-I/II/III of Ronti glacier and (e) wedge respectively.
The study area is a rocky wall on the north-eastern face of Trisul mountain with a steep valley by the side. Using the high-resolution imagery of Google Earth Pro and other investigation reports of the nearby areas (Pain et al. Citation2014; Jana et al. Citation2017), it has been found that the slope possesses mainly two joint sets dipping in different directions (). The presence of joint sets (density and orientation) plays a significant role in rock slope failures. Kinematic analysis is carried out to figure out unstable joints within the rock mass responsible for structurally-controlled failure (planar or wedge). The difference between the dipping orientation of joint 1 and slope face is 15° (<35°), due to which the possibility of slope failure due to planar sliding arises. However, the difference in dipping orientation between joint 2 and slope face is 88° which further rectifies the possibility of planar failure. From the equal-area stereographic representation of the lower hemisphere, the slope seems safe for both planar and wedge failure as the intersection of joints lies away from the critical zone (). The plunge of the intersecting joints is less than that of the slope face. The intersection of the joints lie outside the daylight envelope. Therefore, none of the joint sets seem critical for planar or wedge sliding which defines the slope to be safe for structurally-controlled failure. It is not only the joint sets and their orientation that influences slope instability. Properties such as cohesion and friction angle are equally essential to quantify stability. Thus, the slope has been checked for the possibility of stress-controlled failure using numerical modeling considering isotropic rock mass. The effect of discontinuities within the rock mass structure has been introduced based on previous investigations in the area ().
Figure 10. Kinematic analysis showing results for planar sliding (left) and wedge sliding (right) failure.
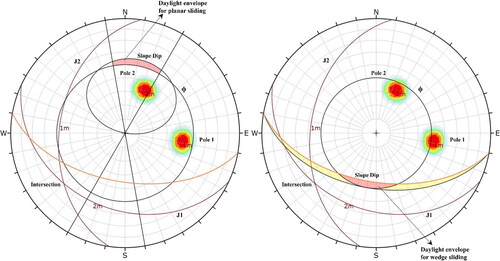
Table 5. Orientation of joint sets and rock slope.
With the help of the equivalent continuum model considering gravity as the only driving force, the deduced critical failure surface is represented in . The FOS from the deterministic back analysis is computed using three different methods, namely, Bishop simplified, Janbu simplified, and GLE/Morgenstern-Price and the maximum FOS is calculated as 1.255 from the Bishop simplified method. The probabilistic bak analysis delivers FOS as 1.273, 1.295, and 1.329 for 10%, 15% and 20% CoV respectively which is close to the output from deterministic analysis. The probability of failure (PF) increases with the increment in CoV. The PF is found to be 17.6% at 20% CoV which means 176 samples have failed out of 1000 samples in the analysis. The reliability index (RI) falls with the increase in CoV with a maximum RI of 1.669 based on normal distribution and 1.823 based on lognormal distribution for 10% CoV respectively. This depicts the stress-controlled failure susceptibility of the slope as a slope is considered safe if the RI is ≥3 (Rocscience Citation2012). The FOS obtained from probabilistic FEM-SSR is shown in . There is no significant change in the FOS with changing CoV as shown in . It is to be noted that changing CoV does not alter the failure mechanism as the critical failure surface remains the same. However, the PF increases with increasing CoV with the maximum value of 42.4% at 20%CoV. This is because an increase in CoV results in an increment in the standard deviation, subsequently the variance. This increases the base of the plot of probability distribution function depicting an increased distance of selected RVs from their mean. This ultimately leads to an increase in PF. The higher value of PF from FEM-SSR than LEM is because the mean FOS calculated by FEM is close to unity which is a critical demarcation of slope stability. The maximum shear strain of 9.2 × 10⁻² is found along the critical failure surface. The maximum vertical and horizontal displacement are 1.58 m and 2.0 m, respectively. The maximum value of total displacement at the time of failure is found to be 2.6 m. Along the critical failure surface, the maximum volumetric strain is found as 1.11 × 10⁻² near the toe of the wedge. The upper 800 m portion of the slope is dominated by tension elements responsible for tension cracks over the crest. This justifies the the 80 m wide opening due to steady displacement of rock block as observed from feature tracking since 2016 (Shugar et al. Citation2021). The shear elements are located along the failure surface initiated from the tension zone and present till the toe of the wedge. This indicates the yield between the crest and the toe of the wedge.
Figure 11. Result from limit equilibrium analysis of rock slope (at 20% CoV).
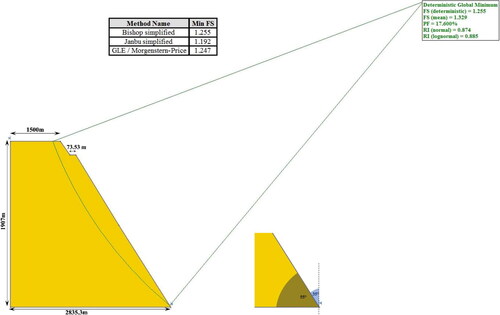
Figure 12. Result from Finite element SSR (left; at 20% CoV) and Rockfall analysis (right) of rock slope.
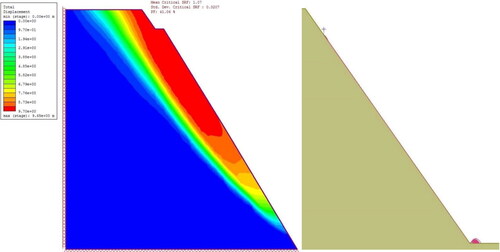
Table 6. Probabilistic back analysis results (LEM and FEM-SSR).
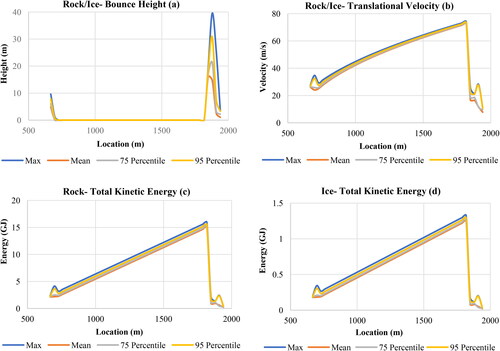
The rockfall simulation is performed following previous investigations considering 80% rock mass (20 million m3) and 20% ice (5 million m3). The seeder location is considered the top of the prismatic wedge adopting a pessimistic approach while simulating rock-ice fall. Various parameters such as bounce height (BH), total kinetic energy (TKE), and translational velocity (TV) are obtained for both rocks as well as metamorphosed ice. This is done for a better understanding of the composite rock-ice failure scenario. The maximum BH, TKE/TV locations for both rock and ice are marked at 39.56 m and 62.19 m, respectively, from the ground. The location remains unchanged with changing seeder properties from granite to metamorphosed dense ice. This shows that the parameters are dependent on the slope geometry and independent of the rockfall material. The parameters are obtained at their maximum, mean, 75, and 95 percentiles (). This is performed as a probabilistic analysis to determine the parameters at every slope location at different risk levels. The slope had already undergone a wedge failure creating devastation downstream. The probabilistic analysis could help look for a mitigation system or development of any infrastructure shortly. For instance, while designing a mitigation system for an infrastructural work of great importance that lies close to Rishiganga or Dhauliganga in proximity to the study area, the maximum or 95 percentiles of TKE, TV, and BH could be considered. On the other hand, for constructing an infrastructure of average to low importance, 75 percentile or mean of parameters could be considered while designing the mitigation system.
Figure 13. Illustration for (a) BH, (b) TV and (c-d) TKE of rock and ice fall at mean, maximum, 75 percentiles and 95 percentiles respectively.
5. Conclusion
The Himalayan cryosphere is considered Asia's water tower and serves as a source of several major river systems. Hazards due to mass movements such as rock slides and glaciers burst in these rivers' proximity impose catastrophic impacts on human lives and engineering structures. The rock-ice composite wedge structure on the north-eastern slope of Trisul mountain that collapsed on 7th February 2021 has been investigated. The salient points of the study are:
The investigation of surface mobility of the Ronti glacier and the overhang wedge shows no anomaly and seems to move at a reasonable rate. Thus, it can be concluded that glacial mobility has not served as a factor behind the detachment of rock-ice composite structure. Along with the vertical profile of the wedge, the surface mobility is maximum near the top and recedes towards the foot. Such a trend of glacial mobility for a long period can be considered a possible causative factor in shaping the prismatic wedge structure.
Kinematic slope analysis does not show susceptibility to structurally-controlled slope failure. The dipping properties of the two major joint sets and the slope illustrate that the rock formation is not vulnerable to planar or wedge sliding.
It is evident from the probabilistic back analysis (LEM and FEM-SSR at 10%, 15%, and 20% CoV) that the slope is susceptible to stress-controlled failure. Despite not having much difference in the mean FOS values, the PF obtained from LEM is relatively less than FEM-SSR. The RI from LEM analysis is less than 3 for both normal and lognormal distribution of RVs, which defines the slope as unsafe.
In probabilistic analysis, parameters from the numerical simulation of rock/ice fall are obtained at the mean, maximum, 75, and 95 percentiles to understand the scenario of rock/ice fall at a particular risk level. The analysis could be helpful while designing a mitigation system in the proximity of the hazard location.
Thus, integration of microwave remote sensing, numerical modelling, and simulation provides an understanding of the formation process and the failure mechanism of the wedge structure. As this region lies in the vicinity of VT and STD, it is recommended to continuously monitor the area through satellite data and field-based geotechnical and geological investigations.
Acknowledgment
We are grateful to European Space Agency, Alaska Satellite Facility, USGS, and Randolph Glacier Inventory for their tremendous efforts to make the data available for the current study.
Disclosure statement
The authors reported no potential conflict of interest.
Data availability statement
The data used for the study has been collected from different agencies that can be assessed using the following links.
SENTINEL-2 MSI: https://scihub.copernicus.eu/dhus/#/home
ALOS PALSAR: https://search.asf.alaska.edu/#/?zoom=5.915¢er=96.406,16.491&dataset=ALOS
RANDOLPH GLACIER INVENTORY: https://www.glims.org/RGI/rgi60_dl.html
References
- Allen SK, Rastner P, Arora M, Huggel C, Stoffel M. 2016. Lake outburst and debris flow disaster at Kedarnath, June 2013: hydrometeorological triggering and topographic predisposition. Landslides. 13(6):1479–1491.
- Ambrosi C, Strozzi T, Scapozza C, Wegmüller U. 2018. Landslide hazard assessment in the Himalayas (Nepal and Bhutan) based on Earth-Observation data. Eng Geol. 237:217–228.
- Amitrano D, Guida R, Di Martino G, Iodice A. 2019. Glacier monitoring using frequency domain offset tracking applied to sentinel-1 images: A product performance comparison. Remote Sensing. 11(11):1322.
- Bhambri R, Mehta M, Dobhal DP, Gupta AK, Pratap B, Kesarwani K, Verma A. 2016. Devastation in the Kedarnath (Mandakini) Valley, Garhwal Himalaya, during 16–17 June 2013: a remote sensing and ground-based assessment. Nat Hazards. 80(3):1801–1822.
- Bolch T, Kulkarni A, Kääb A, Huggel C, Paul F, Cogley JG, Frey H, Kargel JS, Fujita K, Scheel M, et al. 2012. The state and fate of Himalayan glaciers. Science. 336(6079):310–314.
- Champati Ray PK, Chattoraj SL, Bisht MPS, Kannaujiya S, Pandey K, Goswami A. 2016. Kedarnath disaster 2013: causes and consequences using remote sensing inputs. Nat Hazards. 81(1):227–243.
- Chatterjee K, Dey A. 2021. Stochastic analysis of rockfall along a Himalayan slope. In Proceedings of the Indian Geotechnical Conference 2019. Singapore: Springer; p. 651–658.
- Copland L, Sylvestre T, Bishop MP, Shroder JF, Seong YB, Owen LA, Bush A, Kamp U. 2011. Expanded and recently increased glacier surging in the Karakoram. Arctic Antarctic Alpine Res. 43(4):503–516.
- Duncan JM, Wright SG, Brandon TL. 2014. Soil strength and slope stability. Hoboken, NJ: John Wiley & Sons.
- Falae PO, Agarwal E, Pain A, Dash RK, Kanungo DP. 2021. A data driven efficient framework for the probabilistic slope stability analysis of Pakhi landslide, Garhwal Himalaya. J Earth Syst Sci. 130(3):1–15.
- Fan J, Wang Q, Liu G, Zhang L, Guo Z, Tong L, Peng J, Yuan W, Zhou W, Yan J, et al. 2019. Monitoring and analyzing mountain glacier surface movement using SAR data and a terrestrial laser scanner: a case study of the Himalayas north slope glacier area. Remote Sens. 11(6):625.
- Filipponi F. 2019. Sentinel-1 GRD preprocessing workflow. In Multidisciplinary Digital Publishing Institute Proceedings. Vol. 18, p. 11.
- GAPHAZ. 2021. First insights into the Chamoli disaster, Report. (http://gaphaz.org/files/210220Update_Chamoli-disaster_20210207_GAPHAZ.pdf).
- Guo L, Li J, Li ZW, Wu LX, Li X, Hu J, Li HL, Li HY, Miao ZL, Li ZQ. 2020. The surge of the Hispar Glacier, Central Karakoram: SAR 3‐D flow velocity time series and thickness changes. J Geophys Res Solid Earth. 125(7):e2019JB018945.
- Gupta V, Dobhal DP, Vaideswaran SC. 2013. August 2012 cloudburst and subsequent flash flood in the Asi Ganga, a tributary of the Bhagirathi river, Garhwal Himalaya, India. Curr Sci. 105(2):249–253.
- Jana A, Dey A, Sreedeep S. 2017. Stability analysis of rock slope using combined continuum interface element method. In Indian Geotechnical Conference 2017 GeoNEst. p. 1–4.
- Kääb A, Leinss S, Gilbert A, Bühler Y, Gascoin S, Evans SG, Bartelt P, Berthier E, Brun F, Chao W-A, et al. 2018. Massive collapse of two glaciers in western Tibet in 2016 after surge-like instability. Nat Geosci. 11(2):114–120.
- Kargel JS, Leonard GJ, Shugar DH, Haritashya UK, Bevington A, Fielding EJ, Fujita K, Geertsema M, Miles ES, Steiner J, et al. 2016. Geomorphic and geologic controls of geohazards induced by Nepal's 2015 Gorkha earthquake. Science. 351(6269):aac8353.
- Kothyari GC, Joshi N, Taloor AK, Malik K, Dumka R, Sati SP, Sundriyal YP. 2022. Reconstruction of active surface deformation in the Rishi Ganga basin, Central Himalaya using PSInSAR: a feedback towards understanding the 7th February 2021 Flash Flood. Adv Space Res. 69(4):1894–1914.
- Kumar M, Rana S, Pant PD, Patel RC. 2017. Slope stability analysis of Balia Nala landslide, Kumaun lesser Himalaya, Nainital, Uttarakhand, India. J Rock Mech Geotech Eng. 9(1):150–158.
- Kumar D, Singh AK, Singh DS. 2021. Spatio-temporal fluctuations over Chorabari glacier, Garhwal Himalaya, India between 1976 and 2017. Quat Int. 575-576:178–189.
- Kumar V, Venkataraman G, Høgda KA, Larsen Y. 2013. Estimation and validation of glacier surface motion in the Northwestern Himalayas using high-resolution SAR intensity tracking. Int J Remote Sens. 34(15):5518–5529.
- Mandal J, Narwal S, Gupte SS. 2017. Back analysis of failed slopes – a case study. Int J Eng Res Technol (IJERT). 6(5):1070–1078.
- Mao W, Wu L, Singh RP, Qi Y, Xie B, Liu Y, Ding Y, Zhou Z, Li J. 2022. Progressive destabilization and triggering mechanism analysis using multiple data for Chamoli rockslide in 7 February 2021. Geomat Nat Hazards Risk. 13(1):35–53.
- Margreth S, Funk M, Tobler D, Dalban P, Meier L, Lauper J. 2017. Analysis of the hazard caused by ice avalanches from the hanging glacier on the Eiger west face. Cold Reg Sci Technol. 144:63–72.
- Meena SR, Bhuyan K, Chauhan A, Singh RP. 2021a. Snow covered with dust after Chamoli rockslide: inference based on high-resolution satellite data. Remote Sens Lett. 12(7):704–714.
- Meena SR, Bhuyan K, Chauhan A, Singh RP. 2021b. Changes in the flood plains and water quality along the Himalayan rivers after the Chamoli disaster of 7 February 2021. Int J Remote Sens. 42(18):6984–7001.
- Meena SR, Chauhan A, Bhuyan K, Singh RP. 2021c. Chamoli disaster: pronounced changes in water quality and flood plains using Sentinel data. Environ Earth Sci. 80(17):1–13.
- Michel R, Rignot E. 1999. Flow of Glaciar Moreno, Argentina, from repeat-pass Shuttle Imaging Radar images: comparison of the phase correlation method with radar interferometry. J Glaciol. 45(149):93–100.
- Mitchell A, McDougall S, Aaron J, Brideau MA. 2020. Rock avalanche-generated sediment mass flows: definitions and hazard. Front Earth Sci. 8:1–8.
- Mukherjee PK, Jain AK, Singhal S, Singha NB, Singh S, Kumud K, Seth P, Patel RC. 2019. U-Pb zircon ages and Sm-Nd isotopic characteristics of the Lesser and Great Himalayan sequences, Uttarakhand Himalaya, and their regional tectonic implications. Gondwana Res. 75:282–297.
- Naithani AK, Joshi V, Prasad C. 2002. Investigation on the impact of cloudburst in Tehri district, Uttaranchal-31 August 2001. Journal of Geological Society of India. (Online archive from Vol 1 to Vol 78), 60(5):573–577.
- Nath SK, Sengupta A, Srivastava A. 2021. Remote sensing GIS-based landslide susceptibility & risk modeling in Darjeeling–Sikkim Himalaya together with FEM-based slope stability analysis of the terrain. Nat Hazards. 108(3):3271–3304.
- Ng SM, Ismail MAM, Abustan I. 2014. Back analysis of slope failure using finite element with point estimate method (FEM-PEM). J Civil Eng Res. 4(3A):31–35.
- Orwin JF, Clague JJ, Gerath RF. 2004. The Cheam rock avalanche, Fraser valley, British Columbia, Canada. Landslides. 1(4):289–298.
- Pain A, Kanungo DP, Sarkar S. 2014. Rock slope stability assessment using finite element based modelling–examples from the Indian Himalayas. Geomech Geoeng. 9(3):215–230.
- Pandey P, Chauhan P, Bhatt CM, Thakur PK, Kannaujia S, Dhote PR, Roy A, Kumar S, Chopra S, Bhardwaj A, et al. 2021. Cause and process mechanism of rockslide triggered flood event in Rishiganga and Dhauliganga River Valleys, Chamoli, Uttarakhand, India using satellite remote sensing and in situ observations. J Indian Soc Remote Sens. 49(5):1011–1024.
- Pandey VK, Kumar R, Singh R, Kumar R, Rai SC, Singh RP, Tripathi AK, Soni VK, Ali SN, Tamang D, et al. 2022. Catastrophic ice-debris flow in the Rishiganga River, Chamoli, Uttarakhand (India). Geomatics Nat Hazards Risk. 13(1):289–309.
- Panikkar SV, Subramanyan V. 1997. Landslide hazard analysis of the area around Dehra Dun and Mussoorie, Uttar Pradesh. Current Science. 73(12):1117–1123.
- Pant PD, Luirei K. 1999. Malpa rockfalls of 18 August 1998 in the Northeastern Kumaun Himalaya. J Geol Soc India (Online Archive from). 1(4):415–420.
- Paul SK, Mahajan AK. 1999. Malpa rockfall disaster, Kali valley, Kumaun Himalaya. Current Science. 76(4):485–487.
- Pralong A, Funk M. 2006. On the instability of avalanching glaciers. J Glaciol. 52(176):31–48.
- Pritchard H, Murray T, Luckman A, Strozzi T, Barr S. 2005. Glacier surge dynamics of Sortebrae, east Greenland, from synthetic aperture radar feature tracking. J Geophys Res. 110(F3):1–13.
- Quincey DJ, Braun M, Glasser NF, Bishop MP, Hewitt K, Luckman A. 2011. Karakoram glacier surge dynamics. Geophys Res Lett. 38(18):n/a–n/a.
- Raina VK, Srivastava D. 2008. Glacier atlas of India. Bangalore: Geological Society of India.
- Rana N, Sharma S, Sundriyal Y, Kaushik S, Pradhan S, Tiwari G, Khan F, Sati SP, Juyal N. 2021. A preliminary assessment of the 7th February 2021 flashflood in lower Dhauli Ganga valley, Central Himalaya, India. J Earth Syst Sci. 130(2):1–10.
- Rao NP, Rekapalli R, Srinagesh D, Tiwari VM, Hovius N, Cook KL, Dietze M. 2021. Seismological rockslide warnings in the Himalaya. Science. 372(6539):247–247.
- RGI Consortium. 2017. Randolph glacier inventory – a dataset of global glacier outlines: Version 6.0: technical report, global land ice measurements from space. Colorado, USA: Digital Media. https://doi.org/10.7265.
- Rocscience. 2012. SLIDE 6.0—2D slope stability analysis for soil and rock slopes. Toronto: Rocscience Inc.
- Sentinel-1 Team. 2013. Sentinel-1 user handbook; GMES-S1OP-EOPG-TN-13-0001. Frascati, Italy: European Space Agency, p. 80. Available online: https://sentinel.esa.int/documents/247904/685163/Sentinel-1_User_Handbook (accessed on 14th April 2016).
- Sethya KK, Pandey P, Chattoraj S, Manickam S. 2018. Mapping, Modeling and Simulation of Snow Avalanche in Alaknanda Valley, Central Himalaya: Hazard Assessment. In IGARSS 2018-2018 IEEE International Geoscience and Remote Sensing Symposium, p. 5150–5153. Valencia, Spain: IEEE.
- Shrestha AB, Steiner J, Nepal S, Maharjan SB, Jackson M, Rasul G, Bajracharya B. 2021. Understanding the Chamoli flood: Cause, process, impacts, and context of rapid infrastructure development. River Basins and Cryosphere. Kathmandu, Nepal: ICIMOD.
- Shugar DH, Jacquemart M, Shean D, Bhushan S, Upadhyay K, Sattar A, Schwanghart W, McBride S, de Vries MVW, Mergili M, et al. 2021. A massive rock and ice avalanche caused the 2021 disaster at Chamoli, Indian Himalaya. Science. 373(6552):300–306.,
- Snehmani Bhardwaj A, Pandit A, Ganju A. 2014. Demarcation of potential avalanche sites using remote sensing and ground observations: a case study of Gangotri glacier. Geocarto Int. 29(5):520–535.
- Strozzi T, Luckman A, Murray T, Wegmuller U, Werner CL. 2002. Glacier motion estimation using SAR offset-tracking procedures. IEEE Trans Geosci Remote Sens. 40(11):2384–2391.
- Thayyen RJ, Mishra PK, Jain SK, Wani JM, Singh H, Singh MK, Yadav B. 2021. Hanging glacier avalanche (Raunthigad-Rishiganga) and Debris flow disaster of 7th February 2021, Uttarakhand, India: A Preliminary Assessment.
- Valdiya KS. 2003. Reactivation of Himalayan frontal fault: implications. Curr Sci. 85(7):1031–1040.
- Valdiya KS, Bartarya SK. 1989. Problem of mass-movements in a part of Kumaun Himalaya. Curr Sci. 58(9):486–491.
- Wyllie DC, Mah CW. 2004. Rock slope engineering, 4th ed. CRC Press.
- Yin A, Harrison TM. 2000. Geologic evolution of the Himalayan-Tibetan orogen. Annu Rev Earth Planet Sci. 28(1):211–280.
- Zhu Q, Ke CQ, Li H. 2021. Monitoring glacier surges in the Kongur Tagh area of the Tibetan Plateau using Sentinel-1 SAR data. Geomorphology. 390:107869.