
 ?Mathematical formulae have been encoded as MathML and are displayed in this HTML version using MathJax in order to improve their display. Uncheck the box to turn MathJax off. This feature requires Javascript. Click on a formula to zoom.
Abstract
This study reports a comprehensive review on drought indices used in monitoring meteorological, agricultural, hydrological, and socio-economic drought. Drought indices have been introduced as an important approach to quantitative and qualitative calculations of drought’s severity and impact. There were 111 drought indices reviewed in this study, which fall into two categories: traditional (location-specific/model) and remote sensing (RS). Out of 111 indices, 44 belong to the traditional indices and 67 belong to the RS section. This study shows that meteorological drought monitoring has the highest number (22) of traditional indices, about 20% overall, while the lowest (7) agricultural drought monitoring is 6.3%. The specialty is that when considering remote sensing-based drought indices, 90% are used for agricultural drought monitoring and 10% for hydrological and meteorological drought monitoring. However, the study found that advances in satellite technology have accelerated the design of new drought indices and that replacing traditional location-specific data with satellite observation makes it easier to calculate more spatial distribution and resolution.
1. Introduction
Drought is a natural disaster that increases in intensity and duration over a long period of time and has far-reaching consequences (Wilhite and Glantz Citation1985; Mishra and Singh Citation2010). Drought, in particular, can have a devastating effect on agriculture, water supply, energy, and the natural environment, making it one of the most expensive natural disasters (Mishra and Singh Citation2010). Researchers and scientists have come up with various definitions of drought, but the common denominators for all of these definitions are dryness and water scarcity (Wilhite Citation2000). Initially, the United States National Drought Mitigation Center classified drought into three types: meteorological, agricultural, and hydrological (Wilhite and Glantz Citation1985). Later, the US Geological Survey introduced the socio-economic drought category, which is actually how society feels about the effects of the droughts described above (Miyan Citation2015). Decreased crop yields indicate that an agricultural drought has occurred, and severe hydrological imbalances confirm the presence of a hydrological drought (Huschke Citation1959; Vujica et al. Citation1977; Rosenberg Citation1979). However, hydrological droughts indicate a shortage of surface and groundwater. A single torrential downpour can end a prolonged severe drought, however, it is difficult to pinpoint the beginning or end of drought (Parry et al. Citation2016). This implies that the quantitative and qualitative analysis of drought is a challenging phenomenon. However, among other natural disasters, researchers are paying close attention to the drought, which is affecting a significant number of people and causing severe damage to their livelihoods (Woods and Woods Citation2007).
The detailed study of the world's droughts from history to the present shows that the drought that occurred in China from 1876 to 1878 was the worst, and about 83 million people were severely affected (Miyan Citation2015). African Sahel-drought (1968 to 1988) is considered as one of the longest and worst droughts in history, leaving more than 150 million people hungry. The worst affected countries of Sahel-drought are Senegal, Mauritania, Mali, Burkina Faso, Nigeria, Sudan, and Ethiopia (Miyan Citation2015). The droughts of 2002-2003 in Australia and 2004-2006 in Nigeria are of particular attention because they are the worst droughts in recent history and there were 19 million and 3.6 million people severely affected, respectively (Woods and Woods Citation2007).
Furthermore, a special report of the Intergovernmental Panel on Climate Change (IPCC) released in 2012 pointed out that since 1950 most parts of the world, including the Americas, Asia, Africa, Europe, and Australia, have experienced severe droughts (IPCC Special Report Citation2012). Droughts have been on the rise in South Asia since 2000 and have been occurring every three years in India, Pakistan, Afghanistan, and Sri Lanka over the past five decades (Miyan Citation2015). Furthermore, recent studies have shown that increased exposure of natural and human systems to drought increases the drought risk (Van Loon Citation2015). Therefore, it is important to monitor them based on the drought characteristics such a time of onset, duration, intensity, and spatial extent to minimize the damage caused by drought (Lin et al. Citation2020). Drought characteristics study provides space for effectively conducting the drought risk analysis and forecasting (Lin et al. Citation2020).
Therefore, a systematic analysis of drought occurrence, severity, and impact is a scientific approach that is very important in every part of the world. Drought indices have been introduced by various researchers using different drought indicators (Yihdego et al. Citation2019). The terms drought “indicator” and “index” are often used interchangeably in drought monitoring research communities (Hayes et al. Citation2012). Drought indicators are physical factors such as precipitation, temperature, flow, groundwater level, reservoir levels, soil moisture levels, and snowfall that represent the effects of drought with changes relative to the normal condition. Drought index is commonly referred to as numerical representations that can be used to calculate the magnitude and severity of drought using a single or combination of physical indices (Hayes et al. Citation2012).
Although more than 150 drought indices have been developed by various studies globally, disaster managers and decision-makers still need to work hard to select suitable drought indices for drought monitoring of a respective country/region considering climatic and geographical setting, etc. Those challenges are exacerbated in developing countries by the lack of data and their persistence. Therefore, this study focuses on a detailed review of the availability of traditional (location-specific), remote sensing (RS) based, and integrated indices of meteorological, agricultural, hydrological, and socio-economic drought. Based on whether location-specific or satellite data have been used to calculate drought indices, a separate list for meteorological, agricultural, hydrological, and socioeconomic drought has been compiled so that it is easier and faster to obtain information needed for future studies.
With the advancement of satellite imaging technology, the rate of development of new drought indices has increased significantly (AghaKouchak et al. Citation2015; Kim and Jehanzaib Citation2020). Therefore, the introduction and classification of drought indices, as well as the listing of indices based on the approach of drought indicator measurement and drought types, were carried out in this study. In addition, separate lists of drought indices created by combining different basic indices were introduced. All the list of droughts described above includes the index name, equation, index measuring parameter, the approach used to calculate it as well as the reference so that any researcher and users can easily study the different drought indices. The speciality of this study is that it not only provides a list of drought indices but also goes beyond it and presents in detail the advantages and disadvantages of using the drought indices.
2. Methodology
2.1. Methodology for drought indices assessment
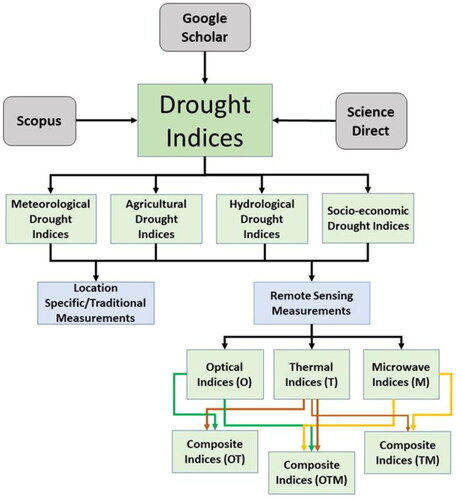
Since a large number of drought indices have been introduced by various researchers to monitor drought in different parts of the world, it is necessary to find those indices through a specific approach to review them. Published articals available in Science Direct, Scopus, and Google Scholar databases have been used to extract those drought indices. Those indices found through the above database were classified according to the type of drought (i.e., meteorological, agricultural, hydrological and socio-economic) and sub-divided into traditional/location-specific and remote sensing considering the nature of data usage. Moreover, drought indices based on type remote sensing were further subdivided into simple indices such as optical, thermal, and microwave. The design of composite indices is carried out in different ways such as "combining individual simple indices in the same category through a mathematical equation (ex Vegetation Condition Index (VCI))", “combining individual simple indices in different categories through a mathematical equation (ex Vegetation Health Index (VHI)), and "in different categories" Integrated through a single simple index chart system (ex Vegetation Drought Response Index (VegDRI)). shows the complete methodology used to identify, classify and assess drought indices.
Figure 1. Schematic Representation of Methodology.
2.2. Drought process and types
Three types of physical droughts i.e., meteorological, agricultural, and hydrological, and one type of socio-economic drought, have been introduced through various studies on drought (Wilhite Citation2000). This classification is based on the drought-prone sectors and physical environments (Wilhite et al. Citation2007; Alam et al. Citation2014; Mekonen et al. Citation2020; Spinoni et al. Citation2020). shows the progression in meteorological, agricultural, hydrological socio-economic droughts over time and the changes in different physical properties and parameters when different droughts occurred in a particular area.
Figure 2. Schematic representation of drought process (Zargar et al. Citation2011).
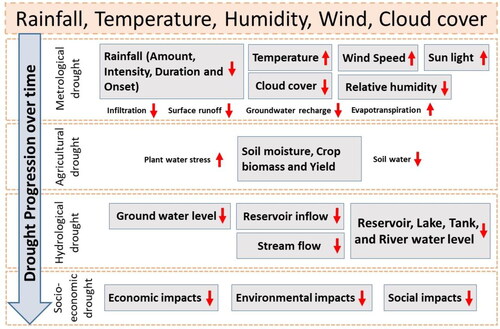
Meteorological drought is caused by a decrease in rainfall or a delay in the onset of the monsoon season, which directly affects soil moisture, resulting in poor crop health and agricultural drought (Miyan Citation2015). Then, declining water discharge and levels in major surface water-bearing formations such as streams, tanks, reservoirs, and large lakes are the indication of the occurrence of hydrological droughts. The end result of the overall drought process is the occurrence of socio-economic drought, which reflects the impact of drought on the socio-economic system.
Meteorological drought can occur over a specific area (district, province, or country) and over a period of time (weeks, months, or years) when actual rainfall is deficient than normal (Abubakar et al. Citation2020). Meteorological drought is caused entirely by a short- or long-term decrease in rainfall, but generally, agricultural drought is caused by both rainfall decreases and temperature increases. Although rainwater is directly involved in reducing soil moisture levels, it does so by catalyzing water evaporation due to temperature. Meteorological droughts are generally more frequent than other droughts as a result of current climate variability, followed by agricultural, hydrological, and socioeconomic droughts. Scientific drought monitoring with a high spatial-temporal resolution is an important strategy in a timely manner because it is of great help in drought early warning, risk management, and mitigation.
The occurrence of agricultural drought is indicated by declining yields due to crop growth stress, decrease in rainfall, the soil moisture required for plant growth gradually decreases beyond the optimum level (Korres et al. Citation2016). The impact on the agricultural sector depends on the duration, spatial distribution, and severity of the drought event. Although long-term droughts are not common, short-term droughts are more likely to occur, but the effect of short-term drought is less because the crop may mature before the peak of the drought. However, the effect of short-term drought varies based on the stages of cultivation (Ghosh Citation2019). For example, during the growing season of the crop and when it is ready for flowering or grain-filling, the maximum amount of water is required, so if the drought occurs during that time, it can have a severe effect on the crop yield. Therefore, gaining a comprehensive understanding of agricultural droughts and their occurrences is of paramount importance for crop planning, water management, and crop diversification, which are aspects of sustainable food production.
Hydrological drought is indicated by the significant drop in the surface water feature such as lakes or reservoirs and groundwater level, it usually comes after meteorological and agricultural drought because surface and groundwater storage can be used for a considerable period but does not recharge due to reduced rainfall (Alsumaiei Citation2020). Among other droughts, hydrological drought is taking much attention as most human activities depend on the supply/availability of water, which is primarily used for industrial, agricultural, and hydropower generation. Hydrological droughts in any area are characterized by a prolonged gradual decrease in rainfall, declining river water levels, continuous reduction of groundwater levels, decreased soil moisture, and increased evaporation (Leblanc et al. Citation2012). Many researchers have introduced drought indices that can be used to calculate the onset and severity of a hydrological drought through the study of the temporal variability of these parameters. Long-term data are needed to calculate these indices because of the complexity of the water cycle and the impact of climate variability on it (Mukherjee et al. Citation2018).
Socio-economic droughts in many parts of the world are drawing attention as the increasing water demand of the population and industry increases in proportion to the gradual decrease in rainfall and water resources. In the event of a socio-economic drought, the demand for water for various activities will exceed its supply limit, which will have a direct impact on the socio-economic process (Arab et al. Citation2010; Wada et al. Citation2011; Madani Citation2014; Loucks Citation2015; Wheater and Gober Citation2015). Although the socio-economic drought study is so important, it has received less attention from researchers than other droughts due to its complexity. Also, since this is difficult to calculate based on a simple mathematical equation, the most commonly used for socio-economic drought analysis is the qualitative approach rather than the quantitative approach. However, there are only a few indices designed for socio-economic drought monitoring, each of which is a complex index.
2.3. Drought indices
In the early days, absolute rainfall or rainfall deficiency was used for drought monitoring and monitoring, and it was represented as the percentage of rainfall departure (Heim Citation2002). However, with an increasing focus on assessing the severity of droughts and the complexity of droughts studies in different climatic and ecological regions, researchers have become increasingly inclined to develop new drought indices (Steinmann et al. Citation2005).
Drought indices are used to monitor the variability of the drought and to calculate the magnitude. Usually, the drought index is represented by numerical values calculated using one or more variables that cause drought, and the quantitative value of that index determines the severity and intensity of the drought (Zargar et al. Citation2011). Drought indices can be used to monitor the drought better than the raw data of the variables that lead to drought (Stagge et al. Citation2015). Drought indices are generally based on drought indicators such as rainfall, temperature, soil moisture, as well as changes in crop health and declining water levels in reservoirs and rivers as a result of drought (Xing et al. Citation2020). Drought and drought indices are also classified in different classes based on the drought process, data, method, and technology used. Many different indices currently used for drought monitoring are divided into major two sections, in-situ, and remote sensing which are discussed separately in the scope of this study, covering meteorological, agricultural, hydrological, and socio-economic drought.
The primary purpose of creating drought indices is to identify the effects of drought based on the characteristics and nature, and there are currently more than 150 indices for drought monitoring worldwide (Zargar et al. Citation2011). Due to the diversity in the characteristics of droughts, new indices are being introduced by various researchers, and the current trend is to create new indices by combining the already introduced basic drought indices using different techniques (Zargar et al. Citation2011). Drought indices design has accelerated further due to the extraordinary and continuous development of technology that has simplified complex methods such as data storage, spatial and non-spatial data integration, analysis, and aggregation (Pei et al. Citation2020). Examples include cloud computing, Artificial Intelligence (AI), and big-data concepts (Jung et al. Citation2021).
2.4. Drought impact and importance of drought monitoring indices
The drought has a direct impact on all three major sectors: economic, environmental, and social (Wilhite and Glantz Citation1985; Meyer et al. Citation1993). Drought-induced water shortages affect production, sales, and business operations in a variety of industries. This is known as the direct effects of the drought, and the indirect economic effects of the drought stem from a reduction in interactions and transactions between industry and other related sectors. The impact on the agricultural sector is even more impressive when compared to other sectors. The reduction in crop production due to drought has a negative impact on the supply chain and the resulting economic impact and loss distribution depend on the interaction between product demand and supply (Ding et al. Citation2010).
In agriculture, systematic and continuous water supply throughout the cropping season is essential for the proper growth of crops (Jayawardhana and Chathurange Citation2020). Although the water for crop cultivation can be obtained through irrigation in some areas, it is not valid everywhere. Since rain-fed crops are grown especially in dry, semi-arid, and arid regions, the total crop production in those areas depends only on the spatial and temporal variability of rainfall (Mirza et al. Citation2013). In particular, systematic and accurate agricultural drought monitoring in the crop season for such areas will facilitate effective and timely action to minimize agricultural losses due to drought. In addition to drought preparedness and drought response, drought monitoring plays an important role in drought risk management, and drought monitoring involves the continuous observation of rainfall and its changes, temperature, and soil moisture throughout the crop growing season.
2.5. Evolution of drought indices
As Steinemann et al. (Citation2005), explained the development and implementation of drought indices are highly dependent on data availability. In the early days of drought indices development, rainfall data were primarily used in synoptic meteorological stations (Van-Rooy 1965; Bhalme and Mooley Citation1980; Bryant et al. Citation1992; Byun and Wilhite Citation1999). According to the literature study, the first recorded study of the drought was made around 1861, which was carried out based on changes in rainfall (Davy Citation1861). However, drought studies or drought indices were slow to develop until the 1960s and 1970s. Nevertheless, the rapidly growing drought related publications since the 1970s indicate that researchers are also increasingly interested in creating drought indices (Chandrasekara et al. Citation2021).
Due to the complexity of the droughts, the researchers found that using rainfall alone was not sufficient to study the effects of the drought, so drought indices were calculated using additional variables such as temperature and evapotranspiration (Keetch and Byram Citation1968; Manatsa et al. Citation2017; Parsons et al. Citation2019). Further expanding the design of drought indices, in addition to temperature and evapotranspiration, the indices were designed to provide a more successful picture of drought, including water flow and soil moisture (Palmer Citation1965).
Traditionally, meteorological-drought monitoring was carried out locally, regionally, or globally using meteorological-drought indices calculated based on location-specific rainfall or interpolated grid data (Spinoni et al. Citation2019). Although the Standardized Precipitation Index (SPI) is recommended by the World Meteorological Organization (WMO) for monitoring Meteorological droughts in any part of the world, the Palmer Drought Severity Index (PDSI) (Palmer Citation1965), the Standardized Precipitation Evapotranspiration Index (SPEI) Drought indices are also widely used (Vicente-Serrano et al. Citation2010a, Citation2010b).
Current drought indices are developed based on specific climatic or environmental characteristics, so due to the inherent complexity of selected regions, those drought indices may have some limitations in their use in other areas. However, since the accuracy of these indices depends on the distribution of the meteorological gauge network, the spatial resolution of the drought indices derived from these data usually shows relatively courser spatial resolution (Wang et al. Citation2009). On the other hand, it is not advisable to rely solely on station-based data for real-time or near-term drought monitoring, as data production may be delayed from weeks to months due to the traditional method of data collection. Depending on the complexity of the droughts, it may not be more practical to use a single drought index to capture their various effects, but combined drought indices are more appropriate (Sophie et al. Citation2016).
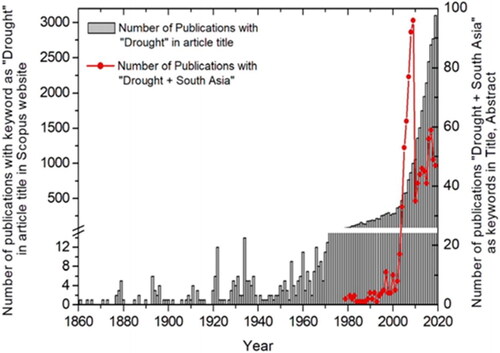
However, the growing interest in drought studies by researchers as well as observers may have been due to the unprecedented development of satellite imaging technology since the 1970s (). The data from the study (Chandrasekara et al. Citation2021) can be used to argue that the results of the use of the word "drought" in the Scopus study search engine show a significant increase in drought research from the 1970s worldwide. This is because high-resolution satellite imagery (Landsat) has existed from the 1970s to date. Another interesting finding that emerges from the same data is that there has been an exponential increase in the number of drought studies since 2000. One of the main reasons for this could be the generation of daily satellite data with a medium resolution by Moderate Resolution Imaging Spectroradiometer (MODIS) covering the world since March 2000. On the other hand, MODIS satellite data is used to generate various drought indicator parameters such as temperature, soil moisture, vegetation health, surface water dynamics, etc.
Figure 3. Representation of number of publication over time (source: Chandrasekara et al. Citation2021).
2.6. Drought monitoring indices categorizations
Drought indicators and indices are usually used by a large number of researchers to study in detail of spatial distribution, duration, and severity of a drought (Steinemann et al. Citation2005). In the early days of drought monitoring, absolute rainfall or rainfall deficit was used, which was expressed as a percentage of rainfall outflow (Heim Citation2002). However, with a greater focus on assessing the severity of drought and the complexity of drought studies in different climatic as well as environmental regions, researchers are increasingly inclined to develop new drought indices (Steinmann et al. Citation2005). The Palmer Drought Intensity Index (PDSI) has been cited by various researchers as one of the earliest drought index developed to assess the severity of relative drought nationwide (Plamer 1965; Hayes et al. Citation2012). Due to various limitations in the use of the PDSI, other indices such as the Surface Water Supply Index (SWSI; Schaefer and Desmond Citation1982) and the Standardized Precipitation Index (SPI; McKee et al. Citation1993), Rainfall Anomaly Index (RAI; Van Rooy Citation1965) was developed.
In many drought-prone countries over the past decade, various frameworks for drought monitoring have been established to minimize the impact of drought on society, the environment, and the economy. However, most of such drought frameworks are based on single data sources only, so spatial and temporal resolution of drought information is also limited. Data from a variety of drought-related sources can be combined to produce high-quality spatial and temporal information through integrated drought indices (Zhong et al. Citation2020).
Today, technological advancement in satellite imagery provides a better platform for the development of comprehensive indices for drought monitoring through vegetation, rainfall data, soil moisture measurement, and evapotranspiration. In terms of satellite imagery, they had a large spatial coverage (locally and globally) as well as a continuous data supply, but monitoring drought impact at the continental level as well as agricultural field level was rather challenging in the past. However, modern advances in satellite image capture technology and image processing have led to an increase in the spatial and temporal resolution of satellite imagery and the fusion of multiple satellite data to enable crop field level and continental level drought monitoring.
In classifying drought indices, the physical parameters used to create the index and the type of drought information that the index provides are considered (Steinemann et al. Citation2005; Niemeyer Citation2008). According to the four major drought categories, the four indices class such as meteorological, agricultural, hydrological, and sociological drought can be defined. But no matter how advanced the technology, there is a lack of indices designed to monitor socio-economic drought mainly due to the lack of socioeconomic data availability even in the developed countries.
3. Results and discussion
3.1. Relationship location-specific/modeled-based drought monitoring indicators and indices
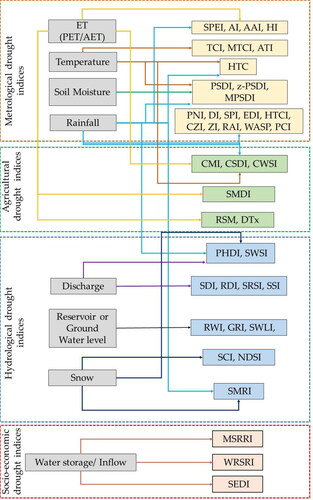
The highest number of drought indicators and indices are available for meteorological drought monitoring and followed by hydrological drought monitoring. shows that there is no a single index used for agricultural drought monitoring alone in terms of traditional drought indices. However, there are a small number of agricultural drought indices, all of which have been created using meteorological drought indicators such as rainfall, temperature, soil moisture, evapotranspiration. Even though socio-economic drought monitoring has become more important, the speciality is that a minimum number of such indices have been developed.
Figure 4. Relationship of location-specific/Model-based drought indicators and indices.
3.1.1. Location-specific/model-based meteorological drought indices
Meteorological drought monitoring indices are the most historic of all drought indices and are largely based on calculations of variations in precipitation and soil water content based on location readings. Therefore, the quantitative and qualitative information obtained from this is shown to be more accurate. But with the advancement of modern data science and satellite technology, spatial data with higher spatial resolution than traditional location-based data have been increasingly used in recent times to calculate these meteorological drought Indices as well. Although the indices listed in are fundamental to meteorological drought monitoring, some indices have been shown by researchers in various studies to be more effective in agricultural drought monitoring (Meisam et al. Citation2014; Xianfeng et al. Citation2016; Myronidis et al. Citation2018). The main reason for this is that the first effect of drought is observed by materialization through crops. shows a detailed description of the location-specific meteorological drought indices, including name, equations (if applicable), application, and the parameters.
Table 1. List of metrological drought indices.
Initially, meteorological drought indices were created using only location-specific precipitation data, but later the indices were advanced by combining temperature, soil moisture, and evapor-transpiration data with rainfall. Among all other measured drought indices, SPI, RAI, and PDSI are widely used around the world because of their potential for use in drought forecasting, monitoring, and planning operations (Yang et al. Citation2019; Hoffmann et al. Citation2020).
Percent Normal Index (PNI) is calculated as an average percentage of rainfall that can be calculated for different time periods and can also be used more effectively for drought monitoring in a given area or season (Hayes Citation2006). Decile Index (DI) is defined as the ranking of rainfall values using a specific time interval over a historical period. The use of long-term rainfall data is essential for a more accurate estimate of DI (Gibbs and Maher Citation1967). This index can also be used to perform calculations for any period of time, such as SPI, PNI, and RAI. Reconnaissance Drought Index (RDI) is calculated based on the rate of precipitation and potential evapotranspiration while the effective Reconnaissance Drought Index (eRDA) is calculated by replacing the rainfall with effective rainfall.
At the inter-regional workshop on Drought indices and Early Warning Systems organized by the World Metrological Organization (WMO) in 2019 December, 22 countries agreed to use SPI as the best index for meteorological drought monitoring (Michael et al. Citation2011). The advantage of calculating the SPI is that the non-standard distribution of rainfall is converted into a standardized distribution at different time frames. Here, precipitation data is first transformed to the gamma distribution and then converted to a normal distribution using the normal probability transformation (McKee et al. Citation1993). Then, the mean of the data sets to zero and the values above zero representing wetness, and values below zero indicate dryness. This methodology provides a good solution to the anomalies caused by the use of non-standardized distribution for drought monitoring. SPI can be calculated using any time period so that short-term as well as long-term drought monitoring, but the most commonly used are for periods 1, 3, 6, 12, 24, and 48 months. For SPI calculations, 50 years of data usage is recommended even if 30 years of continuous data is sufficient (Guttman Citation1999).
Effective Drought Index (EDI) is calculated using daily data and its values are standardized in a manner similar to SPI values. When the EDI values range from −1.0 to 1.0, it is normal and when the EDI is less than or equal to −2.0, it is called a severe drought (Byun and Wilhite Citation1999). The EDI also provides an overview of drought duration. The Selyaninov’s hydrothermal coefficient (HTC) Index is commonly used to stabilize water-deficient areas, as it uses both precipitation and temperature parameters to accurately predict changes in crop moisture content. In terms of HTC values, very dry conditions represented by HTC < = 0.7, and dry conditions were assumed for < 0.7 and 1.0 of HTC (Selyaninov Citation1958). However, the Chinese -Z- Index (CZI) is easier to calculate compared to other drought indices and it can also be used as an alternative to the SPI, and statistical Z-scores or standard scores can be used as another drought indicator to monitor drought, but the Z-score is actually part of the CZI (Ju et al. Citation1997). Occasionally there is confusion with CZI and SPI. However, since gamma distribution or Pearson III type distribution is not used, it is much easy to calculate. Also, it is not advisable to use it in small time frames as no distribution function is used.
Especially, standardized precipitation evapotranspiration index (SPEI) has been developed to detect the effects of droughts due to global warming. Like PDSI, this index also considers the effect of evapotranspiration on drought severity but it is easy to calculate than the PDSI (Palmer Citation1965). The calculations of PDSI are more complicated than other meteorological drought indices because they are based not only on the precipitation at a specific location but also on the concept of supply and demand in the water balance equation. Like many other indices, PDSI responds to wet and dry conditions with values ranging from −4 to +4, the negative values indicating non-drought and drought, respectively (Palmer Citation1965). Humidity Index (HI) has to define in contrast to Aridity Index (AI) as a ratio of the monthly differences between precipitation and potential evapotranspiration when the precipitation is greater than the potential evapotranspiration and sum of the monthly values of the potential evapotranspiration for the number of months which are having excess rainfall at a specific location or area (Thornthwaite Citation1931, Citation1948). The sc-PDSI is calculated by automatically calibrating the empirical constants so that it can be used anywhere and calculating the PDSI. scPDSI shows a better spatial distribution in drought than PDSI, and analyses show that it also captures extreme wet and dry conditions well. The Palmer-Z index can also be introduced as a derivative of PDSI (Palmer Citation1965). The main difference in the Modified Palmer Drought Severity Index (MPDSI) Drought Index is the start and end time in drought calculation, but it responds better than PDSI, and it is more suitable for real-time monitoring. The Weighted Anomaly Standardized Precipitation (WASP) Index is used to summarize the weighted standardized monthly rainfall, and the main advantage of the WASP - Index is the use of the weighting factor, which also captures the variability of small rainfall at the beginning or end of the dry season (Lyon and Barnston Citation2005).
3.1.2. Location-specific hydrological drought indices
Hydrological droughts begin when there is an imbalance between water demand and supply due to abnormal depletion of water resources in rivers, groundwater, reservoirs, and lakes (Van Loon Citation2015). Compared to meteorological droughts and agricultural droughts, hydrological droughts can last from months to years, covering a wide area (Kim and Jehanzaib Citation2020). Recent research has scientifically confirmed the mechanism of a drought, as well as changes in time and spatial, and a number of articles have shown that drought is not simply a decrease in rainfall, but that is become more complex due to different hydrological processes (Kim and Jehanzaib Citation2020). Various researchers have further pointed out that more attention should be paid to the hydrological drought as its impact is greater than other droughts (Mishra and Singh Citation2010). represents most of the traditional drought indices used in hydrological drought monitoring studies worldwide.
Table 2. List of hydrological drought indices.
Hydrological drought indices are primarily developed based on hydrodynamic parameters such as river flow, runoff, reservoir water level, and groundwater level (Thakur et al. Citation2017). Furthermore, when critically assessing the hydrological drought indices, it appears that five drought indices called SDI, SWLI, SRSI, SSFI, and SMRI have been calculated using the SPI calculation approach by replacing precipitation with a hydrological parameter such as river discharge, reservoir water level, reservoir water supply respectively (Mtilatila et al. Citation2020). The destruction shown in the SMRI is that the sum of precipitation and snowmelt is used as a single parameter compared to other standardized indices. The Groundwater Resource Index (GRI) has been developed to quantify groundwater retention to assess drought conditions. Palmer Hydrological Drought Index (PHDI) compares meteorological and hydrological drought parameters over space and time (Heim Citation2002). Rainfall, evaporation, streamflow, reservoir storage, soil moisture, and snow water content are used to calculate the Aggregate Drought Index (ADI) separately, which are then used to extract the leading hydrological index from them using the correlation between the data through Principal Component Analysis (PCA). Reclamation Drought Index (RDI) calculation is done in the same way as SWSI, however, the temperature variable, as well as the duration, is also included in this index.
3.1.3. Location-specific/model-based agriculture drought monitoring indices
Crop Moisture Index (CMI) represents a short-term agricultural drought where rapid changes in soil moisture can be detected. CMI responds to normal conditions but does not represent local changes caused by isolated rainfall and analyzes precipitation and temperature in a water equilibrium model. Crop Water Stress Index (CWSI) is calculated using Actual Evapotranspiration (AET) and Potential Evapotranspiration (PET), which are calculated using canopy temperature, air temperature, and net radiation estimates, and the energy balance equation is also used (Jackson et al. Citation1981). When calculating the Crop Specific Drought Index (CSDI) in addition to climatic data such as temperature and rainfall, soil and crop phenomenon information is also required intensively. Corn Drought Index (Meyer et al. Citation1993) and Soybean Drought Index (Meyer et al. Citation1993) are some of the examples for CSDI. represents the list of traditionally used agriculture drought monitoring indices.
Table 3. List of agricultural drought monitoring indices (AET – Actual Evapotranspiration, PET – Potential Evapotranspiration, P – Precipitation, T – Temperature, SM – Soil Moisture).
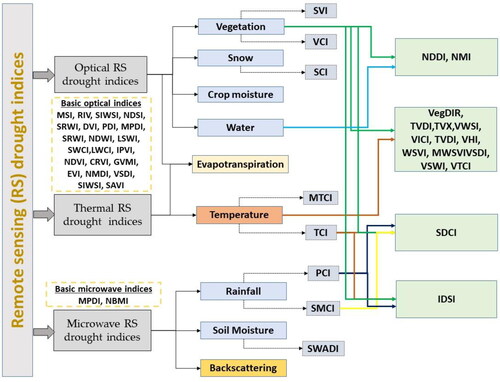
3.2. Remote sensing-based drought indices
As noted by many reviews, meteorological and hydrological drought monitoring has been at the forefront of traditional drought indices design, while agricultural drought monitoring has only a handful of indices (). But many reviews show that the development of agricultural drought indices has greatly increased since the advent of satellite Remote Sensing (AghaKouchak et al. Citation2015; Yoon et al. Citation2020). RS-based drought indices are derived from optical, infrared, thermal imaging reflective signatures, as well as microwave backscatter imaging. The variability of the physical parameters that arise in the soil and canopy surface during droughts is determined using red, infrared, shortwave, and thermal spectral bands in particular. The physical parameters used for drought monitoring based on satellite data are soil moisture, vegetation biomass, chlorophyll, organic matter, canopy or soil temperature, and surface water storage (Chanyang et al. Citation2020). The study of drought indices using remote sensing data can be divided into four main categories as optical, thermal, microwave, and integrated indices, and they can be further analyzed separately in detail according to meteorological, agricultural and hydrological drought.
Drought indices that identify and are used to develop drought indices are different from each other in terms of optical, thermal, and microwave remote sensing (). Most drought indices that are simply calculated using surface reflection or backscatter image bands can be called basic indices. The other category is the intermediate index, which is calculated using the numerical parameters of the minimum, maximum, average, or standard deviation of the long-term variables of these basic indices. The final category is the composite index generated by combining the various basic or intermediate indices with the optical, thermal, and microwave remote sensing drought indices. For example, the Integrated Drought Severity Index (IDSI) has been developed by integrating optical (VCI), thermal (TCI), and microwave (PCI) RS indices through principal component analysis (Amarnath et al. Citation2017). provides a detailed representation of the indices which were used to generate various RS drought indices and the relationship between each drought indices.
Figure 5. Relation and linkage of remote sensing-based drought indices.
3.2.1. Optical remote sensing drought indices
The traditional approach is more prominent for met and hydro drought monitoring, but the RS method dominates e agriculture drought monitoring. The approach to characterizing drought is mainly based on monitoring the soil water balance, its deficiency and crop health, water stress, snowpack, and canopy temperature (Paredes-Trejo and Barbosa Citation2017). A large number of indices have been developed to study the variability of the above parameters during the dry weather for drought monitoring in different ways. Furthermore, complex indices have also been developed by integrating several parameters that represent crop stress (Khan et al. Citation2016). describes the various simple optical RS-based drought indices in detail.
Table 4. List of optical remote sensing-based simple drought indices.
The moisture stress index (MSI) is calculated using simple ratios of SWIR and NIR reflectance bands of optical satellite data and while lower SMI values represent drought and higher values represent wetness. Normalized Difference Snow Index (NDSI) calculates the amount of snow cover in the area. Pixels with an NDSI value of> 0 are considered to have some amount of snow, and the magnitude of this value can be used to determine whether or not a hydrological drought occurs during snow season. This index is much more used full in temperature countries to monitor the drought. Perpendicular Drought Index (PDI) is a simple and effective index to use for drought monitoring but the weakness here is the lack of accuracy for vegetation-rich and barren lands. The Modified Perpendicular Drought Index (MPDI) was introduced to overcome the weaknesses in PDI and introduced the updated index by replacing a fraction of the vegetation to differentiate the effect of vegetation.
The Normalized Difference Water Index (NDWI) can be used to estimate the water content of vegetation canopies or submerged areas of the ground (Gao Citation1996). However, NDWI is sensitive to changes in the liquid water content of vegetation canopies and open water areas. The index calculates similar to NDWI but by using the second band of SWIR (2100 nm) called LSWI. If the value of both NDWI and LSWI is less than 0.1 basically represents the drought. The surface water capacity index (SWCI) defines as a surface moisture index constructed using the normalized difference between two SWIR bands of a given satellite system. SWCI has the ability to represent dry surface conditions and the value of the index ranges from −1 to 1. When the value of SWCI is less than 0.2, the particular area is under drought. The Tasseled Cap Wetness (TCW) index is also suitable for agricultural drought monitoring because it highlights the direct relationship between soil and vegetation, which are important physical parameters of the land surface through spectral characteristics through Tasseled Cap (TC) transformation (Crist and Cicone Citation1984; Dzakiyah and Saraswati Citation2020).
As defined by (Fensholt and Sandholt Citation2003), Normalized Difference Infrared Indexes (NDII) calculated using NIR, and SWIR images of optical satellite images show that lower values are closer to drought and higher values indicate no drought. Normalized Difference Vegetation Index (NDVI) is a remote sensing-based index for quantitative calculation of the greenness (health) of vegetation (Rouse et al. Citation1974). NDVI values range from 1 to −1, while healthy NDVI values are greater than 0.3, and lower NDVI values represent barren or drought-tolerant plants. It is best to study the time-series profile of NDVI to gain a better understanding of the agricultural drought (Kogan Citation1990). In addition to the NIR and Red bands the blue image band is used to calculate Enhanced Vegetation Index (EVI). Canopy variations in EVI are better suited for drought monitoring as they respond better to canopy type, variation, architecture, and plant physiognomy compared to NDVI (Huete et al. Citation2002). The Normalized Multiband Drought Index (NMDI) has been designed to capture the signatures of the soil and vegetation spectrum using the NIR, SWIR1, and SWIR2 image bands. NMDI is very sensitive to soil wetness and dryness as well as weak and thick vegetation, while dry bear soil and dry vegetation show a higher NMDI value and a lower nominal value for wet and heavy vegetation (Wang and Qu Citation2007). The optical and Shortwave Infrared Drought Index (VSDI) is calculated using optical spectral bands (SWIR, Red, and Blue), and it can be used effectively to monitor soil and vegetation moisture availability.
3.2.2. Optical satellite-based composite drought indices
Annual to weekly vegetation indices are used to study surface soil and vegetation dynamics over anomaly calculation (Marj and Meijerink Citation2011). This Snow Condition Index (SCI) index is obtained by calculating the change of Normalized Difference Snow Index (NDSI) over time relative to the long-term minimum and maximum values. This makes it more appropriate to use than the NDSI value alone for hydrological drought monitoring. The Vegetation Condition Index (VCI) is a simple index that defines the current vegetation status deviation relative to the long-term calculated minimum and maximum (Kogan Citation2001). The VCI index can be calculated using both NDVI and EVI; while the VCI values are closer to 0 it indicates the occurrence of agriculture drought. Both the NDVI and NDWI indices were used to compute the Normalize Difference Drought Index (NDDI) and Normalized Moisture Index (NMI) indices, and the distinctive feature of Weighted Difference Vegetation Index (WDVI) is the combination of the NIR image data with the NDWI index. describes the various optical satellite-based composite drought indices in detail.
Table 5. List of optical satellite-based composite drought indices (VI: Vegetation index, NDSI: Normalize Difference Snow Index, NDVI: Normalized Difference Vegetation Index (NDVI), Normalized Different Snow Index (NDSI), min: minimum value, max: maximum value, VIα: Long term mean, VIσ: Long term standard deviation, A: Agricultural Drought, H: Hydrological Drought).
3.2.3. Thermal remote sensing drought indices
Although various studies have shown that surface temperature obtained from remote sensing systems is suitable for measuring agricultural drought, it is more suitable for sparse canopies or empty lands than for vegetative lands. The accuracy of drought detection is proportional to the accuracy of the surface temperature measurement accuracy by remote sensor data, and the uncertainty of drought detection by temperature is further increased by the heterogeneity of the Earth's surface. Apparent thermal inertia (ATI) can be easily generated using remote sensor data; however, the uniqueness of ATI is that it is a relative measure of the solar albedo that reflects the temperature differences. The Temperature Condition Index (TCI) proposed by Kogan (Citation1995) and Kogan (Citation1997) is a simple drought index that can determine the temperature of vegetation and is more suitable for homogeneous terrain to detect the drought. Although the Normalized Difference Temperature Index (NDTI) is more suitable for drought monitoring than AAT and TCI as it eliminates seasonal variations, the calculation of NDTI is more complicated than the others. shows the indices used for drought monitoring based on thermal remote sensors.
Table 6. Thermal RS based drought monitoring indices (T: Temperature, max: Maximum value, min: Minimum value, a and c are constants, Ta and To: Modeled temperature, Ts: Images maximum temperature, A: Agriculture Drought, M: Meteorological Drought).
3.2.4. The optical and thermal composite index
shows some of the indices that have created drought monitoring, combining basic optical and thermal drought indices calculated using satellite imagery by various researchers. The Vegetation Health Index (VHI) is a combination of VCI and TCI data that provides extensive drought monitoring capabilities compare to VCI and TCI individually to monitor drought (Kogan Citation2002; Bhuiyan et al. Citation2006; Alahacoon et al. Citation2021). The Water Supply Vegetation Index (WSVI), also called as Vegetation Water Supply Index (VWSI), is calculated by the simple ratio between NDVI and temperature, while Modified Water Supply Vegetation Index (MWSVI) is calculated by the relative ratio of NDVI and T. However, various researchers have shown that composite indices are more suitable for drought monitoring than a single index.
Table 7. List of the optical and thermal composite indices (VCI: Vegetation Condition Index, TCI: Temperature Condition Index, LST: Land Surface Temperature, NDVI: Normalized Difference Vegetation Index, A: Agricultural Drought).
3.2.5. Microwave RS drought indices
Microwave remote sensing is used to detect the dielectric constant between water, soil, and vegetation and to provide information about the water content. This method neutralizes the effects of clouds, thus providing better results for drought studies (Wang and Qu Citation2009). Drought indices calculated by microwave remote sensing are shown in , with Precipitation Condition Index (PCI), Soil Moisture Condition Index (SMCI), and Soil Water Index (SWI) indices being the most commonly used indices.
Table 8. Microwave remote sensing drought indices (SM: Soil Moisture, SMfc: SM at field capacity, SMawc: SM at welting point, min: Minimum value, max: Maximum value, P: Precipitation, Tbv TbH: Brightness temperature at V and H polarization, BTt1 BTt2: Backscatter coefficient at different time steps, A: Agricultural Drought, H: Hydrological Drought).
The PCI calculation examines the variability in current rainfall relative to the long-term minimum and maximum rainfall. PCI values are in the range of 0-1, values close to 0 indicate marginal stress, and values close to 1 indicate a healthy state (Faridatul and Ahmed Citation2020). The Microwave Polarization Difference Index (MPDI) is designed to determine the soil moisture and visible depth of vegetation using polarized brightness temperature observed through V and H bands of microwave satellite images. The Normalized Backscatter Moisture Index (NBMI) provides the ability to map soil moisture conditions over a large area using C-band SAR data. It can provide high spatial and temporal resolution, and the disadvantage of that indices is the inability to penetrate vegetation canopies.
3.2.6. Integrated drought indices
Due to the different trends in drought detection in different remote sensing indices, researchers have created a composite index by combining basic drought indices using different methods as in (Wang et al. Citation2008; Hao and AghaKouchak Citation2013).
Table 9. List of integrated drought indices (Ts: Surface Temperature, Tmin Tmax: minimum and maximum of surface temperature at dry edge, Vi: Vegetation index, TVwet/der: Temperature Vegetation at wet and dry edge, Tc: Temperature condition, ETa: Actual evapotranspiration, ETref: reference evapotranspiration, TsNDVImax, TsNDVImin: maximum and minimum land surface temperatures of pixels which have same NDVI value in a study area, respectively, TSD: Total storage, Ta: Air temperature, APET: Actual PET, PPET: Potential ET, VCI: Vegetation Condition Index, TCI: Temperature Condition Index, PCI: Precipitation Condition Index, MTCI: Modified Temperature Condition Index, C: constant, N: Number).
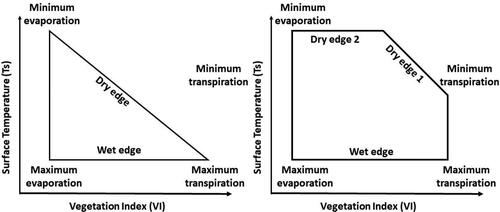
Vegetation Drought Response Index (VegDRI) is a hybrid drought index produced by combining satellite data-based calculations on climatic, biophysical features, and vegetation conditions. The concept of VegDRI was introduced by Rouse et al. (Citation1974) based only on NDVI and has proven to provide valuable information on plant health. This indicator represents the vegetation stress associated with the drought and can perform calculations for regional scales at medium to high resolution. However, it is also possible that the stress on vegetation cannot be identified based on the variability of the NDV alone (Heim Citation2002). The VTCI, TVDI, TWI, and TVI indices are designed using the scatter plot approach (Triangular or trapezoidal) of temperature and vegetation indices, as shown in . This approach mostly works on the regional scale, and it is not working on the small scale. The VTCI, TVDI, TWI, and TVI indices combine NDVI (vegetation) and LST (thermal) characteristics, and they can be used to effectively monitor drought based on temperature and vegetation conditions (Patel et al. Citation2012).
Figure 6. Triangular and trapezoidal representation of Temperature (T) and Vegetation indices (Sandholt et al. Citation2002).
The Scaled Drought Severity Index (SDSI) was developed by Rhee et al. (Citation2010) and is used as a multi-sensor index to monitor agricultural drought in arid, semi-arid, and humid areas. Here the three derivatives of vegetation, precipitation, and Temperatures such as VCI, PCI, and TCI are combined on a scale from 0 to 1. The Vegetation Soil-Water Deficit (VSWD) method differs from other drought indices methods in that it combines the parameters of precipitation, soil moisture, and Potential EvapoTranspiration (PET) to generate the composite drought index. Therefore, using the VSWD index can identify the drought with greater accuracy. The average surface/terrestrial water storage is calculated based on gravity measurements based on the Gravity Recovery And Climate Experiment (GRACE) satellite data to generate the Total Storage Deficit Index (TSDI). The Water Requirement Satisfactory Index (WRSI) is used to monitor crop performance during the growing season using the actual and potential evapotranspiration ratio, which indicates the amount of water in the crop. This WRSI is crop-specific and responds directly to drought stress.
3.3. Socio-economic drought indices
Adequate drought indices for socio-economic drought monitoring and analysis were not created until recently. Over the past few years, however, researchers have been able to develop several socio-economic indices such as Multivariate Standardized Reliability and Resilience Index (MSRRI), Water Resources System Resilience Index (WRSRI), and Socioeconomic drought index (SEDI).
3.3.1. Multivariate Standardized Reliability and Resilience Index (MSRRI)
Two new indices called Water Storage Resilience (WSR) index and the Inflow-Demand Reliability (IDR) index have been developed to calculate MSRRI (Zhao et al. Citation2019). The IDR index is derived by calculating the difference in the percentage of water flow to the water source that is considered relative to the water demand over a given period of time. The WSR index calculates whether the considered water storage can meet the water demand for the selected period of the reservoir. The key factors that depend on the value of the year are the monthly inflow, the monthly water demand, the monthly storage, and the total water demand. The statistical calculations marginal probabilities, empirical probability transformation, multivariate model of the Gringorten plotting position were used to calculate MSRRI.
3.3.2. Water Resources System Resilience Index (WRSRI)
Water Resources System Resilience Index (WRSRI) represents the percentage of pre-water shortages for a socio-economic drought that can be recovered from excess water during the periods considered by analyzing historical drought occurrences (Liu et al. Citation2020). This approach is much more similar to MSRRI approach.
3.3.3. Socioeconomic Drought Index (SEDI)
The Socio-Economic Drought Index (SEDI) is designed to identify and evaluate socio-economic drought events of varying severity, i.e., moderate, severe, and extreme (Shi et al. Citation2018). First, the minimum water requirement (MWR) of the river basin required to carry out the various functions of the river basin without interruption is calculated. Secondly, the occurrence and duration of hydrological drought are determined using data discharge data recorded at either hydrological station or simulated through the hydrological model. Finally, the SEDI value can be calculated by combining the effects of water scarcity and drought periods calculated above and then categorized into four different severity classes as shown in (Shi et al. Citation2018).
Table 10. Classification of Socioeconomic drought index (SEDI – Shi et al. Citation2018).
3.4. Drought monitoring platforms and indices
Researchers around the world have introduced a variety of drought indices that have been used more effectively to build different levels of drought monitoring platforms. Considering the world's drought monitoring platforms, they can be identified as global, continental, and country-level systems. What is more special about these platforms is that they can detect the spread of drought all over the world at once. shows the information on several of the platforms analyzed, indicating that more than 90% of the SPI index has been used and that only the Agricultural and Meteorological Drought Index has been used.
Table 11. List of global drought monitoring platforms.
4. Conclusions
As a result of decades of hard work by various researchers and scientists, systematically developed drought indices have opened up more scope for a more analytical study of the world's historical, current, and future droughts. In the early days of drought index development, they were almost all based on changes in the drought indicator at a given location. Over time, however, more complex and productive drought indices were developed by combining different drought indices. On the other hand, a study of drought characteristics is an essential factor in drought management operations, and drought indices provide the qualitative and quantitative information required for it. Furthermore, drought indices can be used specifically for historical drought monitoring, drought forecasting, drought level or intensity calculations, contingency planning, impact assessment, and drought forecasting, as well as drought hazard, vulnerability, and risk assessment.
There were 111 drought indices reviewed in this study, which fall into two categories: traditional (location-specific/model) and remote sensing. Out of 111 indices, 44 belong to the traditional indices and 67 belong to the remote sensing section. This review has found that researchers have created the highest number of indices to monitor meteorological drought based on conventional (location-specific) data and that number is 22. Although 14 indices can be identified for hydrological drought monitoring, it is striking that there are only 7 indices for agricultural drought monitoring. One of the reasons for having fewer indices based on location-specific data for agricultural drought monitoring is the practical difficulties in measuring agriculture drought indices. However, physically measured parameters are used to calculate location-specific drought indices, and the popularity of these indices seems to be steadily declining due to high data cost, unavailability of long-term data, and significant data gaps. The main factor influencing the decline in interest in those drought indices is the availability of satellite data, which is freely available and provides other advantages such as easy calculation and data handling, large spatial coverage, data availability at high spatial, temporal resolution, etc.
The review found that the PDSI, SPI, and NDVI indices were the most popular in drought monitoring and were used equally for all parts of the world. This is best illustrated by the number of citations available for these indexes, for example, SPI has the highest number of citations when considering location-based indexes at 9230, followed by PDSI with 6510 citations. However, it also appeared that there was a fundamental lack of a universal definition of some drought indices. Furthermore, the NDVI index is widely used in comparison to other basic indices to create various compact drought indices, and the NDVI index shows a high number of citations of 9433, among other RS based drought indices. In some drought indices, the originally proposed index (e.g., VHI, TCI, VCI, SWI) may be modified or re-presented in another journal (Kogan Citation1990, Citation1995, Citation1997, Citation2001, Citation2002; Bhuiyan Citation2004; Bhuiyan et al. Citation2006). In such cases, the total number of citations for a particular index can be calculated using all citations in different articles. But in this study, the focus is only on parent article of the particular index.
Currently, there are only a handful of drought indices that indicate the effects of drought, but about 90% to 95% of indices are depending on the drought types and applications. Therefore, it is more appropriate for researchers to pay more attention to the design of the drought indices and applications coverage relative to the impact of the drought, as ability or drought recovery is depends on the impact of drought. With the advent of satellite remote sensing data, a rapid increase in new drought indices designs and drought studies was detected. The study of satellite data-based drought indices showed that most of the historically calculated location-based (more than 95%) drought indices could be easily calculated using RS data with greater spatial resolution. Therefore, RS-based drought indices are also used by many researchers around the world as an important substitute for location-based or traditional drought indices.
The inconsistency identified in this study is that the same drought index has been used by different researchers to analyze different types of drought. As an example, the SPI index has been used for meteorological, hydrological, and agricultural drought monitoring. Someone can argue how successful this is. However, this detailed review confirms that the number of the drought indices created for socio-economic drought monitoring is less than the number of fingers on the hand, and those indices have been developed over the past five years. Thus, socio-economic drought monitoring seems to have received less attention from researchers, and in fact, this requires more data as well as more complex analytical techniques to calculate.
Considering the satellite-based drought monitoring indices, it is clear that more than 90% of the total indices are designed for agricultural monitoring. However, it can be identified an increasing tendency to generate meteorological and hydrological drought indices using satellite-derived data such as precipitation, snow, currents, surface water area, etc. Long-term (1960–2020) analysis of drought studies around the world has identified an increase in the number of drought studies due to satellite data (Landsat) since the 1970s, and the number of studies has increased exponentially since 2000 due to the availability of MODIS data. Despite the increase in the number of studies at that time, there were no sophisticated methods for data processing and data handling as they exist today. However, with today's existing data visualization and processing platforms such as Google Earth Engine (GEE), Copernicus cloud platform, and data analysis techniques (Artificial Intelligence – AI, Neural Networks – NN and Big data, cloud computing) it is possible to predict that more effective and accurate drought indices will be generated.
However, the study emphasizes that a large number of global and regional drought monitoring platforms are being created as a result of the efforts of researchers who have been creating drought indices over the years. These platforms play an invaluable role in drought risk management. A review of the most popular drought monitoring platforms used for the study also found that 90% of those platforms provide weekly or monthly drought information using SPI indices and about 60% use NDVI or its derivatives. This is also a good example of the popularity of SPI and NDVI drought monitoring indices.
Despite the popularity of RS drought indices in drought monitoring around the world, there are a number of challenges still to be addressed. When considering satellite data major challenges are the inefficiency of the use of optical satellite imagery in tropical countries for short-term drought monitoring due to intensive clouds and less possibility for fine-scale drought monitoring. Furthermore, creating a more consistent historical database, integrating future and historical-remote remote sensing data into a common platform for improving the system for drought forecasting, and developing a methodology for the existence and filling of historical data gaps are more challenging. However, it would be more appropriate to develop a protocol to verify the validity of both remote sensor-based and location-based drought indices, which would be of great help for further improvement of drought studies.
Acknowledgements
The authors are highly acknowledged for the assistance and facilities provided by the Department of Physics, University of Colombo and International Water Management Institute (IWMI).
Conflicts of interest
The authors declare no conflict of interest.
Data availability
All data, models, and code generated or used during the study appear in the submitted article and the data extracted from Scopus (https://www.scopus.com/home.uri), Google Scholar (https://scholar.google.com/) and Science Direct (https://www.sciencedirect.com/).
References
- Abubakar HB, Newete SW, Scholes MC. 2020. Drought characterization and trend detection using the reconnaissance drought index for setsoto municipality of the Free State province of South Africa and the impact on maize yield. Water. 12(11):2993.
- AghaKouchak A, Farahmand A, Melton FS, Teixeira J, Anderson MC, Wardlow BD, Hain CR. 2015. Remote sensing of drought: Progress, challenges and opportunities. Rev Geophys. 53(2):452–480.
- Akhtari R, Morid S, Mahdian MH, Smakhtin V. 2009. Assessment of areal interpolation methods for spatial analysis of SPI and EDI drought indices. Int J Climatol. 29(1):135–145.
- Alahacoon N, Edirisinghe M, Ranagalage M. 2021. Satellite-based meteorological and agricultural drought monitoring for agricultural sustainability in Sri Lanka. Sustainability. 13(6):3427.
- Alam NM, Rajeev R, Jana C, Singh R, Patra S, Ghosh B, Sharma NK. 2014. Drought classification for policy planning and sustainable agricultural production in India. Popular Kheti. 2:53–59.
- Alsumaiei AA. 2020. Monitoring hydrometeorological droughts using a simplified precipitation index. Climate. 8(2):19.
- Amarnath G, Pani P, Alahacoon N, Chockalingam J, Mondal S, Matheswaran K, Sikka A, Rao KV, Smakhtin V. 2017. Chapter 10 – Development of a system for drought monitoring and assessment in South Asia. Curr Dir Water Scarcity Res. 2:133–163.
- Anderson MC, Hain C, Wardlow B, Pimstein A, Mecikalski JR, Kustas WP. 2011. Evaluation of drought indices based on thermal remote sensing of evapotranspiration over the continental United States. J Clim. 24(8):2025–2044.
- Arab D, Elyasi A, Tavakolifar H, Karamouz M. 2010. Developing an integrated drought monitoring system based on socioeconomic drought in a transboundary river basin: a case study. In: World Environmental and Water Resources Congress 2010: Challenges of Change (R. N. Palmer, ed.), ASCE, Reston, VA, USA, pp. 2754–2761.
- Ashok K, Mishra VP, Singh A. 2010. Review of drought concepts. J Hydrol. 391(1-2):202–216.
- Bai J, Cui Q, Chen D, Yu H, Mao X, Meng L, Cai Y. 2018. Assessment of the SMAP-Derived Soil Water Deficit Index (SWDI-SMAP) as an Agricultural Drought Index in China. Remote Sens. 10(8):1302.
- Baret F, Guyot G. 1991. Potentials and limits of vegetation indices for LAI and APAR assessment. Remote Sens Environ. 35(2-3):161–173.
- Bhalme HN, Mooley DA. 1980. Large-scale droughts/floods and monsoon circulation. Mon Wea Rev. 108(8):1197–1211.
- Bhuiyan C. 2004. Various drought indices for monitoring drought condition in Aravalli Terrain of India. ISPRS Archives – Volume XXXV Part B7, 2004, XXth ISPRS Congress, Technical Commission VII, July 12-23, 2004, Istanbul, Turkey (Altan O, editor.). International Society for Photogrammetry and Remote Sensing; p. 1283–1288.
- Bhuiyan C, Singh RP, Kogan FN. 2006. Monitoring drought dynamics in the Aravalli Terrain (India) using different indices based on ground and remote sensing data. Int J Appl Earth Obs Geoinf. 8(4):289–303.
- Brown JF, Wardlow BD, Tadesse T, Hayes MJ, Reed BC. 2008. The Vegetation Drought Response Index (VegDRI): a new integrated approach for monitoring drought stress in vegetation. GIScience Remote Sens. 45(1):16–46.
- Bryant S, Arnell NW, Law FM. 1992. The long-term context for the current hydrological drought. Institute of Water and Environmental Management (IWEM) Conference on the Management of Scarce Water Resources, Brighton, UK, 13–14 October 1992.
- Byun HR, Wilhite DA. 1999. Objective quantification of drought severity and duration climate. J Clim. 12(9):2747–2756.
- Cao Y, Chen S, Wang L, Zhu B, Lu T, Yu Y. 2019. An agricultural drought index for assessing droughts using a water balance method: a case study in Jilin Province, Northeast China. Remote Sens. 11(9):1066.
- Carlson TN, Gillies RR, Perry EM. 1994. A method to make use of thermal infrared temperature and NDVI measurements to infer surface soil water content and fractional vegetation cover. Remote Sens Rev. 9(1-2):161–173.
- Ceccato P, Gobron N, Flasse S, Pinty B, Tarantola S. 2002. Designing a spectral index to estimate vegetation water content from remote sensing data: part 1: theoretical approach. Remote Sens Environ. 82 (2-3):188–197. 00037–8.
- Chandrasekara SSK, Kwon HH, Vithanage M, Obeysekera J, Kim TW. 2021. Drought in South Asia: a review of drought assessment and prediction in South Asian countries. Atmosphere. 12(3):369.
- Chanyang S, Do-Hyuk K, Lim KJ, Yang JE, Yongchul S, Younghun J. 2020. Soil moisture–vegetation–carbon flux relationship under agricultural drought condition using optical multispectral sensor. Remote Sens. 12 (9):1359.
- Chen W, Xiao Q, Sheng Y. 1994. Application of the anomaly vegetation index to monitoring heavy drought. Remote Sens Environ. 9 (2):106–112.
- Crippen RE. 1990. Calculating the vegetation index faster. Remote Sens Environ. 34 (1):71–73.
- Crist EP, Cicone RC. 1984. A physically based transformation of Thematic Mapper data – the TM Tasseled Cap. IEEE Trans Geosci Remote Sensing. GE-22(3):256–263.
- Davy J. 1861. X. – on an unusual drought in the Lake District in 1859. Trans R Soc Edinb. 22(2):313–318.
- Ding Y, Hayes MJ, Melissa W. 2010. Measuring economic impacts of drought: a review and discussion. Papers in Natural Resources. 196.
- Dzakiyah IF, Saraswati R. 2020. Drought area of agricultural land using Tasseled Cap Transformation (TCT) method in Ciampel Subdistrict Karawang Regency. E3S Web Conf. 211:02005.
- Faridatul MI, Ahmed B. 2020. Assessing agricultural vulnerability to drought in a heterogeneous environment: a remote sensing-based approach. Remote Sens. 12(20):3363.
- Fensholt R, Sandholt I. 2003. Derivation of a shortwave infrared water stress index from MODIS near- and shortwave infrared data in a semiarid environment. Remote Sens Environ. 87(1):111–121.
- Foley JC. 1957. Droughts in Australia: review of records from earliest years of settlement to 1955. Australian Bureau of Meteorology, Melbourne, Australia.
- Gao B. 1996. NDWI – a normalized difference water index for remote sensing of vegetation liquid water from space. Remote Sens Environ. 58(3):257–266.
- Ghosh KG. 2019. Spatial and temporal appraisal of drought jeopardy over the Gangetic West Bengal, eastern India. Geoenviron Disasters. 6(1): 1–21.
- Ghulam A, Li Z-L, Qin Q, Yimit H, Wang J. 2008. Estimating crop water stress with ETM + NIR and SWIR data. Agric for Meteorol. 148(11):1679–1695.
- Ghulam A, Qin Q, Teyip T, Li ZL. 2007. Modified perpendicular drought index (MPDI): a real-time drought monitoring method. ISPRS J Photogramm Remote Sens. 62(2):150–164.
- Gibbs WJ, Maher JV. 1967. Rainfall deciles as drought indicators. Austral Bur Meteorol Bull. 48:37.
- Gommes HD. 2012. Chapter 6, Agrometeorological forecasting. In: edited by Trina Hershkovitz (Ed.), World Meteorological Organization Guide to Agricultural Meteorological Practices (GAMP). WMO-No. 134. Geneva (Switzerland): World Meteorological Organization, p. 49.
- Gusyev MA, Hasegawa A, Magome J, Kuribayashi D, Sawano D, Lee S. 2015. Drought assessment in the Pampanga River Basin, the Philippines. Part 1: a role of dam infrastructure in historical droughts. Proceedings of the 21st International Congress on Modelling and Simulation (MODSIM 2015), Broadbeach, QLD, Australia.
- Gu Y, Brown JF, Verdin JP, Wardlow B. 2007. A five-year analysis of MODIS NDVI and NDWI for grassland drought assessment over the central Great Plains of the United States. Geophys Res Lett. 34:6.
- Guttman NB. 1999. Accepting the standardized precipitation index: a calculation algorithm. J Am Water Resour Assoc. 35(2):311–322.
- Hao Z, AghaKouchak A. 2013. Multivariate Standardized Drought Index: a parametric multi-index model. Adv Water Resour. 57:12–18.
- Hassan QK, Bourque CP-A, Meng F-R, Cox RM. 2007. A wetness index using terrain-corrected surface temperature and normalized difference vegetation index derived from standard MODIS products: an evaluation of its use in a humid forest-dominated region of eastern Canada. Sensors. 7(10):2028–2048.
- Hayes MJ. 2006. Drought indices. In: Considine GD, editor. Van Nostrand's Scientific Encyclopedia, Springer, p. 11.
- Hayes MJ, Svoboda MD, Wardlow BD, Anderson MC, Kogan F. 2012. Drought monitoring: historical and current perspectives. Vol. 94. Drought Mitigation Center Faculty Publications, University of Nebraska, Lincoln. http://digitalcommons.unl.edu/droughtfacpub/94.
- Heim RR. 2002. A review of twentieth-century drought indices used in the United States. Bull Amer Meteor Soc. 83(8):1149–1165.
- Hochstöger S, Pfeil I, Amarnath G, Pani P, Enenkel M, Wagner W. 2017. Enhanced agricultural drought monitoring using a soil water anomaly-based drought index in south-west India. Geophysical Research Abstracts 19, EGU2017–14251. EGU General Assembly 2017.
- Hoffmann D, Gallant AJE, Arblaster JM. 2020. Uncertainties in drought from index and data selection. J Geophys Res Atmos. 125:e2019JD031946.
- Huete A, Didan K, Miura T, Rodriguez EP, Gao X, Ferreira LG. 2002. Overview of the radiometric and biophysical performance of the MODIS vegetation indices. Remote Sens Environ. 83(1-2):195–213.
- Huete AR. 1988. A soil-adjusted vegetation index (SAVI). Remote Sens Environ. 25(3):295–309.
- Hunt ER, Rock BN. 1989. Detection of changes in leaf water content using near-and middle-infrared reflectances. Remote Sens Environ. 30(1):43–54.
- Hunt ER, Rock BN, Nobel PS. 1987. Measurement of leaf relative water content by infrared reflectance. Remote Sens. Environ. 22 (3):429–435.
- Huschke RE. 1959. Glossary of meteorology. Am Meteorol Soc. 345:638.
- Idso SB, Jackson RD, Pinter PJ, Reginato RJ, Hatfield JL. 1981. Normalizing the stress-degree-day parameter for environmental variability. Agric Meteorol. 24:45–55.
- IPCC Special Report. 2012. Managing the risks of extreme events and disasters to advance climate change adaptation: special report of the Intergovernmental Panel on Climate Change (IPCC) – (2012), IPCC Working Group II. United Kingdom: Cambridge University Press.
- Jackson RD, Idso SB, Reginato RJ, Pinter PJ. 1981. Canopy temperature as a crop water stress indicator. Water Resour Res. 17(4):1133–1138.
- Jang J, Viau A, Anctil F. 2006. Thermal-water stress index from satellite images. Int J Remote Sens. 27(8):1619–1639.
- Jayawardhana WGNN, Chathurange VMI. 2020. Investigate the sensitivity of the satellite-based agricultural drought indices to monitor the drought condition of paddy and introduction to enhanced multi-temporal drought indices. J Remote Sens GIS. 9:272.
- Ju XS, Yang XW, Chen LJ, Wang YM. 1997. Research on determination of indices and division of regional flood/drought grades in China (in Chinese). Q J Appl Meteorol. 8:26–33.
- Jung S, Estrella N, Pfaffl MW, Hartmann S, Ewald F, Menzel A. 2021. Impact of elevated air temperature and drought on pollen characteristics of major agricultural grass species. Plos One. 16(3):e0248759.
- Keetch JJ, Byram GM. 1968. A drought index for forest fire control. Res. Pap. SE38. Asheville (NC): U.S. Department of Agriculture. Forest Service. Southeastern Forest Experiment Station. 1–32.
- Keyantash JA, Dracup JA. 2004. An aggregate drought index: assessing drought severity based on fluctuations in the hydrologic cycle and surface water storage. Water Resour Res. 40(9):W09304.
- Khan A, Sovero V, Gemenet D. 2016. Genome-assisted breeding for drought resistance. Curr Genomics. 17(4):330–342.
- Kim TW, Jehanzaib M. 2020. Drought risk analysis, forecasting and assessment under climate change. Water 12:1862.
- Kim TW, Jehanzaib M. 2020. Drought risk analysis, forecasting and assessment under climate change. Water. 12(7):1862.
- Kogan FN. 1990. Remote sensing of weather impacts on vegetation in non-homogeneous areas. Int J Remote Sens. 11 (8):1405–1419.
- Kogan FN. 1995. Application of vegetation index and brightness temperature for drought detection. Adv Sp Res. 15(11):91–100.
- Kogan FN. 1997. Global drought watch from space. Bull Am Meteor Soc. 78(4):621–636.
- Kogan FN. 2001. Operational space technology for global vegetationassessment. Bull Am Meteor Soc. 82 (9):1949–1964.
- Kogan FN. 2002. World droughts in the new millennium from AVHRRbased Vegetation Health Indices. Eos Trans Am Geophys Union. 83 (48):562–563.
- Korres N, Norsworthy JK, Burgos N, Oosterhuis D. 2016. Temperature and drought impacts on rice production: an agronomic perspective regarding short- and long-term adaptation measures. Water Resour Rural Dev. 9: 12–27.
- Lambin E, Ehrlich D. 1995. Combining vegetation indices and surface temperature for land-cover mapping at broad spatial scales. Int J Remote Sens. 16 (3):573–579.
- Leblanc M, Tweed S, Van Dijk A, Timbal B. 2012. A review of historic and future hydrological changes in the Murray-Darling basin. Global Planet Change Planet Change. 80:226–246.
- Lillesand T, Kiefer R. 1987. Remote sensing and image interpretation. New York (NY): John Wiley; p. 721.
- Lin H, Wang J, Li F, Xie Y, Jiang C, Sun L. 2020. Drought trends and the extreme drought frequency and characteristics under climate change based on SPI and HI in the upper and middle reaches of the Huai River Basin, China. Water. 12(4):1100.
- Liu HQ, Huete A. 1995. A feedback based modification of the NDVI to minimize canopy background and atmospheric noise. IEEE Trans Geosci Remote Sensing. 33 (2):457–465.
- Liu S, Shi H, Sivakumar B. 2020. Socioeconomic drought under growing population and changing climate: a new index considering the resilience of a regional water resources system. J Geophys Res Atmos. 125: 1–15.
- Liu X, Xu X, Yu M, Lu J. 2016. Hydrological drought forecasting and assessment based on the standardized stream index in the Southwest China. Procedia Eng. 154:733–737.
- Loucks DP. 2015. Debates-perspectives on socio‐hydrology: simulating hydrologic‐human interactions. Water Resour Res. 51(6):4789–4794.
- Lyon B, Barnston AG. 2005. ENSO and the spatial extent of interannual precipitation extremes in tropical land areas. J Clim. 18(23):5095–5109.
- Madani K. 2014. Water management in Iran: what is causing the looming crisis? J Environ Stud Sci. 4(4):315–328.
- Manatsa D, Mushore T, Lenouo A. 2017. Improved predictability of droughts over southern Africa using the standardized precipitation evapotranspiration index and ENSO. Theor Appl Climatol. 127(1-2):259–274.
- Marj AF, Meijerink AMJ. 2011. Agricultural drought forecasting using satellite images, climate indices and artificial neural network. Int J Remote Sens. 32(24):9707–9719.
- Matera A, Fontana G, Marletto V, Zinoni F, Botarelli L, Tomei F. 2007. Use of a New Agricultural Drought Index within a Regional Drought Observatory. In: Rossi G, Vega T, Bonaccorso B, editors. Methods and tools for drought analysis and management. Water Science and Technology Library. Vol. 62. Dordrecht (The Netherlands): Springer.
- McKee TB, Doesken NJ, Kleist J. 1993. Drought monitoring with multiple timescales. Preprints, Eighth Conference on Applied Climatology, Anaheim, CA: American Meteorological Society; p. 179–184.
- McVicar TR, Jupp DL. 1998. The current and potential operational uses of remote sensing to aid decisions on drought exceptional circumstances in Australia: a review. Agric Syst. 57(3):399–468.
- Meisam E, Jaber R, Armin N, Javad B. 2014. Monitoring agricultural drought using the stand Q14 ardized effective precipitation index. J Irrig Drain Eng. 141: 04014044
- Mekonen AA, Berlie AB, Ferede MB. 2020. Spatial and temporal drought incidence analysis in the northeastern highlands of Ethiopia. Geoenviron Disasters. 7(1):10.
- Mendicino G, Senatore A, Versace P. 2008. A Groundwater Resource Index (GRI) for drought monitoring and forecasting in a mediterranean climate. J Hydrol. 357(3-4):282–302.
- Men-xin WU, Hou-quan LU. 2016. A modified vegetation water supply index (MVWSI) and its application in drought monitoring over Sichuan and Chongqing, China. J Integr Agric. 15:2132–2141.
- Meyer SJ, Hubbard KG, Wilhite DA. 1993. A crop-specific drought index for corn. I. Model development and validation. Agron J. 85(2):388–395.
- Michael H, Mark S, Nicole W, Melissa W. 2011. The Lincoln Declaration on drought indices: universal meteorological drought index recommended. Bull Am Meterol Soc. 92:485–488.
- Mirza B, Baig S, Shahid A, Straquadine S. 2013. Making rainfed agriculture sustainable through environmental friendly technologies in Pakistan: a review. Int Soil Water Conserv Res. 1(2):36–52.
- Mishra AK, Singh VP. 2010. A review of drought concepts. J Hydrol. 391(1-2):202–216.
- Mishra V, Cherkauer KA, Shukla S. 2010. Assessment of drought due to historic climate variability and projected future climate change in the midwestern United States. J Hydrol. 11(1):46–68.
- Miyan MA. 2015. Droughts in Asian least developed countries vulnerability and sustainability. Weather Clim Extremes. 7:8–23.
- Moran SM. 2004. Chapter 8. Thermal Infrared Measurements as Indicator of Plant Ecosystem Health,” In: DA Quatochi and JC Luvall, Eds., Thermal Remote Sensing in Land Surface Processes, Tailor and Frances, London, 2004, pp. 257–282.
- Mtilatila L, Bronstert A, Bürger G, Vormoor K. 2020. Meteorological and hydrological drought assessment in Lake Malawi and Shire River basins (1970–2013). Hydrol Sci J. 65(16):2750–2764.
- Mukherjee S, Mishra A, Trenberth KE. 2018. Climate change and drought: a perspective on drought indices. Curr Clim Change RepRep. 4(2):145–163.
- Myronidis D, Fotakis D, Ioannou K, Sgouropoulou K. 2018. Comparison of ten notable meteorological drought indices on tracking the effect of drought on streamflow. Hydrol Sci J. 63(15-16):2005–2016.
- Nalbantis I, Tsakiris G. 2009. Assessment of hydrological drought revisited. Water Resour Manage. 23(5):881–897.
- Narasimhan B, Srinivasan R. 2005. Development and evaluation of Soil Moisture Deficit Index (SMDI) and Evapotranspiration Deficit Index (ETDI) for agricultural drought monitoring. Agric For Meteorol. 133(1-4):69–88.
- Niemeyer S. 2008. New drought indices. Options Méditerr Sér A: Sémin Méditerr. 80:267–274.
- Palmer WC. 1968. Keeping track of crop moisture conditions, nationwide: the New Crop Moisture Index. Weatherwise. 21(4):156–161.
- Palmer WC. 1965. Meteorological drought. Research Paper No. 45. Washington (DC): U.S. Department of Commerce Weather Bureau.
- Paredes-Trejo F, Barbosa H. 2017. Evaluation of the SMOS-derived Soil Water Deficit Index as Agricultural Drought Index in Northeast of Brazil. Water. 9(6):377.
- Parry S, Wilby RL, Prudhomme C, Wood PJ. 2016. A systematic assessment of drought termination in the United Kingdom. Hydrol Earth Syst Sci. 20(10):4265–4281.
- Parsons DJ, Rey D, Tanguy M, Ian P, Regional H. 2019. Variations in the link between drought indices and reported agricultural impacts of drought. Agric Syst. 173:119–129.
- Patel N, Parida B, Venus V, Saha S, Dadhwal V. 2012. Analysis of agricultural drought using Vegetation Temperature Condition Index (VTCI) from TERRA/MODIS satellite data. Environ Monit Assess. 184(12):7153–7163.
- Pearson RL, Miller LD. 1972. Remote mapping of standing crop biomass for estimation of the productivity of the shortgrass prairie, Pawnee National Grasslands, Colorado. Proceedings of the 8th International Symposium on Remote Sensing of the Environment II; p. 1355–1379.
- Pei Z, Fang S, Wang L, Yang W. 2020. Comparative analysis of drought indicated by the SPI and SPEI at various timescales in Inner Mongolia, China. Water. 12(7):1925.
- Peters A, Walter-Shea E, Ji L. 2002. Drought monitoring with NDVI-based standardized vegetation index. Photogarmm Eng Remote Sens. 68:71–75.
- Qi J, Chehbouni A, Huete AR, Kerr YH, Sorooshian S. 1994. A modified soil adjusted vegetation index. Remote Sens Environ. 48(2):119–126.
- Rhee J, Im J, Carbone GJ. 2010. Monitoring agricultural drought for arid and humid regions using multi-sensor remote sensing data. Remote Sens Environ. 114(12):2875–2887.
- Richardson AJ, Wiegand CL. 1977. Distinguishing vegetation from soil background information (by gray mapping of Landsat MSS data). Photogramm Eng Remote Sens. 43:1541–1552.
- Rondeaux G, Steven M, Baret F. 1996. Optimization of soil-adjusted vegetation indices. Remote Sens Environ. 55(2):95–107.
- Rosenberg NJ. 1979. Drought in the Great Plains-research on impacts and strategies. In: Proceedings of the Workshop on Research in Great Plains Drought Management Strategies, University of Nebraska, Lincoln, Lincoln, NE, March 26–28.
- Rouse J, Haas R, Schell J, Deering D, Harlan J. 1974. Monitoring the vernal advancement and retrogradation (greenwave effect) of natural vegetation. College Station (TX): Texas A & M University, Remote Sens. Centre; p. 362.
- Sánchez N, González-Zamora Á, Piles M, Martínez FJ. 2016. A new soil moisture agricultural drought index (SMADI) integrating MODIS and SMOS products: a case of study over the Iberian Peninsula. Remote Sens. 8(4):287.
- Sandholt I, Rasmussen K, Andersen J. 2002. A simple interpretation of the surface temperature/vegetation index space for assessment of surface moisture status. Remote Sens Environ. 79(2-3):213–224.
- Scheidt S, Ramsey M, Lancaster N. 2009. Determining soil moisture and sediment availability at White Sands Dune Field, NM from apparent thermal inertia data. J Geophys Res Earth Surf. 115, F02019, p. 23.
- Selyaninov GT. 1958. The nature and dynamics of the droughts. In Droughts in the USSR, their nature, recurrences and impact on crops yields. Leningrad (Russia): Gidrometeoizdat. (in Russian), pp. 5-30.
- Shafer SA, Dezman LE. 1982. Development of a surface water supply index (SWSI) to assess the severity of drought conditions in the snowpack runoff areas. Proceedings of the Western Snow cConferance, Reno, Nevada, p. 31.
- Shafer BA, Dezman L. 1982. Development of a surface water supply index (SWSI) to assess the severity of drought condition in snowpack runoff areas. 710.82, 164–175. https://www.droughtmanagement.info/literature/CSU_Development_SWSI_Assess_Severity_Drought_Conditions_Snowpack_Runoff_Areas_1982.pdf. Accessed 15th August 2021.
- Shi HAU, Chen JAU, Wang KAU, Niu J. 2018. A new method and a new index for identifying socioeconomic drought events under climate change: a case study of the East River basin in China. Sci Total Environ. 616-617:363–375. 10.1016/j.scitotenv.2017.10.321
- Shoshany M, Svoray T, Curran PJ, Foody GM, Perevolotsky A. 2000. The relationship between ERS-2 SAR backscatter and soil moisture: generalization from a humid to semi-arid transect. Int J Remote Sens. 21(11):2337–2343.
- Sophie B, Kerstin S, Kevin C, Jamie H, Mike A, Mark S, Cody K, Kelly S, Nicole W, Brian F, et al. 2016. Drought indicators revisited: the need for a wider consideration of environment and society. Wiley Interdiscip Rev Water. 3:516–536.
- Spinoni J, Barbosa P, Bucchignani E, Cassano J, Cavazos T, Christensen JH, Christensen OB, Coppola E, Evans J, Geyer B, et al. 2020. Future global meteorological drought hot spots: a study based on CORDEX data. J Clim. 33(9):3635–3661.
- Spinoni J, Barbosa P, Jager DA, McCormick N, Naumann G, Vogt JV, Magni D, Masante D, Mazzeschi M. 2019. A new global database of meteorological drought events from 1951 to 2016. J Hydrol Reg Stud. 22:100593.
- Stagge JH, Kohn I, Tallaksen LM, Stahl K. 2015. Modeling drought impact occurrence based on meteorological drought indices in Europe. J Hydrol. 530:37–50.
- Stahl K. 2001. Hydrological drought – a study across Europe [dissertation]. Freiburg (Germany): Albert-Ludwigs Universität Freiburg; p. 121.
- Staudinger M, Stahl K, Seibert J. 2015. A drought index accounting for snow. Geophysical Research Abstracts 17, EGU2015-9691-2, 2015 EGU General Assembly.
- Steinmann AC, Hayes MJ, Calvalcanti LFN. 2005. Drought indicators and triggers. Chapter 4. In: Wilhite D, editor. Drought and water crises: science, technology and management issues. New York (NY): Taylor and Francis; p. 71–93.
- Steinemann A, Hayes M, Cavalcanti L. 2005. Drought indicators and triggers. In: Wilhite D, editor. Drought and water crises: science, technology and management issues. Boca Raton (FL): CRC Press, p. 432.
- Thakur PK, Nikam BR, Garg V, Aggarwal SP, Chouksey A, Dhote PR, Ghosh S. 2017. Hydrological parameters estimation using remote sensing and GIS for Indian region: a review. Proc Natl Acad Sci, India, Sect A Phys Sci. 87(4):641–659.
- Thenkabail PS, Ward AD, Lyon JG. 1994. Landsat-5 Thematic Mapper models of soybean and corn crop characteristics. Int J Remote Sens. 15 (1):49–61.
- Thornthwaite CW. 1931. The climates of North America: according to a new classification. Geogr Rev. 21(4):633–655.
- Thornthwaite CW. 1948. An approach toward a rational classification of climate. Geogr Rev. 38(1):55–94. www.jstor.org/stable/210739.
- Thornthwaite CW, Mather JR. 1957. Instructions and tables for computing potential evapotranspiration and the water balance. Vol. 10. Johns Hopkins University, Laboratory in Climatology, Publ. in Climat, No. 3, Baltimore, Maryland.
- Tsakiris G. 2004. Meteorological drought assessment, paper prepared for the needs of the European Research Program MEDROPLAN. Zaragoza (Spain): Mediterranean Drought Preparedness and Mitigation Planning.
- Tucker CJ. 1979. Red and photographic infrared linear combinations for monitoring vegetation. Remote Sens Environ. 8(2):127–150.
- Valovcin FR. 1978. Spectral radiance of snow and clouds in the near infrared spectral region. AFGL-TR-78-0289, ADA 063761.
- Van Loon AF. 2015. Hydrological drought explained. WIREs Water. 2(4):359–392.
- Van Rooy MP. 1965. A Rainfall Anomaly Index independent of time and space. Notos. 14:43–48.
- Vasiliades L, Loukas A, Liberis N. 2011. A water balance derived drought index for Pinios River Basin, Greece. Water Resour Manage. 25(4):1087–1101.
- Verdin J, Klaver R. 2002. Grid‐cell‐based crop water accounting for the famine early warning system. Hydrol Process. 16(8):1617–1630.
- Vicente-Serrano SM, Beguería S, López-Moreno JI. 2010a. A multiscalar drought index sensitive to global warming: the standardized precipitation evapotranspiration index – SPEI. J Clim. 23(7):1696–1718.
- Vicente-Serrano SM, Beguería S, López-Moreno JI, Angulo M, El Kenawy A. 2010b. A new global 0.5◦ gridded dataset (1901–2006) of a multiscalar drought index: comparison with current drought index datasets based on the Palmer Drought Severity Index. J Hydrometeorol. 11(4):1033–1043.
- Vujica Y, Hall WA, Salas JD. 1977. Drought research needs. In: Proceedings of the Conference on Drought Research Needs. December 12–15. Colorado State University, Fort Collins, CO; p. 276.
- Wada Y, van Beek LPH, Viviroli D, Dürr HH, Weingartner R, Bierkens MFP. 2011. Global monthly water stress: 2. Water demand and severity of water stress. Water Resour Res. 47(7):W07518.
- Wagner W, Scipal K, Pathe C, Gerten D, Lucht W, Rudolf B. 2003. Evaluation of the agreement between the first global remotely sensed soil moisture data with model and precipitation data. J Geophys Res. 108(D19):4611.
- Wang L, Qu JJ. 2007. NMDI: A normalized multi‐band drought index for monitoring soil and vegetation moisture with satellite remote sensing. Geophys Res Lett. 34(20):L20405. 2007
- Wang L, Qu JJ. 2007. NMDI: a normalized multi‐band drought index for monitoring soil and vegetation moisture with satellite remote sensing. Geophys Res Lett. 34:L20405.
- Wang A, Bohn TJ, Mahanama SP, Koster RD, Lettenmaier DP. 2009. Multimodel ensemble reconstruction of drought over the continental United States. J Climate. 22(10):2694–2712.
- Wang L, Qu JJ. 2009. Satellite remote sensing applications for surface soil moisture monitoring: a review. Front Earth Sci China. 3(2):237–247.
- Wang P, Li X, Gong J. 2001. Vegetation temperature condition index and its application for drought monitoring. IEEE 2001 International Geoscience and Remote Sensing Symposium, vol. 1, 141–143, Sydney, NSW, Australia.
- Wang W, Liang S, Meyers T. 2008. Validating MODIS land surface temperature products using long-term nighttime ground measurements. Remote Sens Environ. 112(3):623–635.
- Wan Z, Wang P, Li X. 2004. Using MODIS land surface temperature and normalized difference vegetation index products for monitoring drought in the southern Great Plains, USA. Int J Remote Sens. 25(1):61–72.
- Weghorst K. 1996. The Reclamation Drought Index: guidelines and practical applications. Denver (CO): Bureau of Reclamation.
- Wells N, Goddard S, Hayes MJ. 2004. A self-calibrating Palmer Drought Severity Index. J Climate. 17(12):2335–2351. > 2.0.CO;2.
- Wheater HS, Gober P. 2015. Water security and the science agenda. Water Resour Res. 51(7):5406–5424.
- Wilhite D. 2000. Chapter 1. Drought as a natural hazard: concepts and definitions. In: Donald A. Wilhite (Ed.), Drought Mitigation Center Faculty, a global assessment. Vol. I. London (UK): Routledge; p. 3–18.
- Wilhite DA, Glantz MH. 1985. Understanding the drought phenomenon: the role of definitions. Water Int. 10(3):111–120.
- Wilhite DA, Svoboda MD, Hayes MJ. 2007. Understanding the complex impacts of drought: a key to enhancing drought mitigation and preparedness. Water Resour Manage. 21(5):763–774.
- Willeke G, Hosking JRM, Wallis JR. 1994. The national drought atlas. In: Institute for Water Resources Report 94-NDS-4. U.S Army Corp of Engineers, CD-ROM. Norfolk, VA.
- Woods M, Woods MB. 2007. In Droughts, Learner Publications Minneapolis MN 55401 USA 23–34.
- Xianfeng L, Xiufang Z, Yaozhong P, Shuangshuang L, Yanxu L, Yuqi M. 2016. Agricultural drought monitoring: progress, challenges, and prospects. J Geog Sci. 26:750–767.
- Xing Z, Ma M, Wei Y, Zhang X, Yu Z, Yi P. 2020. A new agricultural drought index considering the irrigation water demand and water supply availability. Nat Hazards. 104(3):2409–2429.
- Yang H, Wang H, Fu G, Yan H, Zhao P, Ma M. 2017. A modified soil water deficit index (MSWDI) for agricultural drought monitoring: case study of Songnen Plain, China. Agric Water Manage. 194:125–138.
- Yang T, Ding J, Liu D, Wang X, Wang T. 2019. Combined use of multiple drought indices for global assessment of dry gets drier and wet gets wetter paradigm. J Clim. 32(3):737–748.
- Yihdego Y, Vaheddoost B, Al-Weshah RA. 2019. Drought indices and indicators revisited. Arab J Geosci. 12(3):69.
- Yirdaw SZ, Snelgrove KR, Agboma CO. 2008. GRACE satellite observations of terrestrial moisture changes for drought characterization in the Canadian Prairie. J Hydrol. 356 (1-2):84–92.
- Yoon DH, Nam WH, Lee HJ, Hong EM, Feng S, Wardlow BD, Tadesse T, Svoboda MD, Hayes MJ, Kim DE. 2020. Agricultural drought assessment in East Asia using satellite-based indices. Remote Sens. 12(3):444.
- Zarco-Tejada PJ, Rueda CA, Ustin SL. 2003. Water content estimation in vegetation with MODIS reflectance data and model inversion methods. Remote Sens Environ. 85(1):109–124.
- Zarco-Tejada PJ, Ustin SL. 2001. Modeling canopy water content for carbon estimates from MODIS data at land EOS validation sites. In Geoscience and Remote Sensing Symposium, IGARSS ’01. IEEE 2001 International, Vol. 1, p. 342–344, Sydney, NSW, Australia.
- Zarei AR, Moghimi MM, Bahrami M. 2019. Comparison of reconnaissance drought index (RDI) and effective reconnaissance drought index (eRDI) to evaluate drought severity Sustain. Sustain Water Resour Manag. 5(3):1345–1356.
- Zargar A, Sadiq R, Naser B, Khan FI. 2011. A review of drought indices. Environ Rev. 19:333–349.
- Zhang A, Jia G. 2013. Monitoring meteorological drought in semiarid regions using multi-sensor microwave remote sensing data. Remote Sens Environ. 134:12–23.
- Zhang N, Hong Y, Qin Q, Zhu L. 2013. Evaluation of the visible and shortwave infrared drought index in China. Int J Disaster Risk Sci. 4 (2):68–76.
- Zhao M, Huang S, Huang Q, Wang H, Leng G, Xie Y. 2019. Assessing socio-economic drought evolution characteristics and their possible meteorological driving force. Geomatics Nat Hazards Risk. 10(1):1, 1084–1101.
- Zhong L, Hua L, Yan Z. 2020. Datasets of meteorological drought events and risks for the developing countries in Eurasia. Big Earth Data. 4(2):191–223.