
 ?Mathematical formulae have been encoded as MathML and are displayed in this HTML version using MathJax in order to improve their display. Uncheck the box to turn MathJax off. This feature requires Javascript. Click on a formula to zoom.
Abstract
Megadroughts represent droughts with a high-intensity, long-lasting duration, and extensive spatial extent. However, as these characteristics have not been quantitatively proposed, a reasonable guideline for identifying megadroughts has not been determined. This study aims to identify the quantitative characteristics of a megadrought and suggest a guideline for detecting the occurrence of the megadrought. This study focused on the central Chile megadrought that occurred from 2010 to 2016 in central Chile. The megadrought was analyzed using the standardized precipitation index (SPI) while increasing its timescale. The 60-month timescale spatially represented that more than 60% of all stations in central Chile experienced a drought indicating moderate or more drought intensity (SPI ≤ −1) for a long duration of more than 36 months in the megadrought period. Then, guidelines were suggested based on the timescale, drought intensity, and spatial extent of drought as the criteria to detect the occurrence of the megadrought. In the criteria of moderate or more drought intensity and the spatial extent of 50% or 60%, the 60-month timescale detected the occurrence of the megadrought the earliest and most appropriately. This study will be used as a useful guideline to define and detect megadroughts that will occur in the future.
Keywords:
1. Introduction
Droughts have been recognized as major climate-related natural disasters that impact society and the economy in many regions worldwide (e.g. Mishra and Singh Citation2010; Seneviratne et al. Citation2012). Depending on its persistence and intensity, drought events can lead to a substantial decrease in surface water resources, soil moisture, and groundwater, thus causing an assortment of adverse ecological, social, and economic impacts (Wilhite Citation2000; Ogalleh et al. Citation2012; Ashraf and Routray Citation2013; Udmale et al. Citation2014). The intensity and frequency of droughts have increased over the past decades (IPCCI. Citation2014), and this trend has continued in the 21st century (Dai Citation2011; Dai Citation2013). In particular, long-lasting drought events have been frequently observed in the 21st century (Williams et al. Citation2020). A long-lasting drought event can be defined as a megadrought, which is accompanied by an extreme dry spell and drought damage over an extensive area.
Recently, megadroughts have attracted more attention because they can have more severe societal impacts than short-term droughts (Ault et al. Citation2016; Cook et al. Citation2016). Representative megadroughts have occurred in southeastern Australia from 1997 to 2009, California from 2012 to 2014, and central Chile from 2010 to 2016 (Van Dijk et al. Citation2013; Cai et al. Citation2014; Griffin and Anchukaitis Citation2014; Kogan and Guo Citation2015; Saft et al. Citation2015; Swain Citation2015; Vuille et al. Citation2015; Williams et al. Citation2015; Garreaud et al. Citation2017; Garreaud et al. Citation2020). Such megadrought events have occurred worldwide and may continue to occur in the future (Coats and Mankin Citation2016; Cook et al. Citation2016; Stevenson et al. Citation2018; Song and Park Citation2020). It has become very important to evaluate the risk of megadroughts that have occurred and those that will occur in the future. Therefore, accurately classifying what a megadrought is should be conducted (Ault et al. Citation2014; Coats and Mankin Citation2016; Ning et al. Citation2018).
However, the criteria or guidelines for defining a megadrought event are ambiguous, and the definition of a megadrought has only been mentioned conceptually. In addition, a quantitative definition for identifying a megadrought has not been proposed with rational evidence (Meehl and Hu Citation2006; Coats and Mankin Citation2016; Cook et al. Citation2016; Ning et al. Citation2018; Song and Park Citation2020). Furthermore, unclear definitions can make it difficult to identify the occurrence of a megadrought (Meehl and Hu Citation2006; Song and Park Citation2020). The megadrought events defined in various studies had three distinct drought characteristics: (1) a drought event with high intensity (Forman et al. Citation2001; CR2.2 Citation2015; Garreaud et al. Citation2017; Garreaud et al. Citation2020; Muñoz et al. Citation2020); (2), its unusually large spatial extent (Cook et al. Citation2016; Aldunce et al. Citation2017; Garreaud et al. Citation2017); and (3) the length of its duration (Ault et al. Citation2014; Boisier et al. Citation2016; Cook et al. Citation2016; Stevenson et al. Citation2018; Ning et al. Citation2018; Garreaud et al. Citation2020; Song and Park Citation2020). Even though some studies have stated that megadrought events have these characteristics, it is not quantitatively presented how high the drought intensity must be, how long the drought must last, and how widespread it must be to be identified as a megadrought.
This study aims to identify the quantitative intensity, persistence, and spatial extent of a megadrought to provide a reliable, quantitative definition for megadrought events and propose a guideline for identifying megadroughts using these characteristics. This study was conducted for drought events identified in central Chile from 1980 to 2016 and the megadrought event that occurred recently in central Chile, which is the global representative for a megadrought case (Garreaud et al. Citation2020, Citation2017). The central Chile megadrought recorded an unprecedented duration of drought from 2010 to 2016. To identify the quantitative characteristics of a megadrought, this study calculated the standardized precipitation index (SPI) by using only the rainfall data obtained from ground-based weather stations. Rainfall is the most important variable for evaluating drought (Saft et al. Citation2015), and the megadrought definition is based on rainfall deficits in some studies (Meehl and Hu Citation2006). In addition, rainfall data over a long period can be collected relatively easily compared to other meteorological variables in any region. Accordingly, this study defines the intensity, persistence, and spatial extent of a megadrought in terms of the drought related to the rainfall deficit.
2. Materials and methods
2.1. Study area
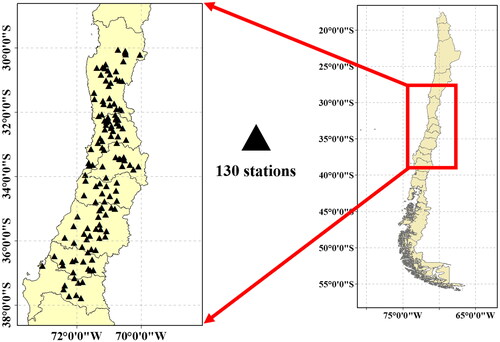
Central Chile (30–38°S), in western South America, features a narrow strip of lowlands bordered to the east by the Andes Mountain Range, which reaches more than 4000 m a.s.l., has an archetypical Mediterranean climate with an annual mean rainfall ranging between 100 and 1000 mm, and a marked seasonal cycle. This region has over 10 million inhabitants (nearly two-thirds of the Chilean population), major cities (including Santiago, the Chilean capital), and key economic activities (e.g. mining, agriculture, timber production, and hydropower generation).
An extreme drought event occurred from 2010 to 2016 in central Chile, referred to as the central Chile megadrought. According to the historical records, this was unprecedented and unusual over the last millennium. The megadrought resulted in a diminished Andean snowpack, river discharge, reservoir volumes, groundwater levels, and difficulty for life systems for people across central Chile (Aldunce et al. Citation2017; Masotti et al. Citation2018; Muñoz et al. Citation2020). This megadrought also extended to westernmost Argentina. Furthermore, this megadrought led to a substantial increase (60%) in burned areas due to forest fires (González et al. Citation2018). The observed decline in rainfall over central Chile has been greatly accentuated by an uninterrupted sequence of dry years from 2010 to 2016, with annual rainfall deficits ranging between 25% and 45%. Since the early 1980s, a rainfall decline has been evident along the coast (Quintana and Aceituno Citation2012) and the Andes Mountain Range (Masiokas et al. Citation2016), accentuated by an uninterrupted rainfall deficit from 2010 to 2016.
2.2. Dataset
Ground-based observations were used to characterize the central Chile megadrought. At the regional scale, the Chilean Directorate of Water Resources (DGA) and the National Weather Service (DMC) maintain more than 500 rain gauges throughout central Chile. Although all stations have different observation periods, this study was conducted by collecting only the rainfall data observed during the same data period at all stations. This was to analyze the intensity of drought by calculating the SPI under the same analysis condition from the number of samples of the same rainfall data.
Accordingly, this study firstly selected observation stations containing missing values and outliers less than 3% of total rainfall data for the data period from 1980 to 2016. Then, the selected stations were tested for homogeneity of rainfall data by using Pettitt’s test, which is widely applied to test the homogeneity of timeseries data. This study finally targeted 130 stations located in central Chile that passed this test to conduct the further study as shown in . Among 130 stations, 122 stations are managed by the DGA, and 8 stations are managed by the DMC. All station data are available from the Center for Climate and Resilience Research Climate Explorer (http://explorador.cr2.cl).
Figure 1. The geographic location of central Chile, and ground-based stations located in central Chile. Black points indicate 130 stations containing missing and outlier values of less than 3% during the data period from 1980 to 2016.
2.3. Methodology
2.3.1. Standardized precipitation index (SPI)
The SPI was developed by McKee et al. (Citation1993). It is one of the indexes that can express the amount of cumulative rainfall for a specified period and is recommended by the World Meteorological Organization (WMO) for use worldwide (Liu et al. Citation2021). SPI uses monthly rainfall aggregates at various time scales (1, 3, 6, 12, and 48 months) that reflect the impact of drought on the availability of different water resources. The SPI can describe drought conditions only by using rainfall at various time scales, from a short time scale to a long-term time scale (Szalai and Szinell Citation2000; Mishra and Desai Citation2005). Furthermore, SPI can analyze the scale of drought persistence by increasing the timescale, and this makes it easier to identify megadroughts (Pei et al. Citation2020).
The rainfall series was fitted to a gamma (Γ) distribution at a certain time scale in the total data period and then transformed to a normal distribution. The SPI values can be interpreted as the number of standard deviations by which the observed anomaly deviates from the long-term mean. As an illustration of the procedure, for a 12-month time scale, the rainfall accumulation from month j-11 to month j is summed and attributed to month j. At this time scale, the first 11 months of the data time series were missing. This process is repeated until the total data period is reached. Next, the normalization procedure is followed, wherein the gamma probability density function is first fitted to the long-term time series of aggregated rainfall. Then, the fitted function is used to calculate the cumulative distribution of the data points, which are finally transformed into standardized normal variates.
As shown in EquationEquation 1(1)
(1) , the Γ distribution of the probability density function is given by
(1)
(1)
where α is a parameter concerning shape, β is a parameter concerning scale, x is the amount of rainfall in a certain period, and the gamma (Γ) function is presented as:
(2)
(2)
where the best values of α and β are estimated by the maximum likelihood method.
(3)
(3)
n is the number of x values with a certain timescale in the total data period. By substituting the aggregated rainfall for x, we can estimate a pair of Γ distribution parameters and the cumulative density function (CDF) in Equationequations (1)–(3). The CDF was transformed into a standardized normal distribution to calculate SPI values. Classifications of dryness and wetness events based on SPI have been proposed in .
Table 1. SPI classification.
This study calculated SPI values for long-term time scales at 130 stations located in central Chile according to the SPI calculation procedure shown above. With increasing time scales, we analyzed the characteristics of megadrought based on the calculated SPI values.
2.3.2. Run theory
The run theory proposed by Yevjevich (Citation1967) can be considered one of the most effective methods in the analysis of time series. The run theory refers to the occurrence of similar events, such as droughts, and allows characterizing each event by assessing some characteristics such as duration, severity, and intensity. This study uses the run theory to identify drought events that are characterized by drought duration, severity, and intensity. An example of the run theory for a specified threshold level is shown in .
Figure 2. Example of the drought characteristics evaluated using run theory for a given threshold level of SPI. It represents three drought events at a threshold of −1.
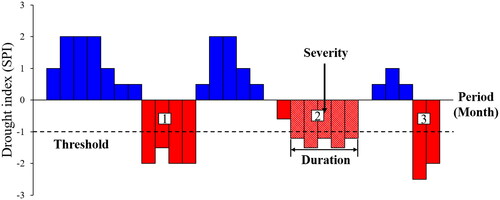
The portions of the drought timeseries in which the values are all above or below the threshold are defined as ‘run’ and are considered as positive or negative run, respectively (Mishra and Singh Citation2010). Once the runs, and thus the drought events, have been identified it is possible to evaluate the different drought characteristics. In , a drought event is defined as the SPI value is lower than a specified threshold (−1.0) in the aggregation period.
In the run theory, the drought duration is the period in which SPI values are constantly below the threshold and can be expressed in weeks, months, years, or any other period. As shown in , ‘event 2’ shows a drought event with the longest drought duration. The cumulated SPI values during each event represent the drought severity. As shown in , ‘event 1’ shows a drought event with the highest severity. The drought intensity is evaluated, for each event, as the ratio between the drought severity and the drought duration. As shown in , ‘event 3’ shows a drought event with the highest intensity.
This methodology has been largely applied to detect and define drought events in past studies (Huang et al. Citation2014; Liu et al. Citation2015; Wu et al. Citation2019; da Rocha Júnior et al. Citation2020; Achite et al. Citation2021; Caloiero et al. Citation2021). In this study, based on the run theory, drought events that occurred from 1980 to 2016 in central Chile were detected. In addition, the characteristics of the central Chile megadrought related to the drought duration, severity, and intensity were identified.
3. Result
3.1. Identification of droughts in Central Chile
In this section, SPI values were calculated for central Chile, and drought events that occurred in central Chile from 1980 to 2016 were identified using the calculated SPI values. shows the average SPI values for 130 stations located over central Chile according to each timescale (12-, 36-, 48-, and 60-month timescales). In , the negative SPI value indicates a relative drought condition and is represented by red bars; the positive SPI value indicates a relatively wet condition and is represented by blue bars.
Figure 3. Average SPI values calculated using each timescale from 1980 to 2016 for 130 stations located over central Chile.
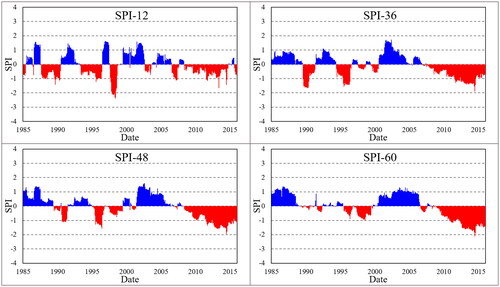
On the 12-month timescale of , the lowest SPI was calculated between 1998 and 1999, indicating that the most intense drought occurred between 1998 and 1999. Garreaud et al. (Citation2017) also identified 1998 as the driest year since 1980, and this drought had a relatively short-lasting duration close to one year. On the other hand, the 36-, 48-, and 60-month timescales rather than the 12-month timescale, showed a relatively high SPI of −1 or more between 1998 and 1999. This result means that the drought between 1998 and 1999 exhibited a higher intensity when using SPIs of the 12-month timescale than the 36-, 48-, and 60-month timescales.
On the 36-, 48-, and 60-month timescales, the minimum SPI value was calculated in 2015, which means that the highest intense drought occurred in 2015. From 2010 to 2016, the SPI gradually increased in the negative direction, or it shows a pattern that was kept constant close to −1. This pattern indicates that the drought with high intensity persisted in central Chile during the period from 2010 to 2016. Meanwhile, during this period, SPI values of the 12-month timescale did not show this pattern. Although SPI values of −1 or less were occasionally exhibited during this period, the total period showing SPI values below −1 was very short as shown in . This result means that it is difficult to accurately identify the intensity and persistence of megadroughts using the 12-month timescale.
In , this study detected drought years with high intensity from 1980 to 2016 based on the run theory mentioned in Section 2. This study regarded that a drought occurred in a year with the SPI value of less than −1, which means the moderate or more intense drought and detected drought years representing SPI values less than this threshold. The second column of shows the years in which droughts were detected. On the smallest 12-month timescale, the number of detected droughts was the most, and all but three of them were before 2010. On the 60-month timescale, the number of detected droughts was the least, and all of the detected years except 1999 were contained in the central Chile megadrought period. This result indicates that the 60-month timescale detected a megadrought most accurately compared to other timescales.
Table 2. The years in which drought were detected, the maximum lasting duration of the drought in which the SPI of -1 or less is shown constantly during the central Chile megadrought period, and the lowest SPI calculated during this megadrought period for applying each timescale of SPI.
The third column of shows the maximum lasting duration of the drought in which the SPI of −1 or less is shown constantly during the central Chile megadrought period, based on the run theory. The fourth column of shows the lowest SPI during this period, and this means the highest intensity of drought during the megadrought period. As a result, the shorter the timescale of the SPI, this timescale shortly identified the lasting duration of the drought. On the 12-month timescale, the maximum lasting duration of the drought was 3 months, but on the 60-month timescale, it was 45 months, which identified the longest-lasting duration. The lowest SPI was calculated on the 60-month timescale during this megadrought period, and it was the only SPI of −2 or lower indicating extreme drought as shown in . These results imply that an appropriate timescale should be applied to identify the accurate persistence and intensity of the megadrought, and the 12-month timescale may identify and define the megadrought inappropriately. The 60-month timescale indicates that the central Chile megadrought has a high intensity of more than extreme drought (SPI ≤ −2) and drought-lasting duration close to 4 years.
3.2. Severity of the central Chile megadrought
This section spatially analyzed the severity of the central Chile megadrought. By representing the persistence of the megadrought for each of 130 stations located over central Chile, this study identified how severely a megadrought occurred all over central Chile. This analysis was conducted based on the run theory mentioned in Section 2.
This study analyzed the lasting duration of the central Chile megadrought for each station of 130 stations. The maximum period in which SPI values are constantly below −1, indicating the moderate or intense drought between 2010 and 2016, was represented as the lasting duration of the central Chile megadrought. spatially visualizes this period for each station and each timescale (12-, 36-, 48-, 60-, and 72-month timescales), and this period means the maximum duration persisting a relatively high intensity of drought. As shown in , results of the 12-month timescale indicated that most of the stations show a relatively short-lasting duration of the drought. On the other hand, the larger the timescale, the longer the lasting duration of the drought in most stations.
Figure 4. For each timescale of SPI, the maximum period in which SPI values are constantly below −1, indicating the moderate or intense drought, between 2010 and 2016 (12-, 36-, 48-, 60-, and 72-month timescales).
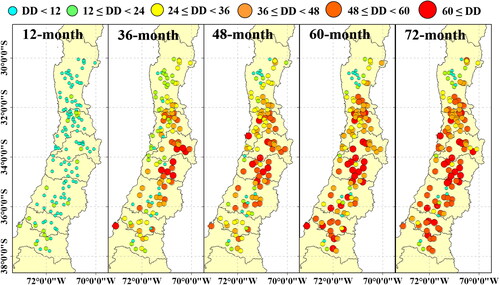
These results in were shown in . shows the counting of the number of stations where the lasting duration of more than 24, 36, 48, 60, and 72 months were identified at each timescale (12-, 36-, 48-, 60-, and 72-month timescales) during the megadrought period. On the 12-month timescale, more than 95% of all stations experienced a drought lasting less than 20 months. On 60-month and 72-month timescales, more than 60% of all stations experienced a drought lasting more than 36 months, and more than 40% experienced a drought lasting more than 48 months. In addition, more than 20% of all stations experienced a drought lasting more than 60 months. The 60- and 72-month timescales indicate that the drought with high intensity persisted for a long time all over central Chile in the megadrought period. This result suggests that it is difficult to accurately identify the drought duration of a long-lasting drought event such as the megadrought with a relatively short timescale such as 12-month. For the megadrought, the drought duration persisting a high intensity can be properly identified from a relatively long timescale.
Table 3. The counting results of the number of stations where the lasting duration of more than 24, 36, 48, 60, and 72 months were identified at each timescale during the megadrought period.
Even in the megadrought case in southeastern Australia, which is located at a latitude similar to that of central Chile, a relatively long timescale for rainfall-related indicators was useful in understanding the severity of extreme drought. Saft et al. (Citation2015) proposed that southeastern Australia showed an increasing pattern of rainfall shortage accumulated for the three years during the megadrought period in southeastern Australia. Van Dijk et al. (Citation2013) showed that the five-year average rainfall recorded the lowest historically during the megadrought period in southeastern Australia.
4. Suggesting the guidelines for identifying megadrought
In the previous section, this study could spatially analyze how severely the central Chile megadrought occurred all over central Chile. In particular, using SPI values of relatively large timescales was possible to reasonably represent the persistence of the megadrought for each station of 130 stations. These SPI values may be useful to identify the occurrence of a megadrought in a specific area. Accordingly, this study applied the SPI values calculated for each timescale to identify the occurrence of the megadrought. This section analyzed how extensively the central Chile megadrought occurred by counting the stations that identified the drought with high intensity at the same time. Then, based on this counting result, this study suggested more reasonable guidelines to detect the occurrence of a megadrought.
This study counted the number of stations where droughts with high intensity occurred by each month, based on the monthly SPI values calculated for each station from 1980 to 2016. The SPI of −2 or less (extreme drought; ), the SPI of −1.5 or less (severe and extreme droughts; ), and the SPI of −1 or less (moderate, severe, and extreme droughts; ) were applied as the criterion to judge that the station represented a high intensity drought. According to this criterion, if the calculated SPI at a station and a specified time was less than −2, −1.5, or −1, that station represented a high intensity drought at that time.
shows the result that counted stations where a high intensity drought occurred at 130 stations for each timescale (12-, 36-, 48-, 60-, and 72-month timescales). In , the red bars represent results that count the number of stations with the SPI of −2 or less, and the blue bars represent results for the number of stations with the SPI of −1.5 or less. In addition, the green bars represent results that count the number of stations with the SPI of −1 or less. The dashed line indicates the number of stations corresponding to 50% of all stations.
Figure 5. The number of stations that experienced high intensity drought among 130 stations from 1980 to 2016 for each timescale of SPI. The red bars represented extreme or more intensity of drought. The blue bars represent severe or more intensity of drought. The green bars represented moderate or more intensity of drought. (a): 12-month timescale, (b): 36-month timescale, (c): 48-month timescale, (d): 60-month timescale, (e): 72-month timescale.
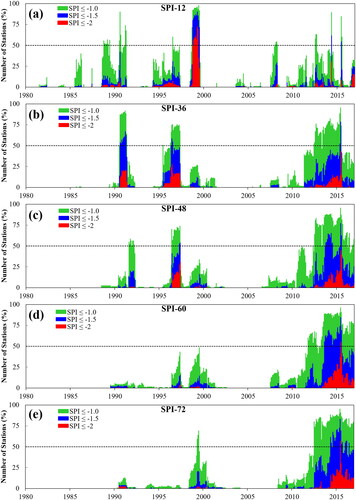
In the graph of the 12-month timescale, more than 70% of the total stations represented extreme drought (SPI ≤ −2) at the same time, and more than 85% of the total stations represented severe or more intense drought (SPI ≤ −1.5), between 1998 to 1999, before the occurrence of the central Chile megadrought. For the central Chile megadrought period (2010 to 2016), more than 50% of the total stations represented severe or more intense drought, but the number of stations representing the extreme drought was lower than 30% of the total stations. These results indicate that more stations were experienced a high intensity drought in the period between 1998 and 1999 rather than the megadrought period when the 12-month timescale is applied.
To judge the widespread occurrence of the drought, this study assumed that if the number of drought-represented stations at the same time is more than 50% of all stations, a drought occurred extensively in a targeted area. Through this assumption, the SPI value of the 12-month timescale indicates that the extreme or more intense drought occurred extensively in 1998. However, it does not indicate that the extreme or more intense drought occurred extensively during the central Chile megadrought period. This result means that the SPI value of the 12-month timescale is difficult to accurately determine the spatial extent of the megadrought.
In the graphs of the 36- and 48-month timescales, more stations represented moderate, severe, and extreme or more intense drought for the megadrought period than before the occurrence of the megadrought. However, less than 50% of all stations represented extreme or more intense drought during the megadrought period. The SPI values of 36- and 48-month timescales do not still indicate that the extreme or more intense drought occurred extensively during the central Chile megadrought period.
On the other hand, in the graph of the 60-month timescale, SPI values of 60-month timescale indicate that the extreme or more intense drought occurred extensively during the central Chile megadrought period. Before this period, the number of stations that represented extreme or more intense drought was lower than 50% of all stations, and those stations were lower than 10% of all stations. In addition, the number of stations that represented a severe and moderate or more intense drought was lower than 50% of all stations before this period, but the number of those stations was more than 50% at the same time during the megadrought period.
In the graph of the 72-month timescale, for only the central Chile megadrought period, the extreme or more intense drought occurred extensively. However, the number of stations that represented a moderate or more intense drought was more than 50% of all stations, and the number of those stations increased in the 72-month timescale compared to the 60-month timescale. This is because it is judged that the drought has occurred as the drought conditions before or after a specific drought event period are included due to the fairly long timescale. This suggests that timescales larger than 60-months may misidentify the occurrence of megadroughts.
Garreaud et al. (Citation2017) analyzed the spatial extent of the central Chile megadrought and other drought events before the megadrought based on the SPI values calculated from each station located in central Chile. They used only the SPI value of the 12-month timescale, and it was judged that the station with the SPI of −1 or less experienced drought. They recognized that drought events that occurred in 1990 and 1998 persisted for a short period, were the same or more widespread than the central Chile megadrought. In their study, the 12-month timescale of the SPI indicated that droughts lasting for a relatively short period of time are more widespread than megadroughts, as with the result in this study. Therefore, to identify properly the spatial extent of a megadrought, a relatively long timescale of SPI should be used.
Based on and the previous results, this study suggests guidelines for defining and detecting the occurrence of a megadrought. Guidelines were suggested based on the SPI timescale, drought intensity (SPI value), and spatial extent of drought, and those were defined as the criteria to judge the occurrence of a megadrought. This study analyzed whether a specific drought could be appropriately recognized and detected as a megadrought by applying various thresholds for these three criteria. From a policy point of view, it is important to recognize the occurrence of a megadrought early to counter the severe damage caused by it. The guideline was decided by focusing on which criteria earlier detected the occurrence of the megadrought. Accordingly, this study assumed that a specific drought is identified as a megadrought if that drought satisfies the suggested criteria. Then, the time of occurrence of the megadrought was assumed to be January 2010, and how much time passed from January 2010 to the time of identification of a megadrought was analyzed for each different criterion.
were created based on . These tables show the period to the time point for when this threshold is firstly exceeded when the spatial extent criteria for the occurrence of megadroughts are set to 40%, 50%, and 60% of all stations, respectively. Further, this period of each table is shown for each SPI timescale (12-, 36-, 48-, 60-, 72-month) and SPI value (moderate, severe, and extreme or more intense drought) as a criterion. The triangle mark indicates that these criteria were already satisfied before 2010, meaning that it already experienced a drought satisfying this criterion before the central Chile megadrought. In , the criteria that recognize the occurrence of a megadrought before 2010 cannot be presented as guidelines because they can inappropriately detect the occurrence of megadroughts. As shown in , the 12-month timescale cannot be applied in the guideline because it identified that the megadrought occurred before 2010 for all spatial extent and drought intensity criteria.
Table 4. The period to the time point for when the threshold is firstly exceeded when the spatial extent criteria for the occurrence of megadroughts are set to 40% of all stations by applying each criterion of SPI.
Table 5. The period to the time point for when the threshold is firstly exceeded when the spatial extent criteria for the occurrence of megadroughts are set to 50% of all stations by applying each criterion of SPI.
Table 6. The period to the time point for when the threshold is firstly exceeded when the spatial extent criteria for the occurrence of megadroughts are set to 60% of all stations by applying each criterion of SPI.
As shown in , in the criteria of extreme or more drought intensity and the spatial extent of 40%, all timescales except 12-month detected the occurrence of megadrought only during the megadrought period. However, it takes 66 months to detect the occurrence of a megadrought when this criterion is applied as a guideline. Thus, it has a limitation in that it is recognized as a megadrought only after it has already suffered serious damage from the megadrought. On the other hand, in the criteria of severe or more drought intensity and the spatial extent of 40%, the 60- and 72-month timescales could detect earlier that the megadrought occurred only during the megadrought period. The 60- and 72-month timescales identified the occurrence of the megadrought after 44 and 53 months, respectively, and the 60-month timescale detected the occurrence of the megadrought earlier.
In , only the 60- and 72-month timescales detected the occurrence of megadrought only during the megadrought period. In particular, the 60-month timescale appropriately detected the occurrence of megadrought in all drought intensity criteria. In the criterion of moderate or more drought intensity, this timescale was the earliest to detect the occurrence of the megadrought in 22 months. Meanwhile, in criteria of severe and extreme or more drought intensity, the period identifying the occurrence of megadrought was the same as in . The higher the drought intensity criterion, the later the megadrought was detected.
As shown in , in the criteria of severe or more drought intensity and the spatial extent of 60%, 48-, 60-, and 72-month timescales detected the occurrence of megadrought only during the megadrought period. The 60-month timescale was the earliest to recognize the occurrence of a megadrought in 45 months. In the moderate or more drought intensity criterion, only the 60-month timescale adequately detected the occurrence of the megadrought, and the period to detection was 22 months as with the result for the criterion of the spatial extent of 50%.
Consequently, the 60-month timescale was able to detect the occurrence of the megadrought the earliest and most appropriately in all criteria. In particular, in the criteria of moderate or more drought intensity and the spatial extent of 50% or 60%, the 60-month timescale could detect the occurrence of the megadrought the earliest. Furthermore, it is noteworthy that the 60-month timescale rather than 12-, 36-, and 48-month timescales could identify the occurrence of the megadrought with an earlier or similar period, even though it is a larger timescale than 12-, 36-, and 48-month. For example, the 60-month timescale identified the occurrence of the megadrought more than 8 months earlier than the 12-, 36-, and 48-month timescales for all intensity criteria at the spatial extent of 50%. This means that even large timescales can identify the occurrence of megadroughts early. Hence, if a guideline for detecting the occurrence of megadrought based on a spatial extent of 50% or 60% and moderate or more drought intensity using the 60-month timescale SPI is presented, it may be possible to the earliest and the most appropriately detect the occurrence of a megadrought in a specific area.
5. Conclusions
To define the persistence, intensity, and spatial extent of a megadrought, this study selected central Chile that occurred a representative megadrought event from 2010 to 2016 as a target area. This study was based on the SPI value calculated for each timescale using the rainfall.
From the average SPI values for 130 stations located over central Chile, this study detected drought years with high intensity from 1980 to 2016 based on the run theory for each timescale of SPI. The 60-month timescale detected a megadrought most accurately compared to other timescales. The 60-month timescale represented the longest drought-lasting duration and highest drought intensity for the megadrought period in central Chile.
Then, the severity of the central Chile megadrought was spatially analyzed by representing the persistence of the megadrought for each of the stations. On the 60- and 72-month timescales, most stations represented the longest-lasting duration of drought during the megadrought period. More than 60% of all stations experienced a drought lasting more than 36 months, and more than 40% experienced a drought lasting more than 48 months. On the other hand, on the 12-month timescale, more than 95% of all stations experienced a drought lasting less than 20 months. These results imply that an appropriate timescale should be applied to identify the accurate severity related to the persistence of the megadrought, and the 12-month timescale may identify and define the megadrought inappropriately. As a result, this study could spatially analyze how severely and persistently the central Chile megadrought occurred all over central Chile.
Accordingly, this study applied the SPI values calculated for each timescale to identify the occurrence of the megadrought and suggested guidelines to detect the occurrence of a megadrought. In this guideline, the SPI timescale, drought intensity, and spatial extent of drought were defined as the criteria to judge the occurrence of a megadrought. By trying to apply the different criteria, this study found out the criteria for the earliest and most appropriately detecting the occurrence of megadroughts. In the criteria of moderate or more drought intensity and the spatial extent of 50% or 60%, the 60-month timescale detected the occurrence of the megadrought the earliest. Hence, if a guideline for identifying the occurrence of megadrought based on a spatial extent of 50% or 60% and moderate or more drought intensity using the 60-month timescale SPI is presented, it will be possible to the earliest and the most appropriately detect the occurrence of a megadrought in a specific area.
These results may be used as a criterion and guideline for judging whether a drought can be defined as a megadrought event. In addition, this study may be used as a useful criterion to evaluate recent long-term droughts and megadroughts that will occur in the future. However, further improvements to the suggested guideline are still needed. Since this study suggested the guideline for identifying a megadrought based on the central Chile case, it is necessary to apply this procedure in other areas that have experienced large-scale drought events that occurred in California and southeastern Australia. In addition, the severe drought is caused by the combined effects of various factors such as heatwaves, infiltration, and groundwater recharge as well as the rainfall deficit. These factors have a direct impact on the damage to water resources, vegetation health, and agricultural crop yield. However, as this guideline is based on the SPI value calculated using rainfall, it might be difficult to consider the drought impacts on water resources, vegetation health, and agricultural crop yield. Thus, there is a limitation that the megadrought identified by this guideline may be classified as a meteorological drought.
Data availability statement
The precipitation data in all stations are available from the Center for Climate and Resilience Research Climate Explorer (http://explorador.cr2.cl). The data that support the findings of this study are available from the first author, Youngkyu Kim, upon reasonable request.
Disclosure statement
No potential conflict of interest was reported by the authors.
Correction Statement
This article has been republished with minor changes. These changes do not impact the academic content of the article.
Additional information
Funding
References
- Achite M, Krakauer NY, Wałęga A, Caloiero T. 2021. Spatial and temporal analysis of dry and wet spells in the Wadi Cheliff Basin, Algeria. Atmosphere (Basel). 12(6):798.
- Aldunce P, Araya D, Sapiain R, Ramos I, Lillo G, Urquiza A, Garreaud R. 2017. Local perception of drought impacts in a changing climate: the mega-drought in central Chile. Sustainability. 9(11):2053.
- Ashraf M, Routray JK. 2013. Perception and understanding of drought and coping strategies of farming households in north-west Balochistan. Int J Disaster Risk Reduct. 5:49–60.
- Ault TR, Cole JE, Overpeck JT, Pederson GT, Meko DM. 2014. Assessing the risk of persistent drought using climate model simulations and paleoclimate data. J Clim. 27(20):7529–7549.
- Ault TR, Mankin JS, Cook BI, Smerdon JE. 2016. Relative impacts of mitigation, temperature, and precipitation on 21st-century megadrought risk in the American Southwest. Sci Adv. 2(10):e1600873.
- Boisier JP, Rondanelli R, Garreaud RD, Muñoz F. 2016. Anthropogenic and natural contributions to the Southeast Pacific precipitation decline and recent megadrought in central Chile. Geophys Res Lett. 43(1):413–421.
- Cai W, Purich A, Cowan T, van Rensch P, Weller E. 2014. Did climate change–induced rainfall trends contribute to the Australian Millennium drought? J Clim. 27(9):3145–3168.
- Caloiero T, Caroletti GN, Coscarelli R. 2021. IMERG-Based Meteorological Drought Analysis over Italy. Climate. 9(4):65.
- Coats S, Mankin JS. 2016. The challenge of accurately quantifying future megadrought risk in the American Southwest. Geophys Res Lett. 43(17):9225–9233.
- Cook BI, Cook ER, Smerdon JE, Seager R, Williams AP, Coats S, Stahle DW, Díaz JV. 2016. North American megadroughts in the common era: reconstructions and simulations. WIREs Clim Change. 7(3):411–432.
- CR2. 2015. Report to the Nation. The 2010–2015 mega-drought: A lesson for the future. Inf a la Nación [Internet].(November):28. www.cr2.cl/megasequia.
- da Rocha Júnior RL, dos Santos Silva FD, Costa RL, Gomes HB, Pinto DDC, Herdies DL. 2020. Bivariate assessment of drought return periods and frequency in brazilian northeast using joint distribution by copula method. Geosciences. 10(4):135.
- Dai A. 2011. Drought under global warming: a review. WIREs Clim Change. 2(1):45–65.
- Dai A. 2013. Increasing drought under global warming in observations and models. Nat Clim Change. 3(1):52–58.
- Forman SL, Oglesby R, Webb RS. 2001. Temporal and spatial patterns of Holocene dune activity on the Great Plains of North America: megadroughts and climate links. Glob Planet Change. 29(1-2):1–29.
- Garreaud RD, Alvarez-Garreton C, Barichivich J, Boisier JP, Christie D, Galleguillos M, LeQuesne C, McPhee J, Zambrano-Bigiarini M. 2017. The 2010–2015 megadrought in central Chile: impacts on regional hydroclimate and vegetation. Hydrol Earth Syst Sci. 21(12):6307–6327.
- Garreaud RD, Boisier JP, Rondanelli R, Montecinos A, Sepúlveda HH, Veloso‐Aguila D. 2020. The central Chile mega drought (2010–2018): a climate dynamics perspective. Int J Climatol. 40(1):421–439.
- González ME, Gómez‐González S, Lara A, Garreaud R, Díaz‐Hormazábal I. 2018. The 2010–2015 megadrought and its influence on the fire regime in central and south‐central Chile. Ecosphere. 9(8):e02300.
- Griffin D, Anchukaitis KJ. 2014. How unusual is the 2012–2014 California drought? Geophys Res Lett. 41(24):9017–9023.
- Huang S, Chang J, Huang Q, Chen Y. 2014. Spatio-temporal changes and frequency analysis of drought in the Wei River Basin, China. Water Resour Manage. 28(10):3095–3110.
- IPCCI. 2014. Climate change 2013: the physical science basis: Working Group contribution to the Fifth assessment report of the Intergovernmental Panel on Climate Change. [place unknown]: Cambridge university press.
- Kogan F, Guo W. 2015. 2006–2015 mega-drought in the western USA and its monitoring from space data. Geomatics, Nat Hazards Risk. 6(8):651–668.
- Liu X, Wang S, Zhou Y, Wang F, Li W, Liu W. 2015. Regionalization and spatiotemporal variation of drought in China based on standardized precipitation evapotranspiration index (1961–2013). Adv Meteorol. 2015:1–18.
- Liu C, Yang C, Yang Q, Wang J. 2021. Spatiotemporal drought analysis by the standardized precipitation index (SPI) and standardized precipitation evapotranspiration index (SPEI) in Sichuan Province, China. Sci Rep. 11(1):1–14.
- Masiokas M, Christie D, Le Quesne C, Pitte P, Ruiz L, Villalba R, Luckman B, Berthier E, Nussbaumer S, González-Reyes Á, et al. 2016. Reconstructing the annual mass balance of the Echaurren Norte glacier (Central Andes, 33.5 S) using local and regional hydroclimatic data. Cryosph. 10(2):927–940.
- Masotti I, Aparicio-Rizzo P, Yevenes MA, Garreaud R, Belmar L, Farías L. 2018. The influence of river discharge on nutrient export and phytoplankton biomass off the central Chile Coast (33–37 S): seasonal cycle and interannual variability. Front Mar Sci. 5:423.
- McKee TB, Doesken NJ, Kleist J. 1993. The relationship of drought frequency and duration to time scales. In: Proc 8th Conf Appl Climatol. Vol. 17. [place unknown]: Boston; p. 179–183.
- Meehl GA, Hu A. 2006. Megadroughts in the Indian monsoon region and southwest North America and a mechanism for associated multidecadal Pacific sea surface temperature anomalies. J Clim. 19(9):1605–1623.
- Mishra AK, Desai VR. 2005. Drought forecasting using stochastic models. Stoch Environ Res Ris Assess. 19(5):326–339.
- Mishra AK, Singh VP. 2010. A review of drought concepts. J Hydrol. 391(1–2):202–216.
- Muñoz A, Klock-Barría K, Alvarez-Garreton C, Aguilera-Betti I, González-Reyes Á, Lastra J, Chávez R, Barría P, Christie D, Rojas-Badilla M, et al. 2020. Water crisis in Petorca Basin, Chile: The combined effects of a mega-drought and water management. Water. 12(3):648.
- Ning L, Liu J, Wang B, Chen K, Yan M, Jin C, Wang Q. 2018. Variability and mechanisms of megadroughts over eastern China during the last millennium: a model study. Atmosphere (Basel). 10(1):7.
- Ogalleh SA, Vogl CR, Eitzinger J, Hauser M. 2012. Local perceptions and responses to climate change and variability: the case of Laikipia District, Kenya. Sustainability. 4(12):3302–3325.
- Pei Z, Fang S, Wang L, Yang W. 2020. Comparative analysis of drought indicated by the SPI and SPEI at various timescales in Inner Mongolia, China. Water. 12(7):1925.
- Quintana JM, Aceituno P. 2012. Changes in the rainfall regime along the extratropical west coast of South America (Chile): 30–43° S. Atmósfera. 25(1):1–22.
- Saft M, Western AW, Zhang L, Peel MC, Potter NJ. 2015. The influence of multiyear drought on the annual rainfall‐runoff relationship: an A ustralian perspective. Water Resour Res. 51(4):2444–2463.
- Seneviratne S, Nicholls N, Easterling D, Goodess C, Kanae S, Kossin J, Luo Y, Marengo J, McInnes K, Rahimi M. 2012. Changes in climate extremes and their impacts on the natural physical environment.
- Song Y, Park M. 2020. Assessment of quantitative standards for mega-drought using data on drought damages. Sustainability. 12(9):3598.
- Stevenson S, Overpeck JT, Fasullo J, Coats S, Parsons L, Otto-Bliesner B, Ault T, Loope G, Cole J. 2018. Climate variability, volcanic forcing, and last millennium hydroclimate extremes. J Clim. 31(11):4309–4327.
- Swain DL. 2015. A tale of two California droughts: lessons amidst record warmth and dryness in a region of complex physical and human geography. Geophys Res Lett. 42(22):9999–9999.
- Szalai S, Szinell CS. 2000. Comparison of two drought indices for drought monitoring in Hungary—a case study. In: Drought drought Mitig Eur. Kluwer, Dordrecht: Springer; p. 161–166.
- Udmale P, Ichikawa Y, Manandhar S, Ishidaira H, Kiem AS. 2014. Farmers׳ perception of drought impacts, local adaptation and administrative mitigation measures in Maharashtra State, India. Int J Disaster Risk Reduct. 10:250–269.
- Van Dijk AIJM, Beck HE, Crosbie RS, de Jeu RAM, Liu YY, Podger GM, Timbal B, Viney NR. 2013. The Millennium Drought in southeast Australia (2001–2009): natural and human causes and implications for water resources, ecosystems, economy, and society. Water Resour Res. 49(2):1040–1057.
- Vuille M, Franquist E, Garreaud R, Lavado Casimiro WS, Cáceres B. 2015. Impact of the global warming hiatus on Andean temperature. J Geophys Res Atmos. 120(9):3745–3757.
- Wilhite DA. 2000. Drought as a natural hazard: concepts and definitions. London: Routledge.
- Williams AP, Cook ER, Smerdon JE, Cook BI, Abatzoglou JT, Bolles K, Baek SH, Badger AM, Livneh B. 2020. Large contribution from anthropogenic warming to an emerging North American megadrought. Science. 368(6488):314–318.
- Williams AP, Seager R, Abatzoglou JT, Cook BI, Smerdon JE, Cook ER. 2015. Contribution of anthropogenic warming to California drought during 2012–2014. Geophys Res Lett. 42(16):6819–6828.
- Wu R, Zhang J, Bao Y, Guo E. 2019. Run theory and Copula-based drought risk analysis for Songnen grassland in northeastern China. Sustainability. 11(21):6032.
- Yevjevich VM. 1967. Objective approach to definitions and investigations of continental hydrologic droughts, An.