
 ?Mathematical formulae have been encoded as MathML and are displayed in this HTML version using MathJax in order to improve their display. Uncheck the box to turn MathJax off. This feature requires Javascript. Click on a formula to zoom.
Abstract
This study utilised multi-temporal satellite data to characterize droughts across the five Agro-ecological zones (AEZ) of Zimbabwe at monthly, seasonal, sub-seasonal and annual scales (2000 to 2018) using a combination of Satellite Pour l'Observation de la Terre (SPOT) Vegetation (VGT) and Project for On-Board Autonomy-Vegetation (PROBA-V) derived Vegetation Condition Index (VCI). The characterized droughts were validated, using maize yield and meteorological station derived Standardised Precipitation Index (SPI). The study showed differential spatial and temporal expression of drought in Zimbabwe, over the 19-year study period. November had the highest frequency of drought while the first quarter of the season experienced more droughts than the second quarter. Spatially, virtually all AEZ in Zimbabwe are prone to droughts and the frequency is increasingly, with the Agro-ecological region five (southern Zimbabwe) being the worst affected. Further, the study found a strong positive relationship between the VCI and maize yield (r = 0.701, P = 0.000), demonstrating the utility of the index in drought monitoring at national level. Overall, findings from this work highlight the significance of using multi-date and national-scale analysis of agricultural drought occurrence and trends. Moreover, this work provides critical baseline information for developing drought resilience and mitigation strategies in drought-prone areas.
1. Introduction
Drought is a recurrent natural phenomenon, with adverse impacts on socio-economic development and the environment in general (Wilhite et al; Aswathi et al. Citation2018). It is the most widespread hazard occurring virtually in all regions of the world (Kourouma et al. Citation2021). About 38% of the world’s land area has experienced some episodic droughts (World Bank Citation2005). Globally, droughts have resulted in significant loss of life. For example, about eleven million deaths have been reported in the past, while approximately two billion people have been directly affected by drought-induced food shortages (FAO Citation2016). The number of drought related deaths is highest in the African continent, which has experienced ∼800,000 deaths since 1900, with about 262 million directly affected. The worst drought in Africa occurred, during the 1991/1992 rainfall season where southern Africa was worst hit. This resulted in countries such as Zimbabwe experiencing about 11% shrinkage in gross domestic product and food shortages (Maphosa Citation1994). In Zimbabwe, the 1991/1992 drought resulted in more than one million cattle deaths and six million people directly affected. Besides, recent droughts in Zimbabwe have increased the country’s food insecurity where in 2019 alone, about 3.5 million people were considered food insecure by the United Nations World Food Programme. In addition, the high frequency of droughts directly threatens agricultural dependent economies and livelihoods and impedes the attainment of the United Nations Sustainable Development Goals, particularly, goals number one, two and three, that is, no poverty, zero hunger, and good health and wellbeing, respectively (Frischen et al. Citation2020). In this regard, it is important to monitor droughts routinely and timeously to understand their spatial and temporal evolution as it is critical for identifying areas at risk and development of early warnings and disaster preparedness strategies.
Drought is a complex phenomenon whose dimensions are still poorly understood (Frischen et al. Citation2020). The complexity of drought arises from the various definitions of the phenomenon resulting in operational definitions being applied. However, all droughts emanate from a precipitation deficiency over a specified period, such as a month, resulting in an imbalance between water supply and societal or environmental demands (Wilhite and Buchanan-Smith Citation2005). Due to complex nature of drought, four main categories are used to understand its occurrence and these are meteorological, hydrological, agricultural and socio-economic drought (Wilhite and Glantz Citation1985). The operational definition of drought thus depends on the component of the biophysical or socio-economic system affected (Winkler et al. Citation2017). Since droughts are triggered by precipitation deficiency (Wilhite and Glantz Citation1985) four dimensions i.e., duration, geographical extent, intensity and severity are used determine whether and to what extent water supply fails to meet demand (Rossi et al. Citation1992). While the four dimensions are critical for characterizing droughts, intensity is regarded as the most important (Tsakiris and Vangelis Citation2005). Drought intensity is the ratio of drought severity divided by duration (Tsakiris and Vangelis Citation2005). The severity of a drought depends on the duration, season of occurrence, spatial extent of the affected area as well as the impacts on socio-economic activities and the environment (Wilhite and Buchanan-Smith Citation2005). However, the onset of a drought is difficult to determine since it is gradual, and the effects are long term.
Previous studies on drought occurrence in sub-Saharan Africa, particularly Zimbabwe were mostly based on in-situ rainfall station data (Chamaille-Jammes et al. Citation2007; Mazvimavi Citation2010). However, a limitation of station-based data is that in most developing countries, observation stations are sparsely distributed or even missing in some areas resulting in limited spatial and temporal coverage (Kourouma et al. Citation2021). Where stations are available, there is inconsistency in data collection for the climate parameters due to poor maintenance of equipment, non-functionality, vandalism, and the lack of automated stations (Magno et al. Citation2018). The sparse network combined with inconsistent data records limit our understanding of drought dimensions across the country (Frischen et al. Citation2020). Moreover, as data is measured at point locations the use of measurements from these stations to estimate for areas without stations, yield estimates, which are not comparable to reality, due to the wide distance between the stations (Chikodzi and Mutowo Citation2013). Most studies have surprisingly relied on ground station data in characterising droughts despite limitations associated with ground-based station measurements. In fact, few studies have taken advantage of the unique opportunities offered by satellite sensors such as wide spatial coverage in addition to availability of data at consistent temporal and spatial dimensions, suitable for farm-scale drought analysis (Unganai and Kogan Citation1998; Mutowo and Chikodzi Citation2014; Kuri et al. Citation2018; Citation2020). Although these studies have applied remotely sensed data to characterise drought (see Liu and Kogan Citation1996; Sierra-Soler et al. Citation2016; Kogan et al. Citation2017; Aziz et al. Citation2018; Kogan et al. Citation2019; Javed et al. Citation2021; Khan and Gilani Citation2021; Kourouma et al. Citation2021; Zhang et al. Citation2021), few have characterised agricultural drought in across temporal scales relevant for agricultural planning e.g., monthly scale or sub-seasonal scale. For instance, Mutowo and Chikodzi (Citation2014) estimated the spatial extent of agricultural drought in Zimbabwe across the whole agricultural season for the period between 2005 and 2010 using the vegetation condition index (VCI).
While important insights on drought extent and severity at the seasonal scale were generated from previous studies, there is an urgent need to understand drought occurrence at finer scales such as monthly and sub-seasonal scales. This information is important for timely and accurate intervention in the agricultural sector such as crop selection and irrigation. For instance, a recent study by Kuri et al. Citation2020 revealed differential impacts of drought across the season with drought periods occurring at the vegetative stage having more impacts on crop yield than at the senescence stage. In this regard, there is a need to understand the frequency and probability of drought occurrence at temporal scales appropriate for interventions e.g., month to avert food shortages. In most parts of the world particularly in southern Africa, the increase in frequency and severity of droughts are related to climate change. In fact, studies have indicated that most parts of southern Africa will experience decrease in rainfall and increase in temperature which is likely to lead to high soil-moisture deficiency. With the advent of climate change, which is likely to see droughts becoming more frequent there is need to utilize all available tools to enhance knowledge on drought occurrence. Remotely sensed data thus becomes one of the key primary data sources as it has a large footprint with high temporal resolution and a long history archival data, spanning over 40-years. This study therefore aimed at analysing the frequency and probability of drought occurrence at multiple temporal scales over a nineteen-year period across different Agro-ecological regions in Zimbabwe using satellite-derived metrics.
2. Materials and methods
2.1. Study area
Zimbabwe is located in southern Africa and is surrounded by Mozambique to the east, Zambia to the north, Botswana to the west and South Africa to the south (Muchadeyi et al. Citation2007). The country is located between latitude 15 and 22° south and longitude 26° and 34° east, and is divided into five Agro-ecological regions that are grouped according to uniform climatic characteristics ( and ) (Masvaya et al. Citation2010). Zimbabwe is mostly dominated by a sub-tropical climate with a wet and hot season (October and November) and a cold and dry season (May and August) (Shoko et al., Citation2015). Rainfall reliability decreases from north to south as well as from the east to west. Only 37% of the country receives rainfall considered adequate for agriculture (Chikodzi et al. Citation2013). There is distinct rainfall variability with areas characterized by high altitude receiving high rainfall and low-lying areas having low and erratic rainfall. The amount of rainfall received determines the nature of economic activities in particular areas. For example, Agro-ecological Zone 1, receives an annual rainfall of >1000mm distributed throughout the year while Agro-ecological Zone 2 receives rainfall of between 700 to 1000 mm received mostly in summer. These two regions support large and small scale intensive agricultural activities such as horticulture and mixed farming. In Agro-ecological Zone 3 rainfall varies between 500 to 700 mm and droughts are a common phenomenon due to infrequent rainfall. The dry regions (i.e., Agro-ecological Zones 4 and 5) in the low elevation areas are characterised by erratic and unreliable annual rainfall of less than 600 mm and these regions are prone to frequent seasonal droughts (Mugandani et al. Citation2012). During drought years these regions can receive less than 60% of their long term average annual rainfall (Nangombe, 2015).
Figure 1. Agroecological regions of Zimbabwe (Vincent and Thomas, 1961) overlaid on Sentinel 2016 landcover map (European Space Agency, Citation2016)
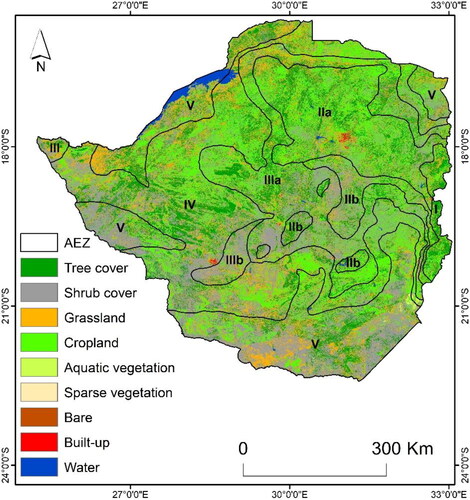
Table 1. The rainfall and agriculture potential of the five agro-ecological regions of Zimbabwe.
2.2. Data sources
2.2.1. Vegetation condition index (VCI)
In this study, the Vegetation Condition Index (VCI) was used to characterize drought occurrence in Zimbabwe. The VCI was chosen over other drought indices as it is one of the most commonly used remotely sensed index for drought and crop condition monitoring and has been successfully applied across a number of agricultural landscapes in Africa (Unganai and Kogan Citation1998; Kuri et al. Citation2020; Frischen et al. Citation2020; Kuri et al., Citation2020; Kourouma et al. Citation2021; Mupepi and Matsa Citation2022), Asia (Jain et al. Citation2010; Muthumanickam et al. Citation2011; Dutta et al. Citation2015, Khan et al., Citation2020; Mikaili and Rahimzadegan Citation2022), Australia (Kogan et al. Citation2018; Kuri et al., Citation2020), North America (Quiring and Ganesh Citation2010; Kogan and Guo Citation2015; Kogan et al. Citation2017) and even at global scale (Kogan et al. Citation2020, Khan and Gilani Citation2021). Advantages of the VCI are that as a satellite-based agricultural drought index, it provides near real time data across spatial scales and overcomes the problem of sparse network of meteorological stations that are characteristic of most developing countries such as Zimbabwe (Dhakar et al. Citation2013). Apart from these advantages, VCI significantly reduces impacts on the spatial heterogeneity in ecological systems, geographical locations, soil conditions and performs well in detecting crop water shortages associated with the NDVI (Kogan Citation1995; Liu and Kogan Citation1996). The VCI was derived from 10-day NDVI composites from SPOT VEGETATION 1 and PROBA-V satellite at 1-km spatial resolution. SPOT VGT data is available from the 21st of April 1998 up to the 31st of May 2014. PROBA-V Normalized Difference Vegetation Index (NDVI) data were used to fill the gap (1 June 2014 to 31 December 2018). NDVI is a spectral index derived from remote sensing data to estimate vegetation vigour and is closely related to drought conditions (Drisya and Roshni Citation2018). The data were accessed from the Flemish Institute for Research website (http://www.vito_eodata.be). The acquired raw remotely sensed images were already pre-processed to remove errors. The VCI derived from Normalized Difference Vegetation Index (NDVI) is resourceful as it provides near real-time data over an area at a relatively high spatial resolution. Further, this data provides an independent methodology for drought monitoring as it incorporates both climatic and ecological components (Jiao et al. Citation2016).
2.2.2. Rainfall data
Monthly rainfall data used to calculate the Standardised Precipitation Index were made available by the Meteorological Services Department of Zimbabwe. The data covering the period 1980-2020 were from six stations distributed across the five Agro-ecological regions of Zimbabwe (). These stations were selected based on the availability of rainfall data.
Table 2. The name and location of Meteorological stations where rainfall used for validating Vegetation Condition Index was derived as well as the Agro-ecological regions across a rainfall gradient in Zimbabwe.
2.3. Data analysis
Prior to data analysis, NDVI data was imported into the Drought Monitoring System (DMS) developed under the EU-AU funded Monitoring the Environment for Security in Africa (MESA). The VCI was calculated for the period between 2000 and 2018. The VCI was calculated from the NDVI using the following formula.
(1)
(1)
Where:
NDVIi is the NDVI for the period of interest
NDVIMIN is the minimum NDVI ever recorded in each pixel
NDVIMAX is the maximum NDVI ever recorded in each pixel
2.3.1. Determining frequency and probability of drought occurrence
To determine the frequency and probability of drought occurrence, pixels were first classified as having experienced a drought or not based on the 36% threshold suggested by Kogan (Citation1995). Specifically, drought pixels were those with VCI values less than 36% and were assigned 1 and 0 otherwise. To obtain the frequency of dry dekads per pixel, we summed all the binary maps i.e., 1 (drought) and 0 (no drought), over a specified time scales such as monthly, seasonal, and annual scales. The frequency of drought defined by the number of dry dekads over a given period were then divided by the total number of dekads over that specified time to yield a probability map showing how likely it was for drought to occur over that time scale. The seasonal analysis was based on two periods, the 1st part covering the first three months of the rain season i.e., from October to December (OND) while the 2nd part covered the last three months of the rainfall season i.e., from January to March (JFM). This classification is based on the crop growing season in the country during which time conditions for crop growth are optimal (Kuri et al., Citation2020). All the output maps based on the different time scales were later classified for presentation based on the natural breaks method (Dent et al. Citation2009). The natural breaks method of data classification was applied in this study since it has the added advantage of being able to identify inherent patterns within a dataset (Vasilca Citation2019).
2.4. Validation of vegetation condition index derived drought
In this study, several validation statistics were used to determine the extent to which satellite derived Vegetation condition index (VCI) relates to rainfall measurements from meteorological stations. To calculate these statistics, data from six rainfall stations distributed across the five Agro-ecological regions of Zimbabwe () were used to calculate Standardised Precipitation Index (Mckee et al. Citation1993) (SPI) at the monthly and 3-month timescales. SPI at the monthly and 3-month timescales was chosen as it is closely related to soil moisture which, in turn, affects crop growth and vigour. SPI was calculated using the Artificial Intelligence Techniques-Genetic Algorithms available in the SPIGA package (Ayala-Bizarro and Zúñiga-Mendoza 2016) in R Version 4.02 (R Development Core Team Citation2015).
Results of SPI and VCI calculations were independently classified into a drought (1) and no drought (0) classes based on classification scheme by Mckee et al. (Citation1993) and Kogan (Citation1995), respectively. Specifically, we used VCI of <36% to denote a drought condition and no drought otherwise while a threshold of <0 was used to determine a drought and >0 no drought based on SPI (Winkler et al. Citation2017). We did not classify droughts based on intensity as our interest was on drought detection regardless of the drought intensity. The resultant Boolean maps were then overlayed in a GIS environment to create a confusion matrix, indicating the number of times a drought or no drought condition was detected or missed by these two indices in ILWIS GIS (ITC, 2000). We then calculated several metrics of agreement between these two including: Sensitivity, Specificity, Accuracy, F1 Score and Matthews Correlation Coefficient, True Skills Statistic () for the 1 month and 3-month time scales.
Table 3. Metrics used to validate the satellite derived drought index based on SPI calculated from six rainfall stations across Agro-ecological regions of Zimbabwe.
Further validation was carried out through relating VCI and maize yield at the national scale. To do this, VCI was first aggregated using the cultivation mask for each of the growing seasons from 1998 to 2018. This yielded a seasonal average VCI for each growing season for the country. The seasonal average VCI was then related to annual maize yield for each corresponding year using regression analysis in R Version 4.02 (Core, R., 2015).
3. Results
3.1. Frequency of drought occurrence across agro-ecological regions at the monthly scale
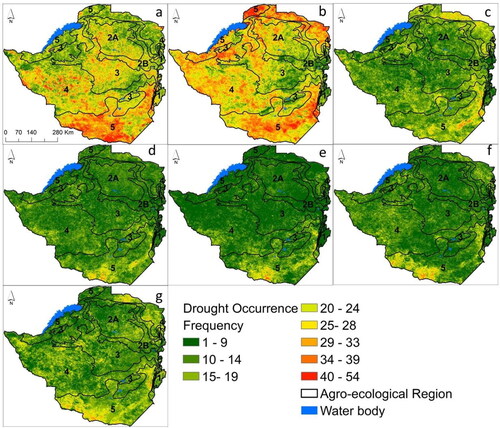
The results of drought frequency analysis at the monthly scale showed that over the entire study period, high frequency of dry dekads were experienced in October, November and December with November having the highest frequency. Spatially, areas with the highest frequency droughts are in the southern and northern parts of the country which coincide with Agro-ecological region 5. The results show that these regions experienced a cumulative average of 54 dry dekads over the 19-year period () suggesting multiple occurrences of droughts. In contrast, areas located in Agro-ecological regions 1 (eastern), 2a and 2 b (central to eastern) experienced fewer drought episodes compared to the rest of the country. Overall, all the Agro-ecological regions in the country experienced more than one dry dekad across all the months during the growing season (October to March) as illustrated by drought occurrence ≥1 (). Comparatively, drought conditions tend to be less in the months of January to March than between October and December. January, February and March are the peak rainfall months in Zimbabwe and are often characterised by high rainfall associated with cyclonic activity.
Figure 2. Frequency of drought occurrence for the months of a) October, b) November, c) December, d) January, e) February, f) March and g), April.
3.2. Spatial and temporal variation in drought frequency on an annual scale
The results of drought frequency analysis at the annual scale illustrate that the highest number of dry dekads were experienced in 2002, 2003, 2005, 2006, 2008, 2009 and 2016 ( and ). Among these drought years, the years 2002 and 2008 had the highest frequency of drought occurrence over the 19-year period. On a spatial scale, the highest frequency of droughts was observed in the districts of Hurungwe and the south and north-western parts of the country i.e., Beitbridge and Hwange mostly located in Agro-ecological region 5. In these districts an annual average of 21 dry dekads were observed over the 19-year period.
Figure 3. Spatial variation in drought frequency at the annual scale across Agro-ecological regions of Zimbabwe for the years a) 2000, b) 2001, c)2002, d) 2003, e) 2004, f) 2005, g) 2006, h)2007, i) 2008, and, j) 2009.
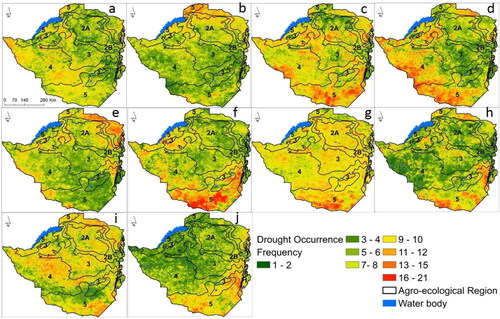
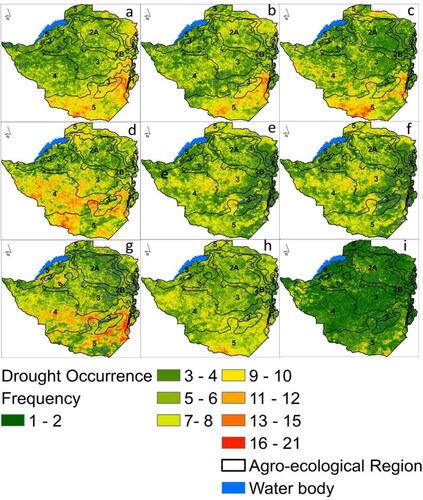
Figure 4. The spatial variation in the frequency of drought occurrence at the annual scale across Agro-ecological regions of Zimbabwe for the years a) 2010, b) 2011, c) 2012, d) 2013, e) 2014, f) 2015, g) 2016, h) 2017 and, i) 2018.
3.3. Spatial and temporal variation in frequency of drought occurrence at the sub-seasonal scale
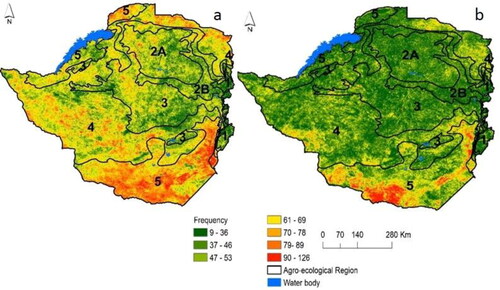
The results of drought occurrence based on the 1st part of the agricultural season (October to December) and 2nd part (January to March) are illustrated in . It is observed that although droughts are common across the season, the first part of the season (October to December) is characterised by higher frequency of drought than the second part of the season (January to March) Specifically, close to three quarters of the country experience drought in the first half of the season with Agro-ecological regions 3, 4 and 5 being the most affected. However, across the two seasons the Agro-ecological region 5 had the highest frequency of drought occurrence.
Figure 5. The spatial variations in drought frequency across Zimbabwe in the first and second part of season from the year 2000 to 2018.
3.4. Frequency of drought at the annual scale over the 19-year period
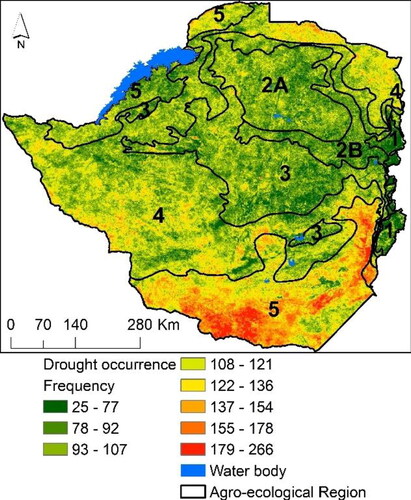
Results of drought occurrence based on the number of dekads over the 19-year period show a relatively high frequency of occurrence across all Agro-ecological regions. This was observed throughout the period under study except for Agro-ecological region 1 and few isolated pockets in Agro-ecological regions 2a and 2 b (). However, the frequency of drought varied with Agro-ecological region 5 covering the southern districts namely Beitbridge, Chiredzi, Chimanimani, Chipinge, Gwanda, and Mwenezi having highest frequency of drought occurrence.
Figure 6. Overall drought frequency from the year 2000 to 2018.
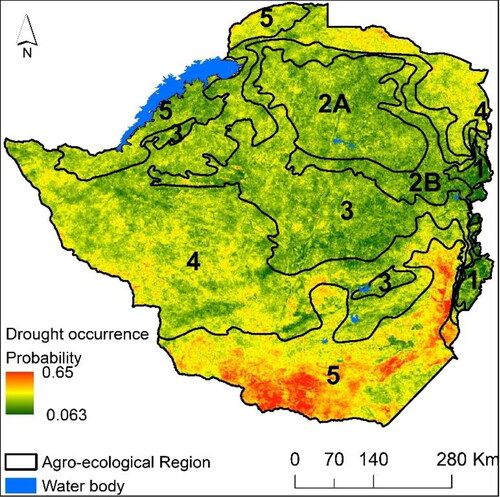
Results of drought probability assessment based on dry dekads from the year 2000 to 2018 illustrate that Agro-ecological regions 5 (southern and northern parts of the country) and 4 (western and north eastern parts of the country are predominantly drought prone with approximately more than 40% channce of experiencing drought in any year. In contrast, Agro-ecological region 1 has the least likelihood of a drought followed by Agroecological regions 2a and 2 b. Overall, results of the study show the proness of the country to droughts as illustrated by a probability of >0.06 ().
Figure 7. Probability of drought occurrence based on dekadal data from 2000 to 2018.
3.5. VCI Validation using meteorological station derived SPI
illustrates the results of the validation metrics based on a one-month SPI derived from meteorological stations and Vegetation Condition Index. Results show that sensitivity (True Positive Rate) is generally higher than specificity (True Negative Rate) across all six stations considered in this study suggesting that the two metrics agree on drought occurrence more than they agree on the non-occurrence of drought. This is further supported by a moderate to relative strong agreement between the two drought indices as reflected by high accuracy values and F1 Scores. In addition, there is relatively weak but positive correlation (as measured by Matthews Correlation Coefficient and True Skills Statistic) between VCI and SPI. Overall, the least agreement in the two indices is observed in the driest regions i.e., AEZs IV (Masvingo) and V (Beitbridge) while higher correlation is observed in the wetter AEZs (I-III).
Table 4. Validation of vegetation condition index based on one month standardised precipitation index derived from six stations distributed across agro-ecological regions of Zimbabwe.
In contrast, results at the 3-month scale show relatively higher specificity than at the monthly scale implying concurrence of the two indices in detecting absence instead of drought presence ().
Table 5. Validation of vegetation condition index based on 3-month standardised precipitation index derived from six stations distributed across agro-ecological regions of Zimbabwe.
Moreover, a stronger relationship, based on Matthews Correlation Coefficient and F1 score, was observed between SPI and VCI at the 3-month than at 1-month scale. The least correlation between VCI and SPI was observed in the driest region (AEZ V) while the highest correlation was detected in the wettest region of the country (AEZ I).
3.6. Relationship between growing season VCI and annual maize yield at the national scale
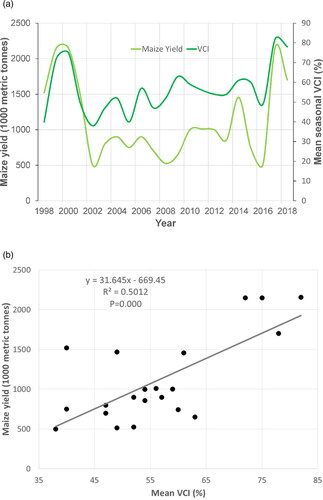
Results of correlation analysis illustrates a significant and strong correlation (F19= 19.09, R2=0.5012, P = 0.000) between VCI and national maize yield with a general increase in maize yield associated with high VCI and vice versa (). Typical drought years such as 1998, 2002, 2005, 2008, 2009, 2012 and 2016 coincide with dips in both maize yield and VCI, while normal to above normal rainfall years are associated with relatively high maize yield.
Figure 8. The relationship between maize yield (in 1000 metric tonnes) and Vegetation Condition Index (a) for each of the years from 1998 to 2018 and b) for the 20-year period.
These results relate well with those of SPI which detected drought and non-drought years () suggesting the utility of VCI to detect agricultural drought.
Figure 9. Variations in monthly SPI based on rainfall measured from 1981 to 2020 at Beitbridge weather stations in Zimbabwe.
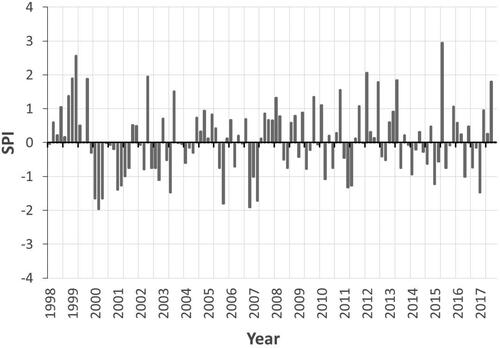
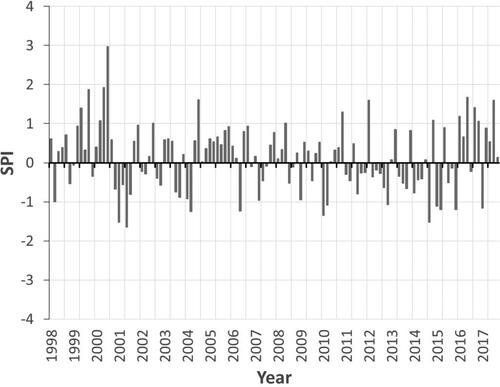
Figure 10. Variations in monthly SPI based on rainfall measured from 1981 to 2020 at Kadoma weather stations in Zimbabwe.
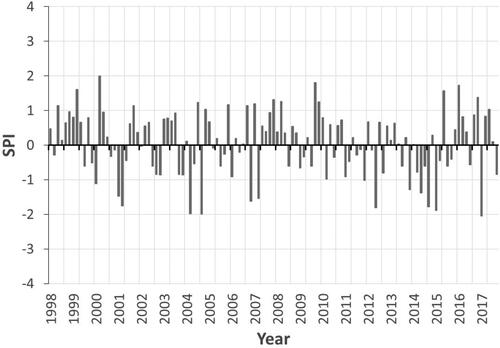
Figure 11. Variations in monthly SPI based on rainfall measured from 1981 to 2020 at Masvingo weather station in Zimbabwe.
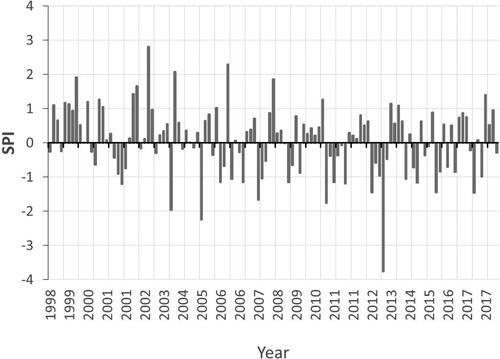
Figure 12. Variations in monthly SPI based on rainfall measured from 1981 to 2020 Mutoko weather station in Zimbabwe.
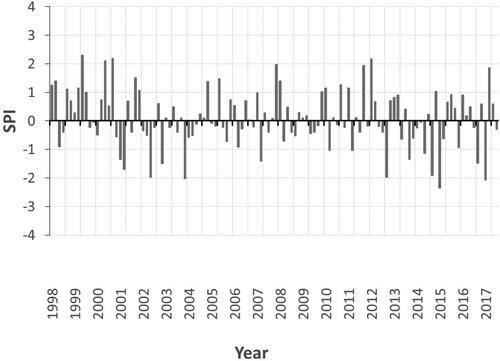
Figure 13. Variations in monthly SPI based on rainfall measured from 1981 to 2020 at Mvurwi weather station in Zimbabwe.
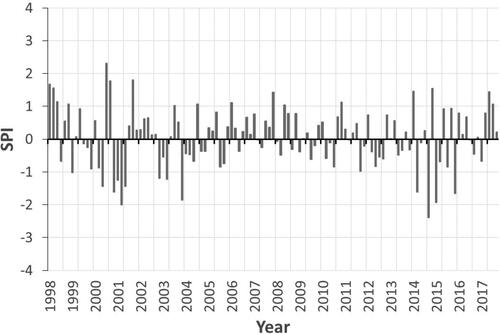
Figure 14. Variations in monthly SPI based on rainfall measured from 1981 to 2020 at Nyanga weather station in Zimbabwe.
4. Discussion
The aim of this study was to empirically derive drought frequency over multiple temporal scales i.e., monthly, seasonal, and sub-seasonal as well as annual scale at national level. Overall, results showed that droughts are a common phenomenon across all temporal scales, although at a spatial scale, there is great variability in the prevalence of droughts across the country. For example, at the monthly scale November was characterised by the highest frequency of drought while at the sub-seasonal scale the first half of the rainfall season (OND) had the highest frequency of drought compared with the second half of the season (JFM). At the annual scale, the years 2002, 2006, 2008, 2009 and 2018 had the highest frequency of drought occurrence. Across all these temporal scales, the southern districts of the country persistently experienced higher frequency of droughts than the rest of the country.
The retrospective analysis of droughts at the monthly scale showed that November had the highest frequency of drought occurrence in Zimbabwe. This result is consistent with Tadross et al., (Citation2007) who observed that effective rainfall, i.e., sufficient rainfall for planting, is now being received late in the season for several countries in southern Africa. Since November usually marks the beginning of the rainfall season, drought occurrence during this period has important implications to food security and livelihoods. This is particularly critical as the country is heavily reliant on rain-fed agriculture and livestock with the agricultural sector contributing significantly to the economy through employment creation, foreign currency earnings, supply of raw materials to industry and contributes a relatively large percentage to GDP (Chifurira et al. Citation2016). As previous studies have shown that droughts have more profound effects on crops at the vegetative stage than the reproductive stage, the occurrence of droughts in November is likely to negatively affect crop germination and ultimately crop yield. In fact, Allen et al., (Citation1998) noted that, on average, crops require a period of ∼30 days to germinate and establish suggesting that if droughts occur during this month, they will affect crop establishment and ultimately yield. Moreover, the onset of rainfall influences the length of the growing season (Oladipo and Kyari, Citation1993) thereby determining the suitable crops that can be grown and the yield during this period. Therefore, the importance of studies aimed at understanding drought progression over time cannot be over-emphasized especially in rain-fed Agro-based economies.
Like results of drought analysis at the monthly scale, findings at the seasonal scale indicate that more droughts are experienced in the first half of the rainfall season (OND) when compared with second half of the season (JFM). The high frequency of drought occurrence in most parts in the southern, south-eastern, western, and northern parts of the country during the first part of the season may also be due to late onset of the rainfall season. These areas are generally classified as low rainfall areas where the climate is moderated by the low altitude. This finding points to the need to consider the growing of short season drought tolerant crops such as millet and sunflower. The relatively high rainfall normally received in the second half of the season in the country may be explained by the latitudinal movement in the major rainfall bearing systems in Zimbabwe. Specifically, the southern migration of the Inter Tropical Convergence Zone (ITCZ) and Congo air boundary (CAB) dominate the greater parts of the country and are responsible for bringing moisture into the country during the summer season (Cook Citation2000; Manjowe et al. Citation2018) and the effects of these two systems are strongest in January (Mason et al. Citation1994). Moreover, the second half of the season is associated with cyclonic activity in the Indian Ocean that brings lots of rain in the in the eastern, central and southern parts of the country. The findings of this study are inconsistent with previous studies that reported a tendency of dry spells to be concentrated in the second part of the season than the first part particularly in January and February (Makarau and Jury, Citation1997), resulting in crop yield decline (Twomlow et al., Citation2006; Cooper et al., 2008). Combined, our results emphasise the importance of multi-temporal scales when analysing agricultural drought need of assessing data at various spatial scales.
The finding that the southern and western districts of the country such as Beitbridge, Chiredzi, Gwanda and Mwenezi are highly susceptible to droughts across all temporal scales is consistent with previous studies. According to results from earlier studies, these districts are within Agro-ecological regions 4 and 5 characterised by relatively low and erratic rainfall. The low and erratic rainfall could be attributed to failure of major rainfall bearing systems such as the ITCZ to cover southern most parts of the country resulting in reduced rainfall (Frischen et al. Citation2020, Chikodzi and Mutowo Citation2013, Mutowo and Chikodzi Citation2014). For example, in districts like Beitbridge, extremely high temperatures are experienced for consecutive days during the rainfall season resulting in high evapotranspiration and high soil-moisture deficits contributing to crop failure in the region (Simba, Citation2012). In fact, the southern districts have been identified as the most vulnerable to droughts in the country and are thus prioritised for the government projects on coping with drought. Results from this study further emphasise the need for not only identifying areas at risk of agricultural drought but the specific periods during which droughts are experienced thereby providing spatially and temporally specific information that is key in making interventions in the agricultural sector such as irrigation.
Overall, results showed that droughts are a recurrent phenomenon with an average of six out of 19 years having experienced drought. The most intense drought was detected in the years 2002 and 2008 and its spatial coverage also varied spatially. Previous studies have also identified the years 2001, 2002, 2003, 2006, 2008 to 2016 as extensive drought years in Zimbabwe (Winkler et al. Citation2017). Given that the country is already exposed to incessant droughts under the current climate (Zimbabwe Third National Communication to the UNFCCC, 2016) and that the frequency of droughts and other extreme events are projected to increase in future, there is need to develop proactive strategies for ensuring that agriculture production is sustained or even increased, especially in view of the ever-increasing population. For instance, the adoption of climate smart agriculture, a suite of methods that seeks to align agricultural practices to climate change and variability (e.g., conservation farming and adoption of drought tolerant varieties) could help in reducing drought impacts on the agricultural sector. The country also needs to take advantage of the abundant water resources to develop irrigation supported agriculture to reduce crop failure. Thus, our study emphasizes the need for multi-temporal approaches in assessing agricultural droughts.
Results of the validation exercise illustrate a strong positive correlation between VCI and maize yield (r = 0.701, p = 000), with the former explaining more than 50% of the variation in maize yield at the national scale. The relationship between VCI and maize yield has long been established within heterogeneous agricultural landscapes of southern Africa (Unganai and Kogan Citation1998; Mikaili and Rahimzadegan Citation2022). The study demonstrated that between 46 and 83% of the variance in maize could be explained by VCI thereby pointing out to the suitability of VCI in detecting, monitoring as well as mapping agricultural drought. Similarly, Gitelson et al. (Citation1998) carried out a study in Kazakhstan across a climatic gradient and illustrated that VCI consistently explained 76% of the variance in crop density. Zambrano et al. (Citation2016) demonstrated the utility of the VCI in detecting drought as well as accurately identifying affected stakeholders in a drought-prone areas thereby and improving drought emergency response, especially in the absence of local observations. Using the dry dekads derived from the VCI, Kuri et al. (Citation2014, 2017, Citation2020) established a significant relationship between maize yield and the number as well as sequence of the VCI-based dry dekads during the growing season. Thus, our results further provide evidence of the utility of the VCI in characterising droughts in agricultural landscapes.
Further validation based on several statistics such as Matthews Correlation Coefficient and True Skills Statistic established a relatively poor agreement between satellite-derived VCI and station-based one month SPI but slightly improved at 3-month scale. Two mechanisms may explain the observed poor relationship between VCI and SPI at the monthly scale. First, the lagged response of vegetation to a drought episode is expected to dampen the relationship between VCI and SPI (Ji and Peters, Citation2003; Törnros and Menzel Citation2014). For instance, Zambrano et al. (Citation2016) observed the strongest correlation between VCI and SPI at 3-month timescale in croplands of Chile, suggesting the time lag in response of crops to a drought event. These results are in accord with Wei et al. (Citation2021) who observed the tendency of the VCI and TCI to perform well in monitoring long-term drought conditions. Although focusing on eco-regions of Africa, Lawal et al. (Citation2021) observed variability in the timescales of the response of vegetation indices to drought with shorter responses over most parts of southern Africa. However, since the focal areas in this study are predominantly croplands one would expect a faster response of crops to a drought episode. Second, the cropping systems are heterogeneous consisting of irrigated and non-irrigated areas. It is therefore reasonable to assume that the relationship between VCI and SPI should be stronger under rainfed agricultural landscapes than irrigated as the latter system supplements rainfall during periods of moisture stress thereby reducing the sensitivity of crops to changes in moisture availability. Qian et al. (Citation2016) attributed the low correlation between the VCI and precipitation to extensive use of artificial irrigation thereby reducing sensitivity to variations in precipitation. Similarly, a study by Bhuiyan et al., (Citation2006) revealed better correlation between VCI and SPI during the monsoon season (rainfall season) as vegetation performance is heavily dependent on precipitation unlike the other seasons which are partially reliant on irrigation. In our study, the VCI data were not separated by irrigation status as data on irrigation were not available. Thus, future studies need to test the sensitivity of crops to meteorological drought under different agricultural water supply systems.
Another important result of this study is that there is better correlation between VCI and SPI in wetter than drier regions at both 1-month and 3-month scale (). This could suggest that crops in wetter regions are more sensitive to changes in water availability than those in higher rainfall areas. Lawal et al. Citation2021 demonstrated the differential response of vegetation to changes in moisture availability across a rainfall gradient. In particular, the study illustrated that plants in drier regions tend to develop drought tolerant morphological and physiological attributes that make them less sensitive to drought episodes unlike plants in the wetter regions that have shorter response timescales to droughts. Although this finding may not be surprising, our study is among the first to demonstrate differential response of plants to drought in agricultural landscapes.
This study generated important insights into spatial occurrence of drought across heterogeneous agricultural landscapes of Zimbabwe at various temporal scales using VCI. Although VCI has been widely used across various climate systems, spatial scales, agricultural as well as ecological systems, it has some drawbacks that warrant attention. Singh et al. (Citation2003) observed that it may be difficult to distinguish low VCI values emanating from flooding and drought thereby making the VCI unsuitable for drought monitoring when used independently. Studies have also shown that the VCI tends to be outperformed by other drought indices that incorporate temperature such as Vegetation Health Index. Nevertheless, the close correlation between the VCI and maize yield at the national scale in our study suggest that the performance of the drought index could be context and scale specific. Thus, future studies could test the performance of the VCI in detecting drought intensities at various spatial scales and different environmental settings. Furthermore, it will be interesting to test the performance of the VCI in monitoring agricultural drought using various sensors such as the Moderate Resolution Imaging Spectroradiometer (MODIS), Landsat 8 and Sentinel which have different spatial, temporal, radiometric and spectral resolutions. Such studies will help in shedding light on the optimal spatial and temporal scale at which agricultural drought can be detected using indices such as VCI and VHI.
5. Conclusion
In this study Vegetation Condition Index (VCI) was successfully used to detect the frequency and probability of agricultural drought occurrence including trends in the occurrence of high intensity droughts. On a yearly scale, droughts were detected in 2002, 2006, 2008, 2009 and 2018 while at the monthly scale November had the highest frequency of drought occurrence. This period coincides with the onset of the crop growing season, which has important implications to the final yield loss at the end of season. High frequency of drought occurrence was found to be more common in first part of the season compared to the last part of the season. Furthermore, there was a statistically significant positive relationship between VCI and maize yield at the national scale suggesting the utility of VCI in monitoring agricultural drought. The study demonstrated the utility of satellite derived vegetation indices in identifying geographic areas which are at risk of experiencing a drought. The findings of this study provide critical baseline information required for the provision of early warning systems and disaster preparedness in areas exhibiting high risk of drought occurrence in Zimbabwe.
Disclosure statement
No potential conflict of interest was reported by the author(s).
Data availability
NDVI datasets used in this study are readily available at http://www.vito_eodata.be.
References
- Allen, R.G., Pereira, L.S., Raes, D. and Smith, M., 1998. Crop evapotranspiration-Guidelines for computing crop water requirements-FAO Irrigation and drainage paper 56. Fao, Rome, 300(9), p.D05109.
- Aswathi PV, Nikam BR, Chouksey A, Aggarwal ASP. 2018. Assessment and monitoring of agricultural droughts in maharashtra using meteorological and remote sensing based indices. ISPRS Ann Photogr Remote Sens Spatial Inform Sci. 4(5). 253-264
- Aziz A, Umar M, Mansha M, Khan MS, Javed MN, Gao H, Farhan SB, Iqbal I, Abdullah S. 2018. Assessment of drought conditions using HJ-1A/1B data: A case study of Potohar region, Pakistan. Geomatics Nat Hazards Risk. 9(1):1019–1036.
- Bhuiyan C, Singh RP, Kogan FN. 2006. Monitoring drought dynamics in the Aravalli region (India) using different indices based on ground and remote sensing data. Int J Appl Earth Obs Geoinform. 8(4):289–302.
- Chamaille-Jammes S, Fritz H, Murindagomo F. 2007. Detecting climate changes of concern in highly variable environments: Quantile regressions reveal that droughts worsen in Hwange National Park, Zimbabwe. J Arid Environ. 71(3):321–326.
- Chifurira R, Chikobvu D, Dubihlela D. 2016. Rainfall prediction for sustainable economic growth. Environ Econ. 7(4):120–129.
- Chikodzi D, Mutowo G. 2013. Drought monitoring for Masvingo Province in Zimbabwe: a remote sensing perspective. Herald J Geograph Regional Plann. 2:56–60.
- Chikodzi D, Zinhiva H, Simba FM, Talent M. 2013. Reclassification of agro-ecological zones in Zimbabwe-the rationale, methods and expected benefits: The case of Masvingo Province. J Sustainable Devel Africa. 15(1):104–116.
- Cook KH. 2000. The South Indian convergence zone and interannual rainfall variability over Southern Africa. J Climate. 13(21):3789–3804.
- Dent B, Torguson J, Hodler T. 2009. Cartography: Thematic map design. New York: McGraw Hill Higher Education.
- Dhakar R, Kumar VS, Pradhan S. 2013. Study on inter-seasonal and intra-seasonal relationships of meteorological and agricultural drought indices in the Rajasthan State of India. J Arid Environ. 97(2013):108e119–119.
- Drisya, J.; Kumar, D.S.; Roshni, T. Spatiotemporal Variability of Soil Moisture and Drought Estimation Using a Distributed Hydrological Model. In Integrating Disaster Science and Management; Pijush, S., Dookie, K., Chandan, G., Eds.; Elsevier: Amsterdam, The Netherlands, 2018; 451–460.
- Dutta D, Kundu A, Patel NR, Saha SK, Siddiqui AR. 2015. Assessment of agricultural drought in Rajasthan (India) using remote sensing derived vegetation condition index (VCI) and standardized precipitation index (SPI). Egyptian J Remote Sens Space Sci. 18(1):53–63.
- ESA. 2016. ESA Climate Change Initiative Land Cover Sentinel-2 Prototype Map of Africa 2016 at 20 meters. Accessed 20 April 2021. http://2016africalandcover20m.esrin.esa.int/download.php
- FAO. 2016. The state of food and agriculture 2016: Climate change, agriculture, and food security. Rome, Italy: FAO.
- Frischen J, Meza I, Rupp D, Wietler K, Hagenlocher M. 2020. Drought risk to agricultural systems in Zimbabwe: A spatial analysis of hazard, exposure, and vulnerability. Sustainability. 12(3):752–723.
- Gitelson AA, Kogan F, Zakarin E, Spivak L, Lebed L. 1998. Using AVHRR data for quantitive estimation of vegetation conditions: Calibration and validation. Adv Space Res. 22(5):673–676.
- Jain SK, Keshri R, Goswami A, Sarkar A. 2010. Application of meteorological and vegetation indices for evaluation of drought impact: a case study for Rajasthan, India. Nat Hazards. 54(3):643–656.
- Javed T, Li Y, Rashid S, Li F, Hu Q, Feng H, Chen X, Ahmad S, Liu F, Pulatov B., 2021. Performance and relationship of four different agricultural drought indices for drought monitoring in China's mainland using remote sensing data. Sci Total Environ. 759:143530.
- Ji L, Peters AJ. 2003. Assessing vegetation response to drought in the northern Great Plains using vegetation and drought indices. Remote Sens Environ. 87(1):85–98.
- Jiao W, Zhang L, Chang Q, Fu D, Cen Y, Tong Q. 2016. Evaluating an enhanced vegetation condition index (VCI) based on VIUPD for drought monitoring in the continental United States. Remote Sens. 8(3):224.
- Khan N, Sachindra DA, Shahid S, Ahmed K, Shiru MS, Nawaz N. 2020. Prediction of droughts over Pakistan using machine learning algorithms. Adv Water Res. 139:103562.
- Khan R, Gilani H. 2021. Global drought monitoring with big geospatial datasets using Google Earth Engine. Environ Sci Pollut Res. 28(14):17244–17264..
- Kogan FN. 1995. Application of vegetation index and brightness temperature for drought detection. Adv Space Res. 15(11):91–100.
- Kogan F, Guo W. 2015. 2006–2015 mega-drought in the western USA and its monitoring from space data. Geomatics Nat Hazards Risk. 6(8):651–668.
- Kogan F, Guo W, Yang W. 2017. SNPP/VIIRS vegetation health to assess 500 California drought. Geomatics Nat Hazards Risk. 8(2):1383–1395.
- Kogan F, Guo W, Yang W. 2020. Near 40-year drought trend during 1981-2019 earth warming and food security. Geomatics Nat Hazards Risk. 11(1):469–490.
- Kogan F, Guo W, Yang W. 2019. Drought and food security prediction from NOAA new generation of operational satellites. Geomatics Nat Hazards Risk. 10(1):651–666.
- Kogan F, Guo W, Yang W, Harlan S. 2018. Space-based vegetation health for wheat yield modeling and prediction in Australia. J Appl Remote Sens. 12(2):026002.
- Kuri F, Masocha M, Murwira A, Murwira KS. 2020. Differential impact of remotely sensed dry dekads on maize yield in Zimbabwe. Geocarto Int. 35(13):1489–1510.
- Kuri F, Murwira A, Murwira KS, Masocha M. 2018. Accounting for phenology in maize yield prediction using remotely sensed dry dekads. Geocarto Int. 33(7):723–736.
- Kuri F, Murwira A, Murwira KS, Masocha M. 2014. Predicting maize yield in Zimbabwe using dry dekads derived from remotely sensed vegetation condition index. Int J Appl Earth Observ Geoinform. 33:39–46.
- Lawal S, Bruce H, Temitope SE, Ayodeji A. 2021. On the suitability of using vegetation indices to monitor the response of Africa's terrestrial ecoregions to drought. Sci Total Environ. 792(2021):148282.
- Liu WT, Kogan FN. 1996. Monitoring regional drought using the vegetation condition index. Int J Remote Sens. 17(14):2761–2782.
- Magno R, De Filippis T, Di Giuseppe E, Pasqui M, Rocchi L, Gozzini B. 2018. Semi-automatic operational service for drought monitoring and forecasting in the Tuscany region. Geosciences. 8(2):49.
- Manjowe M, Mushore TD, Gwenzi J, Mutasa C, Matandirotya E, Mashonjowa E. 2018. Circulation mechanisms responsible for wet or dry summers over Zimbabwe. AIMS Environ Sci. 5(3):154–172.
- Makarau A, Jury MR. 1997. Predictability of Zimbabwe summer rainfall. Int J Climatol: J R Meteorol Soc. 17(13):1421–1432.
- Maphosa B. 1994. Lessons from the 1992 drought in Zimbabwe. The quest for alternative food policies. Nordic J Afr Stud. 3:53–58.
- Mason S, Lindesay J, Tyson J. 1994. Simulating drought in Southern Africa using sae surface temperature variations. Water SA. 20:15–22.
- Masvaya EN, Nyamangara J, Nyawasha RW, Zingore S, Delve RJ, Giller KE. 2010. Effect of farmer management strategies on spatial variability of soil fertility and crop nutrient uptake in contrasting agro-ecological zones in Zimbabwe. Nutr Cycl Agroecosyst. 88(1):111–120.
- Matthews BW. 1975. Comparison of the predicted and observed secondary structure of T4 phage lysozyme. Biochim Biophys Acta (BBA) Protein Struct. 405(2):442–451.
- Mazvimavi D. 2010. Investigating changes over time of annual rainfall in Zimbabwe. Hydrol Earth Syst Sci. 14(12):2671–2679.
- Mckee TB, Doesken NJ, Kleist J. 1993. The relationship of drought frequency and duration to time scale. In Proceedings of the Eighth Conference on Applied Climatology, Anaheim, California, 17–22 January 1993. Boston, American Meteorological Society, p. 179–184.
- Mikaili O, Rahimzadegan M. 2022. Investigating remote sensing indices to monitor drought impacts on a local scale (case study: Fars province, Iran). Nat Hazards. 111(3):2511–2529.
- Moyo S. 2000. The political economy of land acquisition and redistribution in Zimbabwe, 1990-1999. J Southern African Stud. 26(1):5–28.
- Kourouma JM, Eze E, Negash E, Phiri D, Vinya R, Girma A, Zenebe A., 2021. Assessing the spatio-temporal variability of NDVI and VCI as indices of crops productivity in Ethiopia: a remote sensing approach, Geomatics. Nat Hazards Risk. 12(1):2880–2903.
- Kuri F,Masocha M,Murwira A,Murwira KS. 2020. Differential impact of remotely sensed dry dekads on maize yield in Zimbabwe. Geocarto International. 35(13):1489–1510. doi:10.1080/10106049.2019.1583774.
- Muchadeyi FC, Wollny CBA, Eding H, Weigend S, Makuza SM, Simianer H. 2007. Variation in village chicken production systems among agro-ecological zones of Zimbabwe. Trop Anim Health Prod. 39(6):453–461.
- Mugandani R, Wuta M, Makarau A, Chipindu B. 2012. Re-classification of agro-ecological regions of Zimbabwe in conformity with climate variability and change. Afr Crop Sc J. 20(2):361–369.
- Mupepi O, Matsa MM. 2022. Spatio-temporal dynamics of drought in Zimbabwe between 1990 and 2020: a review. Spat Inf Res. 30(1):117–114.
- Muthumanickam D, Kannan P, Kumaraperumal R, Natarajan S, Sivasamy R, Poongodi C. 2011. Drought assessment and monitoring through remote sensing and GIS in western tracts of Tamil Nadu, India. Int J Remote Sens. 32(18):5157–5176.
- Mutowo G, Chikodzi D. 2014. Remote sensing based drought monitoring in Zimbabwe. Disaster Prev Manage. 23(5):649–659.
- Oladipo EO, Kyari JD. 1993. Fluctuations in the onset, termination and length of the growing season in Northern Nigeria. Theor Appl Climatol. 47(4):241–250.
- Qian X, Liang L, Shen Q, Sun Q, Zhang L, Liu Z, Zhao S, Qin Z. 2016. Drought trends based on the VCI and its correlation with climate factors in the agricultural areas of China from 1982 to 2010. Environ Monit Assess. 188(11):639.
- Quiring SM, Ganesh S. 2010. Evaluating the utility of the Vegetation Condition Index (VCI) for monitoring meteorological drought in Texas. Agric for Meteorol. 150(3):330–339.
- R Development Core Team. 2015. R: A Language and Environment for Statistical Computing. R Foundation for Statistical Computing, Vienna.
- Shoko C, Masocha M, Dube T. 2015. A new potential method to estimate abundance of small game species. African J Ecology, 53(4): 406–412.
- Sierra-Soler A, Adamowski J, Malard J, Qi Z, Saadat H, Pingale S. 2016. Assessing agricultural drought at a regional scale using LULC classification, SPI, and vegetation indices: case study in a rainfed agro-ecosystem in Central Mexico. Geomatics Nat Hazards Risk. 7(4):1460–1488.
- Simba FM, Chikodzi D, Murwendo T. 2012. Climate change scenarios, perceptions and crop production: a case study of Semi-arid Masvingo Province in Zimbabwe. J Earth Sci Climate Change. 3(124):2.
- Singh RP, Roy S, Kogan F. 2003. Vegetation and temperature condition indices from NOAA AVHRR data for drought monitoring over India. Int J Remote Sens. 24(22):4393–4402.
- Tadross M, Suarez P, Lotsch A, Hachigonta S, Mdoka M, Unganai L, Lucio F, Kamdonyo D, Muchinda M. 2007. Changes in growing-season rainfall characteristics and downscaled scenarios of change over southern Africa: implications for growing maize. In IPCC regional Expert Meeting on Regional Impacts, Adaptation, Vulnerability, and Mitigation, Nadi, Fiji, 193–204.
- Törnros T, Menzel L. 2014. Addressing drought conditions under current and future climates in the Jordan River region. Hydrol Earth Syst Sci. 18(1):305–318.
- Tsakiris G, Vangelis H. 2005. Establishing a drought index incorporating evapotranspiration. Eur Water. 9:3–11.
- Twomlow, S.J., Steyn, J.T. and Du Preez, C.C., 2006. Dryland farming in southern Africa. Dryland Agricul. 23:769–836.
- Unganai LS, Kogan FN. 1998. Drought monitoring and corn yield estimation in Southern Africa from AVHRR data. Remote Sens Environ. 63(3):219–232.
- Vasilca D. 2019. How to create an effective thematic map. Bull UASVM Horticulture. 76:258–267.
- Wei W, Zhang J, Zhou L, Xie B, Zhou J, Li C. 2021. Comparative evaluation of drought indices for monitoring drought based on remote sensing data. Environ Sci Pollut Res. 28(16):20408–20425.
- Wilhite DA, Hayes MJ, Svodoba MD. 2000. Drought monitoring and assessment in the U.S. In: Voght JV, Somma F (eds) Drought and drought mitigation in Europe. Kluwers, Dordrecht.
- Wilhite DA, Glantz MH. 1985. Understanding: The drought phenomenon: The role of definitions. Water Int. 10(3):111–120.
- Winkler K, Gessner U, Hochschild V. 2017. Identifying droughts affecting agriculture in Africa based on remote sensing time series between 2000–2016: rainfall anomalies and vegetation condition in the context of ENSO. Remote Sens. 9(8):831.
- World Bank. 2005. Global drought hazard distribution. Zimbabwe: World Bank Zimbabwe.
- Zambrano F, Lillo-Saavedra M, Verbist K, Lagos O. 2016. Sixteen years of agricultural drought assessment of the BioBío region in Chile using a 250 m resolution Vegetation Condition Index (VCI). Remote Sens. 8(6):530.
- Zhang H, Ali S, Ma Q, Sun L, Jiang N, Jia Q, Hou F., 2021. Remote sensing strategies to characterization of drought, vegetation dynamics in relation to climate change from 1983 to 2016 in Tibet and Xinjiang Province, China. Environ Sci Pollut Res. 28(17):21085–21100.