
 ?Mathematical formulae have been encoded as MathML and are displayed in this HTML version using MathJax in order to improve their display. Uncheck the box to turn MathJax off. This feature requires Javascript. Click on a formula to zoom.
Abstract
Few studies of monitoring rocky desertification based on Sentinel-2 MSI image with higher spatial and temporal resolutions have been reported. In this paper, nine typical surface parameters that derived from Sentinel-2 MSI image including three red edge indices have been introduced to establish two types of feature space monitoring index: point-to-line type and point-to-point type. The results show that: (1) The feature of space monitoring index based on Sentinel-2 MSI image has a higher applicability in obtaining rocky desertification information for karst zones; (2) The point-to-line BSI (bare soil index)-NDre1 (red edge index 1)feature space monitoring index of rocky desertification has the best applicability with R2=95.1% and root mean square error (RMSE)=0.872; (3) The feature space monitoring indexes that composed of red edge indices have a higher inversion accuracy, which indicates that the red edge indices are sensitive indicators of the rocky desertification condition and process;(4) The intensive and severe rocky desertification zones are mostly located in the southeast and central parts. The 3-dimensional or multidimensional feature space model will be constructed to improve the inversion accuracy of rocky desertification in further studies. The research results can provide methodological supports for revealing the rocky desertification evolution laws.
1. Introduction
Rocky desertification, the phenomenon of loss of surface soil, bare bedrock, loss of agricultural utilization value and degradation of ecological environment caused by soil erosion, are mainly caused by human activities and special geological structure, namely karst landforms (Han et al. Citation2016). The rocky desertification is widely distributed in southwest China with typical karst landforms that are characterized by huge topographic relief, widely scattered limestone, shallow soil layer and large area exposed bare rock (Sun et al. Citation2022). With the combined actions of global warming and human activities, rocky desertification has become one of the important factors restricting the social, economic and ecological development of these regions. Therefore, dynamic monitoring of rocky desertification is urgent for the high-quality development of ecological environment and social economy in karst mountain regions (Pu et al. Citation2021).
Due to the perfect abilities of fast data acquisition and large area coverage, the satellite images have been applied in researches on land degradation and land cover change (Jiang et al. Citation2014;Shi et al. Citation2019). In recent years, many scholars have applied the image classification method, single index method, and comprehensive index evaluation method to identify and distinguish the scope and spatial distribution characteristics of rocky desertification. According to the vegetation coverage and rock exposure index, Zong et al. (Citation2014) calculated the comprehensive index, and analyzed the spatial and temporal evolution pattern of regional rocky desertification. Tong et al. (Citation2017) established a rock exposure index based on the bands of near infrared and short-wave infrared of Landsat 5 image, and then quantitatively retrieved the rocky desertification information in karst mountainous areas in southwest China. The single index method could be used for rapid monitoring of rocky desertification in large-scale regions. However, on account of the comprehensive influences of natural and human factors, the single index method would not adequately reflect the complex surface features of rocky desertification. Cao et al. (Citation2021) chooses the magnetic susceptibility to link the rocky desertification to soil erosion by identifying soil profiles. In terms of comprehensive index evaluation method, this method could obtain better monitoring accuracy in small scale or specific research area with poor universality, due to the excessive interference of expert experience and knowledge, which also ignored the interactions among different evaluation indices. Zhang et al. (Citation2021) constructed a novel karst rocky desertification index (KRDI) to indicate rocky desertification condition based on greenness, humidity, and brightness. Khalid et al. (Citation2022) found that ectomycorrhizal fungi exhibited a significant differentiation among karst rocky desertification and non- karst rocky desertification sites. Image classification methods, such as human-computer interactive interpretation method, support vector machine method and object-oriented classification method, had been widely applied to access to the rocky desertification information (Yang et al. Citation2020; Lv Citation2021). Li and Wu (Citation2015) utilized the decision tree and fuzzy maximum likelihood methods to verify the potential of Landsat 8 OLI data in monitoring karst rocky desertification. Chen et al. (Citation2021) used a Classification And Regression Tree (CART) to classify the karst rocky desertification. However, these image classification methods are mainly used to define the scope of rocky desertification, and it is difficult to reveal the spatial differentiation patterns within the scope of rocky desertification (Guo et al. Citation2021; Sayl et al. Citation2021; Zhong et al. Citation2021). In recent years, the feature space model has been applied in studies on land degradation based on Landsat images, such as soil salinization and desertification, which proposes a new idea for the study of rocky desertification (Liang et al. Citation2021). In our previous study, a feature space monitoring index based on Landsat8 OLI image has been proposed to survey the rocky desertification in Dafang County, Bijie City (Guo et al. Citation2021). However, the NDVI cannot detect the vegetation condition in bare land or sparse vegetation region. In addition, due to the lower spatial (30 m) and temporal (16d) resolutions of Landsat images, more subtle temporal and spatial variation characteristics cannot be revealed (Guo et al. Citation2022). Moreover, the non-linear relationships among different factors were ignored. The Sentinel-2 MSI images with higher spatial (10 m) and temporal (6d) resolutions can be conductive to detect accurate information for rocky desertification (Ren et al. Citation2020). In addition, the red edge bands are located in the junction of red band and near-infrared band, and the reflectance of vegetation changes rapidly, so that the red edge bands can better indicate various physical and chemical parameters of vegetation (Rim and Makram Citation2020). These bands are important indicators to describe plant pigment state and health status. Therefore, red edge bands can provide a new approach for vegetation state investigation. However, fewer studies that focused on feature space model and Sentinel-2 MSI image have been reported.
The objective of this study is to propose a novel feature space model of rocky desertification based on Sentinel-2 MSI image. In this paper, nine typical surface parameters that derived from Sentinel-2 MSI image including three red edge indices and feature space model have been introduced to establish the monitoring index of different types of rocky desertification, and then the optimum monitoring index would be proposed, the rocky desertification spatial distributions in Dafang District would be ultimately analyzed. The novelty of this work is to comprehensively utilize the red edge bands of Sentinel-2 MSI image and feature space model to improve the inversion accuracy of rocky desertification with higher spatial and temporal resolution than precious studies.
2. Materials and methods
2.1. Study area
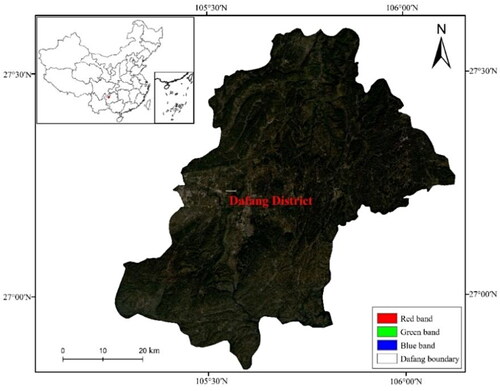
Dafang District is located in the middle and east of Bijie city in the northwest of Guizhou Province (, 105°15'47″∼106°08'04″E, 26°50'02″∼27°36'04″N), which covers an area of about 3505. 21 km2. The topography is lower in the north and south parts. The climate belongs to subtropical humid monsoon and the average annual precipitation reaches 1155 mm. However, the precipitation mainly occurs from April to September, accounting for 78.8% of the total. Plant types are mainly shrubbery and subtropical evergreen broad-leaved forest. The Rivers mainly originate from Chishui river and Wujiang River. The soil types are mainly yellow brown soil, lime soil, yellow soil and paddy soil (Zhang et al. Citation2020). Limestone and dolomite are widely distributed in the southeast parts and karst landforms are well developed (Gordana and Ugur Citation2019).
Figure 1. Location of the study area.
2.2. Data source and preprocessing
Sentinel-2 is a dual-platform multispectral imaging satellite launched by the European Space Agency (ESA), which is composed of Sentinel-2A and Sentinel-2B satellites. The multispectral imager (MSI) contains 13 bands that listed in (Li et al. Citation2021). The spatial resolutions of visible bands to the short-wave infrared bands are 10 m, 20 m, and 60 m, respectively (Ren et al. Citation2020). Three Sentinel-2 MSI images (July, 2020) with the cloud coverage < 5% have been downloaded from the official website of the ESA for Dafang District . Then, Sen2cor, a plug-in specially produced L2A data released by the ESA, had been used for atmospheric correction and the nearest neighbor interpolation method was applied by SNAP software to resample each band to images with the spatial resolution of 10 m.
Table 1. Band information of sentinel-2A and sentinel-2B.
2.3. Methods
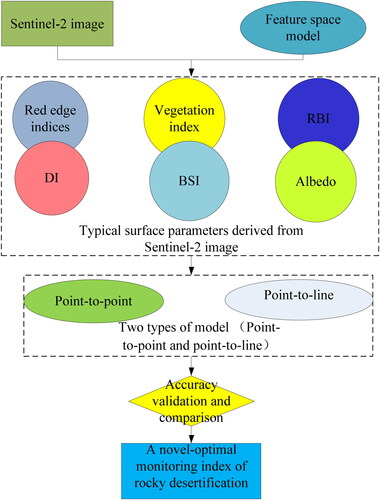
The main research flow diagram can be shown in .
Figure 2. The main research flow diagram.
2.3.1. Principle of feature space model
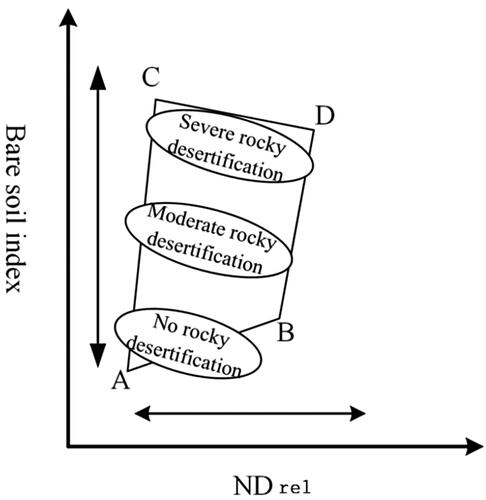
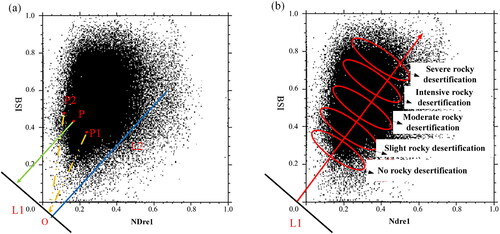
In this study, a feature space model has been introduced to quantitatively monitor the rocky desertification process. Taking BSI (Bare soil index)-NDre1 (red edge index 1) feature space as an example, theNDre1 can reflect more completely the spatial distribution of sparse surface vegetation. As rocky desertification intensifies, the vegetation coverage and its corresponding NDre1 value would decrease accordingly. Therefore, NDre1 can be used as an important indicator for the status and evolution process of rocky desertification (Bhattarai et al. Citation2020). Bare soil index, as an important parameter of surface soil index, varies with the degree of rocky desertification. In zones with severe rocky desertification, vegetation becomes sparser, more rocks and sand are exposed, and the area of bare soil increases significantly. Therefore, NDre1 is significantly negatively correlated with BSI. As shown in , the closer to the AB line, the slighter the rocky desertification would be. On the contrary, the farther away from the CD line, the more serious the rocky desertification (Zhang et al. Citation2021).
Figure 3. Principle of feature Space Model.
2.3.2. Inversion of rocky desertification parameters
Surface albedo (Albedo) plays an important role in regulating ground radiation energy balance, which can be used to determine the amount of ground absorbed radiation energy. The Albedo is on the rise when the rocky desertification aggravates (Zhou Citation2021). Bare rock exposure rate, and surface soil dryness would increase with the intensification of rocky desertification. Therefore, rock bare index (RBI), dryness index (DI) and bare soil index (BSI) have been selected to reflect the evolution process and status of rocky desertification (Guo et al. Citation2021). In severe rocky desertification area, the vegetation is obviously thinning, and there is a significant negative correlation between the vegetation coverage and the degree of rocky desertification. Therefore, the NDVI and MSAVI are selected as important parameters of rocky desertification. In addition, three red edge indices have been retrieved based on red edge bands. The red edge bands can be used to describe the edge of the absorption valley formed by the strong ingestion of chlorophyll by vegetation in the red band, and the sharp increase in the reflectivity between the strong reflection peaks formed by multiple scattering of light by the leaves in the near-infrared band, which can reflect the health status of crops, chlorophyll content and leaf structure information. Therefore, the red edge bands are important information sources for the inversion of vegetation physiological parameters (Lv Citation2021). The calculation formulas of all parameters are shown in . Then, 2 D feature spaces have been produced with 2 D scatter plot of ENVI 5.3 software.
Table 2. Calculation formula of surface parameters.
2.3.3. Index normalization
There are obvious differences among different parameters, so the index normalization should be applied to improve the inversion accuracy.
(1)
(1)
Si is the normalized index of i; Vi refers to the parameter of i; Vi,min refers to the minimum value of the parameter of i; Vi,min refers to the maximum value of the parameter of i.
2.3.4. Verification method
In this paper, we applied the precision index and the basic error matrices to test the inversion accuracy of the results.
(2)
(2)
(3)
(3)
where Gu,i is the user accuracy of inversion category i, GM,j is the cartographic accuracy of field observed category j, n is the number of categories, Fi+ represents the sum of the inversion category i, F+j represents the sum of field observed category j, and Fij represents the number of the inversion category i, and field observed category j that both occur.
2.3.5. Statistical analysis
In this paper, the correlation coefficient and root mean square error (RMSE) that derived from linear regression analysis model (Guo et al. Citation2022) were adopted to validate the inversion accuracy of monitoring index of rocky desertification under the confidential level of P < 0.01.
(4)
(4)
(5)
(5)
Where the Rxy is the correlation coefficient; xi is the value of the ith x variable; yi is the value of the ith y variable; is the average value of x variable;
is the average value of y variable;
is the root mean square error;
is the predicted value of the ith y variable.
3. Results
3.1. Construction of feature space
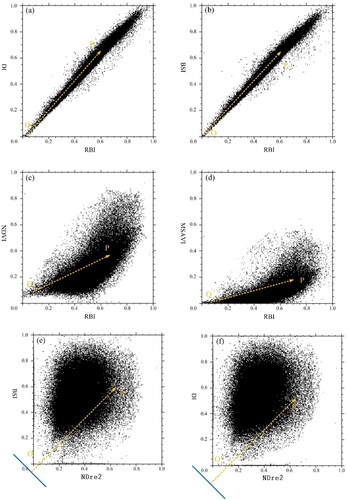
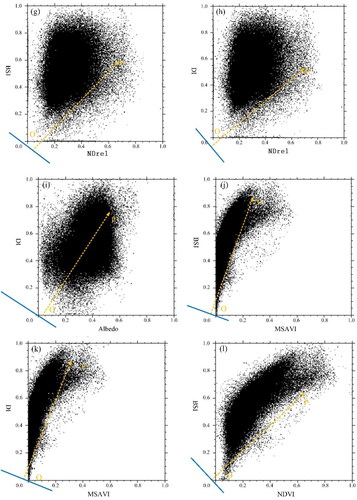
Based on the eco-environmental characteristics and the dominant influencing factors of rocky desertification in Dafang District, this study consulted the above nine typical surface parameters to construct twelve feature spaces. We have preliminarily analyzed the spatial distributions of different point groups for levels of rocky desertification in each feature space. According to the point group distribution and differentiation laws in feature space and the shape of feature space, the twelve feature spaces above were classified into two types: point-to-point type (DI-RBI, BSI-RBI, NDVI-RBI, MSAVI-RBI) and point-to-line type (BSI-NDre2, DI-NDre2, BSI-NDre1, DI-NDre1, DI-Albedo, BSI-MSAVI, DI-MSAVI, BSI-NDVI) ().
Figure 4. Twelve feature spaces of rocky desertification. Point–to-point type :(a) DI-RBI; (b) BSI-RBI; (c) NDVI-RBI; (d) MSAVI-RBI; Point–to-line type: (e) BSI-NDVIre2; (f)DI-NDVIre2; (g) BSI-NDVIre1; (h) DI-NDVIre1; (i) DI-Albedo; (j) BSI-MSAVI; (k) DI-MSAVI; (l) BSI-NDVI.
3.2. Spatial distributions of levels of rocky desertification in feature space
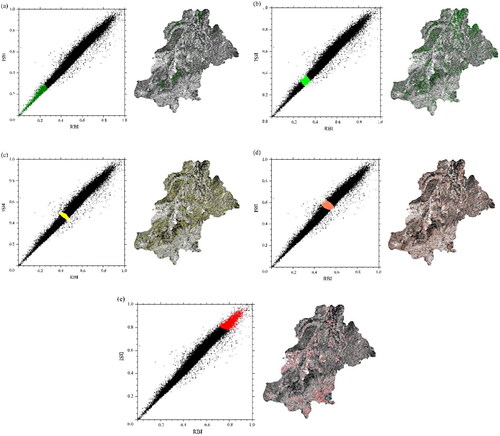
For point-to-point type, this study utilized BSI (bare soil index)-RBI (rock bare index) feature space to explore the spatial distributions of rocky desertification in feature space. In order to analyze the distribution and differentiation law of rocky desertification in feature space, five point sets were selected in this study to explore the corresponding relationships. The rocky desertification degree corresponding to the five point sets were determined by interpretation with Google Earth and field observation data (35 sites). As shown in , the spatial distributions of five point sets corresponding to rocky desertification degree in BSI-RBI feature space were significantly different. The farther away from the origin point (0, 0), the severer the rocky desertification was. The distance from the most severe point sets to the origin point (0, 0) was the farthest, followed by the point sets of intensive, moderate and slight rocky desertification, and the distance from the point sets of no rocky desertification to point (0, 0) was the smallest.
Figure 5. Spatial distribution of rocky desertification in BSI-RBI feature space (a) No; (b) Slight; (c) Moderate; (d) Intensive; (e) Severe.
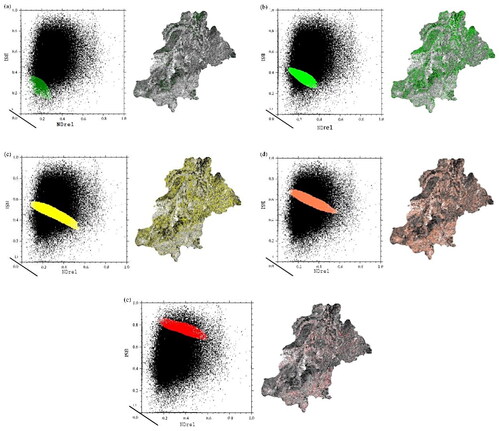
For the point-to-line type, this study took the BSI (bare soil index)-NDre1 (red edge index 1) feature space to show the construction process of the monitoring index. Similar to the point-to-point type, five point sets representing rocky desertification degree were select to analyze the distribution pattern and the corresponding relationship in BSI-NDre1 feature space. showed that, the farther from the line L1, the severer the rocky desertification was. The distance from the point sets of the most severe rocky desertification to the line L1 was the farthest, followed by the point sets of intensive, moderate and slight rocky desertification, and the distance from the point sets of no rocky desertification to L1 was the smallest.
Figure 6. Spatial distribution of rocky desertification in BSI-NDre1 feature space (a) No; (b) Slight; (c) Moderate; (d) Intensive; (e) Severe.
3.3. Construction of rocky desertification monitoring index
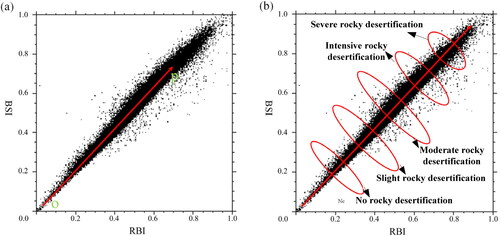
showed that, the farther away from the point of O, the severer the rocky desertification degree. The elliptical section perpendicular to the OP line could effectively discriminate the rocky desertification degrees. Thus, the distance from any point P (x, y) to point O (M, N) in the feature space could be used to reflect the change process and condition of rocky desertification: the farther the distance was, the severer the rocky desertification was. According to the distance formula between two points, the point-to-point rocky desertification monitoring index was as follows:
(1)
(1)
Figure 7. Construction of BSI-RBI feature space monitoring index (point-to-point type).
Where RDI1 refers to the rocky desertification monitoring index, (x, y) refers to the abscissa and ordinate of any point in feature space, (M, N) refers to the abscissa and ordinate of certain point in feature space.
As shown in , by analyzing the distributions of five point sets corresponding to different rocky desertification degrees in BSI-NDre1 feature space, it was found that the distance between point P1 (P1O) and P2 (P2 O) to point O was different. The law of spatial distributions for levels of rocky desertification based on the field observed data was explored. The results showed that the rocky desertification condition of P1, P2, and its surrounding point sets both belonged to moderate level. The distance from any point to certain point O in feature pace could not distinguish the rocky desertification degree. Based on this problem, this study utilized the distance from any point P (x, y) to the L1 line to discriminate the rocky desertification levels. The farther the distance was the severer the rocky desertification was. Elliptical sections parallel to L1 line could indicate different degrees of rocky desertification. L2 is soil line which is perpendicular to L1. In accordance with the point-to-line distance formula, a rocky desertification monitoring index based on point-to-line type was established:
(2)
(2)
Figure 8. Construction of BSI-NDre1 feature space monitoring index (point-to-line type).
RDI2 refers to the rocky desertification monitoring index, while M refers to the slope of L2 line.
3.4. Accuracy verification and comparison
In this study, by utilizing two types of monitoring index, the spatial distributions of rocky desertification were obtained with the tool of Raster Calculator of ArcGIS 10.2. According to the natural breaks method and traditional rocky desertification classification methods (rock exposure rate, vegetation coverage, and lithology), the rocky desertification indices were classified into five categories, namely, no, slight, moderate, intensive, and severe (). In order to verify and analyze the accuracy of different rocky desertification monitoring indices, 260 observed samples from different types of landscape were randomly selected according to visual interpretation of Google Earth’s image () and field trips, followed by the error matrices of inversed rocky desertification index and field observed value were constructed (taking BSI-NDre1 feature space rocky desertification monitoring index as an example, ). As was shown in under the confidential level of P < 0.01, the accuracy of point-to-line BSI-NDre1 feature space monitoring index was the highest of 95.1% with the smallest RMSE of 0.872, followed by that of point-to-line BSI-NDre2 feature space monitoring index (R2=91.9%, RMSE = 1.284), point-to-line BSI-NDre2 feature space monitoring index (R2=90.7%, RMSE = 1.692), and point-to-line BSI-NDre2 feature space monitoring index (R2=89.5%, RMSE = 1.981).The feature space monitoring indices of BSI-NDVI (point-to-line), DI-Albedo (point-to-line) and NDVI-RBI (point-to-point) had lower inversion accuracy with 77.7% (RMSE = 6.984), 74.7% (RMSE = 8.347), and 79.2% (RMSE = 5.964), respectively. The point-to-point BSI-RBI feature space monitoring index had better inversion accuracy with R2= 86.5% and RSME = 2.343. Meanwhile, the average inversion accuracy of the feature space monitoring index that composed of NDre1 was the highest of 91.8%. Moreover, the inversion precision of most previous studies based on single index method and images classification method was less than 90%. Therefore, the red edge indices which were more compatible in reflecting the condition and process of rocky desertification. The point-to-line BSI-NDVre1 feature space monitoring index was the optimal model to detect the rocky desertification information in Dafang District.
Figure 9. Spatial distributions of rocky desertification for different monitoring indices (a) DI-RBI; (b) BSI-RBI; (c) NDVI-RBI; (d) MSAVI-RBI; (e) BSI-NDre2; (f) DI-NDre2; (g) BSI-NDre1; (h) DI-NDre1; (i) DI-Albedo; (j) BSI-MSAVI; (K) DI-MSAVI; (l) BSI-NDVI.
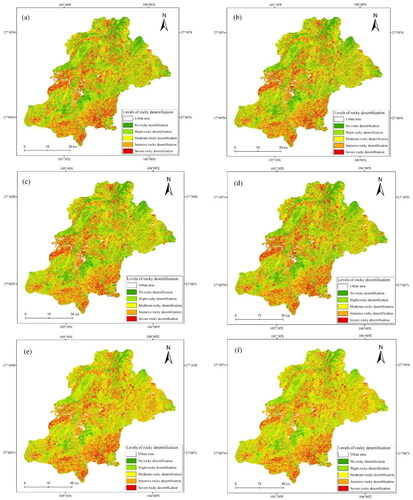
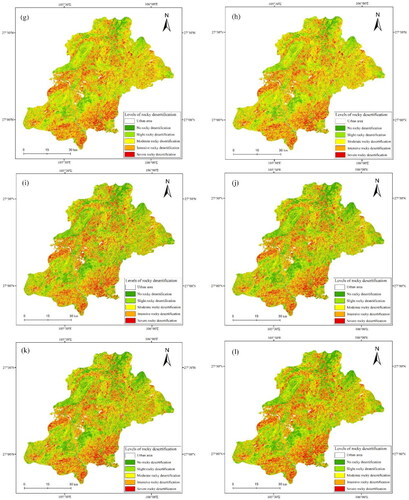
Figure 10. Validation of the inversed rocky desertification index with Google Earth images (BSI-NDre1 feature space monitoring index) (a) No; (b) Slight; (c) Moderate; (d) Intensive; (e) Severe.
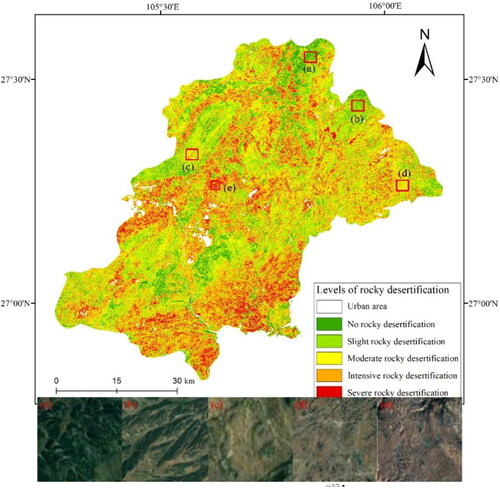
Table 3. Error matrix of the inversed rocky desertification index (BSI-NDre1 feature space) and observed value.
Table 4. Accuracy comparisons of feature space monitoring index based on two types (P < 0.01).
3.5. Spatial characteristics of rocky desertification in Dafang district
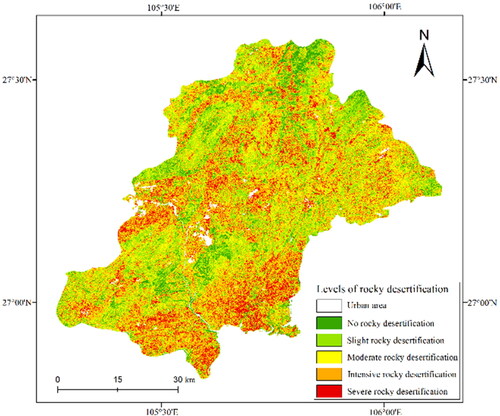
Based on the optimal model of point-to-line BSI-NDre1 monitoring index, the rocky desertification information of Dafang District was obtained (). Zone of severe rocky desertification was mainly located in the southeast and central regions. The moderate rocky desertification zone was the most widely distributed, with an area of about 1023.6 km2, followed by slight and intensive rocky desertification areas, with an area of about 889.0 km2 and 831.6 km2, respectively. The area of severe rocky desertification zone reaches 430.0 km2, while that of non-rocky desertification zone was only 278.7 km2.
Figure 11. Spatial distributions of rocky desertification in Dafang District.
4. Discussion
4.1. Advantage of the novel proposed index based on sentinel-2 MSI image and feature space model
In this paper, the objective of the study is to introduce the red edge indices that derived from Sentinel-2 MSI image to establish a novel-optimal monitoring index of rocky desertification. Sentinel-2 MSI image had the unique red edge bands, which provide more spectral information for surface ecosystem detecting related to the vegetarian (Han et al. Citation2016). The red edge bands describe the edge of the absorption valley formed by the strong absorption of chlorophyll by the vegetation in the red bands, and the sharp increase in the reflectivity between the strong reflection peaks formed by the multiple scattering of light within the leaves in the near infrared band (Xu et al. Citation2022). The red edge index retrieved by the red edge bands can effectively reflect the health status of crops, chlorophyll content and leaf structure information, which is also an important information source for vegetation physiologicization (Arthur et al. Citation2019). Moreover, the feature space model, compared with single index method and comprehensive index evaluation method, is able to analyze the complex influences of multi-factors and nonlinear actions among different surface parameters (Sun et al. Citation2022). In this paper, a novel-optimal feature space monitoring index of rocky desertification has been proposed based on feature space model and red edge indices that derived from Sentinel-2 MSI image. This model with higher spatial and temporal resolution has better applicability in monitoring the quick evolution process of rocky desertification in karst mountainous area.
The results show that the point-to-line BSI-NDre1 feature space monitoring index has the highest accuracy with R2=95.1%, which is better than the result of our previous studies based on Landsat OLI image (93.4%) and other researches (less than 90%) (Guo et al. Citation2021). The main reasons are as follows: (1) The bare soil index has better ability to reflect the surface distributions of rock exposure in karst mountainous area (Zhang et al. Citation2020); (2) Compared with the traditional vegetation index, the red edge index can better reflect the information of crop health status, chlorophyll content and leaf structure, especially in zones with sparse vegetation (Pu et al. Citation2021). The accuracy of point-to-line DI-Albedo feature space monitoring index is the lowest with R2= 74.7%. The reason is that the main terrain in the large area is mountainous and hilly with widely distributed bare land and bare rock. However, the dryness index and albedo have obviously positive relationship, which both have poor ability to distinguish bare soil and bare rock (Zhang et al. Citation2020; Zhou and Huang Citation2020). In addition, this monitoring index has ignored the influence of vegetation, which plays an important role in the process of rocky desertification. The monitoring indices that composed of red edge indices had higher inversion accuracy with R2=91.8% than others. Therefore, the introduction of red edge index based on Sentinel-2 MSI image is of a great significance to investigate the spatial distribution of rocky desertification, which would provide a novel approach to monitor the rocky desertification in karst mountainous areas worldwide.
4.2. Reasons for rocky desertification condition in Dafang district
The severe rocky desertification is mainly concentrated in the southeast and central parts of the Dafang District. In these above regions, the karst landforms are well developed and widely distributed in these parts, which had thin soil layer, shallow bedrock exposure, and strong rainfall erosivity. After abundant of soil and water losses, the rock gradually emerged and exposed, resulting in widely distributed rocky desertification (Zong et al. Citation2014; Guo et al. Citation2020). In addition, the soil layer is thin and the terrain is steep, so that the plant is difficult to grow under poor water and soil environment (Zhu Citation2018). Among the climatic factors, precipitation has the major impact on rocky desertification. Strong rainstorms can easily cause soil erosion. Under the action of rainfall, runoff or other migration forces, soil loss has been intensified, leading to a large area of exposed bedrock, accelerating the weathering rate of carbonate rocks, and thus forming a severe rocky desertification (Zhong et al. Citation2021; Zheng Citation2015). During the past decades, human activities had become a dominant driving factor in the changing process of rocky desertification. Steep slope reclamation and deforestation had greatly led to degradation of vegetation ecosystem. In addition, the eco-environment presented mainly contains low shrubs such as secondary shrubs and trees, and the degradation of vegetation ecosystem is serious . Moreover, the vulnerable ecosystems under the increasing disturbance of human activity are difficult to natural recovery, making the surface soil further eroded. The slight and moderate rocky desertification zones are mainly located in the northeast and west parts. It is because that the eco-environment is characterized by higher vegetation coverage and rich species diversity, and the main types of land use are forest and shrubs (Chen et al. Citation2021). On the other hand, the geological lithology is mainly composed of dolomite and marl, which is not conducive to the formation and evolution of rocky desertification (Wu et al. Citation2021). In addition, the effective implementation of rocky desertification control measures have been conducted, which greatly improved the ecological environment in these regions.
5. Conclusion
On account of the ecological environment characteristics and the complex forming factors of rocky desertification in karst mountainous areas of Southwest China, nine indices, including three red edge indices, which derived from Sentinel-2 MSI image have been selected to construct twelve feature spaces. After analyzing the spatial distributions of levels of rocky desertification in feature space, the rocky desertification monitoring index based on two types of models was established. Combined with the verification data, a novel feature space monitoring index of rocky desertification based on red edge indices that derived from Sentinel-2 MSI image was proposed. The main results were as follows:
The proposed feature space monitoring indices based on Sentinel-2 MSI image had a higher applicability in monitoring rocky desertification with the average accuracy of 85.0%;
The point-to-line BSI-NDre1 feature space monitoring index of rocky desertification had the highest inversion accuracy with R2= 95.1% and RMSE = 0.872;
The red edge indices that derived from red edge bands are conductive to enhance the inversion accuracy of rocky desertification. The monitoring indices that composed of red edge indices have a higher applicability with the average accuracy of 91.8%;
The novel-optimal monitoring index has provided a new approach for detecting the rocky desertification with higher spatial and temporal resolution in karst mountainous area.
The rocky desertification was severe in the southeast and central regions of Dafang District.
However, the evolution process of rocky desertification was always comprehensively influenced by natural factor and human activities. Therefore, the two dimensional feature space models would ignore the interactive actions among multi-type factors. The 3-dimensional or multidimensional feature space model would be constructed to improve the inversion accuracy of rocky desertification in further studies.
Disclosure statement
No potential conflict of interest was reported by the author(s).
Data availability statement
The data that support the findings of this study are available from the corresponding author, Guo B, upon reasonable request.
Additional information
Funding
References
- Arthur B, Bradley Z, Carlson VT, Marc I, Philippe C. 2019. Improved mapping of mountain shrublands using the Sentinel-2 red-ddge band. Remote Sensing. 11(23):2807.
- Bhattarai R, Rahimzadeh-Bajgiran P, Weiskittel A, MacLean DA., 2020. Sentinel-2 based prediction of spruce budworm defoliation using red-edge spectral vegetation indices. Remote Sens Lett. 11(8):777–786. DOI: 10.1080/2150704X.2020.1767824
- Cao ZH, Zhang KL, He JH, Yang ZH, Zhou ZL. 2021. Linking rocky desertification to soil erosion by investigating changes in soil magnetic susceptibility profiles on karst slopes. Geoderma. 358:114949.
- Chen F, Wang SJ, Bai XY, Liu F, Zhou DQ, Tian YC, Luo GJ, Li Q, Wu LH, Zheng C, et al. 2021. Assessing spatial-temporal evolution processes and driving forces of karst rocky desertification. Geocarto Int. 36(3):262–280.
- Chen ST, Guo B, Zhang R, Zang WQ, Wei CX, Wu HW, Yang X, Zhen XY, Li X, Zhang DF, et al. 2021. Quantitatively determine the dominant driving factors of the spatial–temporal changes of vegetation NPP in the Hengduan Mountain area during 2000-2015. J Mt Sci. 18(2):427–445.
- Gordana K, Ugur A. 2019. Evaluating Sentinel2 red edge bands for wetland classification. Proceedings. 18(1):12. DOI: 10.1016/j.catena.2019.03.011
- Guo B, Wei CX, Yu Y, Liu YF, Li JL, Meng C, Cai YM. 2022. The dominant influencing factors of desertification changes in the source region of Yellow River: Climate change or human activity? Sci Total Environ. 813:152512. 2021. 152512.
- Guo B, Zang W, Yang F, Han B, Chen S, Liu Y, Yang X, He T, Chen X, Liu C, et al. 2020. Spatial and temporal change patterns of net primary productivity and its response to climate change in the Qinghai–Tibet Plateau of China from 2000 to 2015. J Arid Land. 12(1):1–17. DOI: 10.1007/s40333-019-0070-1
- Guo B, Zhang DF, Lu YF, Yang F, Meng C, Han BM, Zang WQ, Zhao HH, Wei CX, Wu HW, et al. 2021. A novel-optimal monitoring model of rocky desertification based on feature space models with typical surface parameters derived from LANDSAT_8 OLI. Land Degrad Dev. 32(17):5023–5036.
- Han ZQ, Ran YH, Liu JX, Li J. 2016. The changing distribution of rocky desertification in the Guangxi region, 1930s to 2000. Acta Geograph Sin. 71(3):390–399.
- Jiang ZC, Lian YQ, Qin XQ. 2014. Rocky desertification in Southwest China: Impacts, causes, and restoration. Earth Sci Rev. 132:1–12.
- Khalid M, Tan HX, Ali M, Rehman A, Liu XX, Su LT, Rahman SU, Zhao C, Li XX, Hui N. 2022. Karst rocky desertification diverged the soil residing and the active ectomycorrhizal fungal communities thereby fostering distinctive extramatrical mycelia. Sci Total Environ. 807:151016.
- Li CH, Zhou LZ, Xu WB. 2021. Estimating aboveground biomass using Sentinel-2 MSI data and ensemble algorithms for grassland in the Shengjin lake wetland, China. Remote Sens. 13(8):1595–1595. DOI: 10.3390/RS13081595
- Li S, Wu HG. 2015. Mapping karst rocky desertification using Landsat 8 images. Remote Sens Letters. 6(9):657–666.
- Liang S, Gong Z, Zhao W, Guan H, Liang Y, Lu L, Zhao X. 2021. Information extraction of Baiyangdian wetland based on Multi-season Sentinel-2 MSI images. Remote Sens Technol Appl. 36(4):777–790.
- Lv XY. 2021. Estimation of tobacco chlorophyll content based on sentinel-2 data and vegetation index. Xi'an Univ Sci Technol. 1:35–37.
- Pu JW, Zhao XQ, Dong PL, Wang Q, Yue QF. 2021. Extracting information on rocky desertification from satellite images: a comparative study. Remote Sens. 13(13):2497–2497.
- Ren YX, Lin Q, Li MJ, Zhou Q. 2020. Research on water body extraction of complex area based on Sentinel-2. Geospatial Inform. 18(12):5–99. DOI: 10.3969/j.issn.1672-4623.2020.12.002
- Rim M, Makram A. 2020. Exploitation of the red-edge bands of Sentinel 2 to improve the estimation of durum wheat yield in Grombalia region (Northeastern Tunisia). Int J Remote Sens. 41(23):8986–9008.
- Sayl KN, Sulaiman SO, Kamel AH, Muhammad NS, Abdullah J, Ansari NA. 2021. Minimizing the impacts of desertification in an arid region: A case study of the west desert of Iraq. 46:5580826. DOI: 10.1155/2021/5580286
- Shi PT, Zhang TS, Liu ZQ, Lan JC, Fan X. 2019. A vulnerable environment study in Karst regions between 1991 and 2017: A Bibliometric Analysis. Applied Sciences. 9(24):5339.
- Sun YP, Zhou ZF, Zhao YY, Fang M, Wu Y. 2022. Evolution and distribution pattern of land use and rocky desertification in Karst mountainous area. Res Soil and Water Conserv. 29(1):311–318.
- Tong X, Wang K, Yue Y, Brandt M, Liu B, Zhang C, Liao C, Fensholt R., 2017. Quantifying the effectiveness of ecological restoration projects on long term vegetation dynamics in the karst regions of Southwest China. Int J Appl Earth Obs. 54:105–113.
- Wu HW, Guo B, Fan JF, Yang F, Han BM, Wei CX, Lu YF, Zang WQ, Zhen XY, Meng C. 2021. A novel remote sensing ecological vulnerability index on large scale: A case study of the China-Pakistan Economic Corridor region. Ecol Indic. 129:107955.
- Xu HF, Wang Y, Liu YG, Xiao YX, Li Z. 2022. Analysis of the patial and temporal evolution and driving factors of rocky desertification in typical cluster depression areas in the past 30 years based on Google Earth Engine–taking Xichou county as an example. Res Soil and Water Conserv. 1:1–8.
- Yang DL, Wang ZC, Hu WM, Cao D, Liu H. 2020. Survey of remote sensing image information extraction methods in rocky desertification areas. Safety and Environ Engin. 27(3):133–141.
- Zhang C, Gong ZN, Qiu HC, Zhang Y, Zhou DM. 2021. Mapping typical salt-marsh species in the Yellow River Delta wetland supported by temporal-spatial-spectral multidimensional features. Sci Total Environ. 783:147061–147061.
- Zhang DM, Luo S, Peng CL, An YY, Li YS, Yue LH. 2020. Evaluation and analysis of selenium-rich cultivated land soil resource in Wumeng Mountain area–a case study of dafan county of Guizhou Province. 37(3):281–288.
- Zhang J, Liu ML, Liu XN, Luo WQ, Wu L, Zhu LH. 2021. Spectral analysis of seasonal rock and vegetation changes for detecting karst rocky desertification in southwest China. Int J Appl Earth Obs. 100:102337.
- Zhang ZM, Huang XF, Zhou YC. 2021. Factors influencing the evolution of human-driven rocky desertification in Karst areas. Land Degrad Dev. 32(2):817–829.
- Zheng C. 2015. Current situation and the causes analysis of rocky desertification in Dafang area, Guizhou Province. Chengdu University of Technology. 1:15–16.
- Zhong GS, Hai Y, Zheng H, Xu WH, Ouyang ZY. 2021. Current situation and measures of Karst rocky desertification control in Southwest China. J Yangtze River Sci Res Instit. 38(11):38–43.
- Zhou J, Huang YQ. 2020. On the causes of rocky desertification and comprehensive control measures. Rural Pract Technol. 58:183–184.
- Zhou P. 2021. Remote sensing monitoring of desertification in Naiman Banner based on Albedo-MSAVI feature space. Sci Technol Innov. (32):78–81.
- Zhu LF. 2018. Study on the spatial-temporal variation of vegetation coverage and Karst rocky desertification based on MODIS data. Southwest University. 1:26–28.
- Zong HL, Gan S, Ren PF. 2014. Research on extraction of Karst rocky desertification information in southeastern Yunnan. Value Engineering. 33(10):211–214.