
 ?Mathematical formulae have been encoded as MathML and are displayed in this HTML version using MathJax in order to improve their display. Uncheck the box to turn MathJax off. This feature requires Javascript. Click on a formula to zoom.
Abstract
Drought is probably the most multifaceted environmental disaster that results from a precipitation deficiency. It perhaps has directly and indirectly potential effects on people's lives, the economy, and other environmental resources worldwide. However, for reducing the potential negative impacts of drought, the understanding and information about seasonal drought frequency and persistence are crucial for drought early warning and mitigations policies. Therefore, the current research examines the selected stations' seasonal meteorological drought frequency and persistence. For this purpose, ordinal outcomes of the current research are modelled under the set of cumulative Logit Models (CLM). The estimation of the CLM is made from the logit link function. Further, the Brant Test (BT) is used to check the parallel line assumptions. The BT substantiates that the odds ratios are the same across the several drought classes. Thereby the POM is a ubiquitous choice for the current analysis. Therefore, the Proportional Odds Model (POM) is utilized to compute the odds and Probability of Drought Persistence (PDP) in varying seasons (March, April, May (Spring); June, July, August (Summer); September, October, November (Autumn); December, January, February (Winter). Further, Standardized Precipitation Index (SPI) for a certain time scale (i.e. three-month time scale SPI-3) is mainly utilized in POM. Amid SPI and various seasons, the relationship is found significant at a 5% significance level in various stations, including Murree, Rawalpindi, Sialkot, Sargodha, Faisalabad, Bahawalnagar, Bahawalpur, Mianwali, Jhelum Multan, Khanpur, and Lahore. The potential of the current research is substantiated by twelve meteorological stations in a certain province of Punjab, Pakistan. The current research outcomes provide the direction to dynamically identify the spatial interseasonal propagation of meteorological drought. Moreover, the obtained results can be helpful in making useful policies for the early warning system, drought risk assessment, and management, and formulating the drought-reducing plans.
1. Introduction
Drought is a complicated phenomenon and one of the most frequent natural catastrophes (Kaniewski et al. Citation2015; Meza et al. Citation2020; Yisehak and Zenebe Citation2021; Long Citation2021; Hereher et al. Citation2022; Khanmohammadi et al. Citation2022; Uwimbabazi et al. Citation2022). It has wide-ranging direct and indirect, often severe impacts that trigger widespread shortfalls in various sectors, including agriculture sectors (Beguería et al. Citation2014; Salmoral et al. Citation2020; Rodziewicz and Dice Citation2020; Iese et al. Citation2021; Rojas Citation2021; Harishnaika et al. Citation2022; Savari et al. Citation2022; Goodwin et al. Citation2022) natural ecosystems (Raev and Rosnev Citation2018; Deng et al. Citation2020; Orimoloye et al. Citation2021; Wu et al. Citation2022) and forestry (Schuldt et al. Citation2020; Bose et al. Citation2020; Fu et al. Citation2021). Its impacts are gradually spread in an area over certain intervals and may continue for an extended period. In severe effects, drought can last for several years and unsettle agricultural sectors, socio-economic sectors, and human social activities (Beguería et al. Citation2014; Gidey et al. Citation2018; Abdel-Ghany et al. Citation2020; Marchionni et al. Citation2020; Balti et al. Citation2020; Savari and Shokati Amghani Citation2021; Rojas Citation2021; Savari et al. Citation2022; Wang et al. Citation2022). In the scientific community, the authors have been categorizing drought into four major types, including meteorological, agricultural, hydrological, and socio-economic (Wilhite Citation2000; Fraser et al. Citation2013; Ziolkowska Citation2016; Zhao et al. Citation2019; Arabameri et al. Citation2021; Harishnaika et al. Citation2022).
Meteorological Drought (MD) can be defined as a shortage of precipitation in a prolonged period (Chang and Kleopa Citation1991; Wilhite Citation2000; Estrela and Vargas Citation2012; Yisehak and Zenebe Citation2021; Long Citation2021). Agricultural drought can be referred to as a certain condition where the lack of moisture in the soil limits the growth of a specific crop and triggered a huge loss in wheat yield (Iese et al. Citation2021; Rojas Citation2021). MD is associated with the agricultural drought through several facets, for example, rainfall scarcity, a departure from normal meteorological factors such as evapotranspiration, soil moisture deficiency, and decreased groundwater level (Rodziewicz and Dice Citation2020; Iese et al. Citation2021; Rojas Citation2021). Moreover, the hydrological drought arises when the insufficiency of precipitation causes insufficient surface or subsurface water resources, such as less than normal streamflow, reservoir level, and groundwater level (Clausen and Pearson Citation1995). The prolonged shortage of precipitation (referred to as hydrological drought) can be severe for varying sectors. The impacts of hydrological drought on basins or watersheds are the determining factors of its severity. Indeed, the affected hydrological components need huge supplies and time for their restoration (Clausen and Pearson Citation1995). The socio-economic drought is linked to the inadequacy of water resources systems and is associated with the supply and demand of specific economic goods and services in drought situations (Marchionni et al. Citation2020; Abdel-Ghany et al. Citation2020; Savari and Shokati Amghani Citation2021; Zhang et al. Citation2022). Further, in a socio-economic drought, the water supply is ineffectual in providing adequate water at a specific time to society.
Several indices have been employed in several scientific publications to describe the severity of the distinct type of droughts. For example, Van Rooy (Citation1965) developed a Rainfall Anomaly Index (RAI) that identifies different drought classes in the selected area. Palmer (Citation1965) had given a new index, namely the ‘Palmer Drought Severity Index’ (PDSI), which measures the cumulative deviation of moisture supply to monitor drought more accurately. Palmer (Citation1968) employed Crop Moisture Index (CMI) to increase the effectiveness of drought monitoring in the selected region. Moreover, Bhalme and Mooly Drought Index (BMDI) was developed by (Bhalme and Mooley Citation1980), Surface-Water Supply Index (SWSI) added by Shafer and Dezman (Citation1982), Weghorst (Citation1996) introduced Reclamation Drought Index (RDI), Gommes and Petrassi (Citation1996) proposed National Rainfall Index (NRI) and McKee et al. (Citation1993) have developed Standardized Precipitation Index (SPI). SPI has been prevailing and used in various scientific research for drought monitoring and forecasting (Nalbantis and Tsakiris Citation2009; Mlenga et al. Citation2019; Niaz et al. Citation2021a; Niaz et al. Citation2021b; Niaz et al. Citation2021c). The observed precipitation is quantified (standardized) by using SPI. The standardized values can be used to compare droughts in different climatic areas across regions. Hence, the SPI is often used to develop new approaches for evaluating and monitoring drought occurrence (Zhang and Jia Citation2013; Caloiero and Veltri Citation2019; Yisehak and Zenebe Citation2021; Zarei et al. Citation2021; Moghimi and Zarei Citation2021).
Further, the time of onset and the termination of drought events are complex; hence it is unpredictable to envisage the beginning and end of the drought incidences (Stephan et al. Citation2021; Liu et al. Citation2021; Hamdy and Trisorio-Liuzzi Citation2001). This triggers a gap for new methodologies (Mirakbari et al. Citation2010; Gazol et al. Citation2020; Sabagh et al. Citation2019; Stephan et al. Citation2021; Liu et al. Citation2021; Dikshit et al. Citation2022). Therefore, several methods have been proposed to monitor and envisage drought occurrences (Ragab and Hamdy Citation2004; Gidey et al. Citation2018; Stephan et al. Citation2021; Fooladi et al. Citation2021; Dikshit et al. Citation2022). The continuous development in the drought monitoring policies brings substantial advances to society, assists in minimizing negative drought impacts, and gives significant results for drought early warning systems and mitigation policies (Balti et al. Citation2020; Gazol et al. Citation2020; Savari and Shokati Amghani Citation2021; Chen et al. Citation2022). Moreover, to decrease the potential negative impacts of drought, knowledge about seasonal drought frequency and persistence are crucial for drought early warning and mitigations policies. The knowledge of drought characteristics and persistence is essential for drought planning, mitigation, and response (Peng et al. Citation2002; Ford and Labosier Citation2014). It also enables decision-makers to classify and decrease susceptibility to drought. Therefore, the current study examines the selected stations' seasonal MD frequency and persistence. For this purpose, the Standardized Precipitation Index (SPI) with a certain time-interval (i.e. the three-month time scale, SPI-3) is used to characterize MD. Further, the Proportional Odds Model (POM) is employed to compute the odds and Probability of Drought Persistence (PDP) in the latest (current) season given the prior season's information (i.e. SPI values). The potential of the present study is validated on twelve meteorological stations in the province of Punjab, Pakistan. The outcomes related to the current analysis provide relevant information for understanding drought risk, making drought monitoring, and mitigating strategies.
2. Material and methods
2.1. Description of the study area
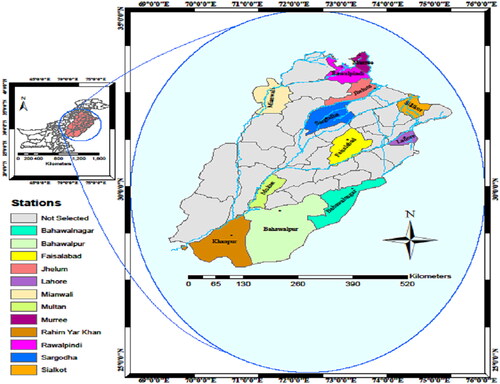
The stations of the province of Punjab in Pakistan are chosen for the current analysis. The structural importance of the Punjab province is vital for the other regions of the country. Most of the industries are working in this province. The industries of this province contribute up to 24% of the province's product. The selected province also plays a substantial role in the reservoirs system and the agriculture sectors of the country. The climatological characteristics of the province significantly affect the irrigation of the agriculture sector throughout the country. Therefore, the other parts of the country depend on the climatological characteristics of the province of Punjab (Tariq et al. Citation2018; Syed et al. Citation2021). Hence, this province's fluctuations in climatic characteristics are important to be recognized (Nawaz et al. Citation2019). Moreover, data of the twelve meteorological stations are selected for the analysis from this province based on the historical availability of time-series data. There is sufficient data available in selected meteorological stations that help effectively to characterize and monitor drought hazards (see ). In the last recent decade, global warming has been spreading worldwide, occurring in Pakistan, and affecting water and temperature and decrease in precipitation (Ahmed et al. Citation2018; Tariq et al. Citation2018; Khan et al. Citation2020; Mazhar et al. Citation2020; Syed et al. Citation2021). This Climate variability, such as a decrease in precipitation, increased temperature, and fluctuation in humidity, caused the unsustainability of Punjab, Pakistan, and negatively impacts natural resources, agriculture sectors, and the economic sectors (Tariq et al. Citation2018; Syed et al. Citation2021). Therefore, it is important to monitor drought characteristics by getting information about seasonal drought frequency and persistence in the selected stations.
Figure 1. Geographical locations of the chosen stations.
2.2. Data and methods
The time-series data ranging from January 1971 to December 2017 for twelve meteorological stations in the province of Pakistan is used for the analysis (Niaz et al. Citation2020a). These stations are selected due to extensive climatological features that help effectively to characterize and monitor drought hazards (Niaz et al. Citation2020b). Drought hazards sustain for several periods (months or even years), and affect large areas and huge amounts of individuals, with single drought incidence sometimes triggering economic losses of several billion rupees. With global warming, drought is gradually threatening Pakistan. Besides the environmental damages, drought can affect ecosystems and threaten food security in the country (Ahmed et al. Citation2018; Khan et al. Citation2020; Mazhar et al. Citation2020). To lessen drought impacts, drought risk assessments must be appropriately executed to help policymakers and water managers improve coping strategies and drought management strategies. Therefore, it is mandatory to pay greater attention to identifying the drought occurrences more immediately by adding enhancements to the drought monitoring techniques and methods. In this regard, SPI-3 is used to characterize MD. In addition, the current study examines the seasonal MD frequency and persistence in the studied stations. Further, POM is used to compute the odds and PDP in the selected stations from one season to the next. The outcomes of the current analysis deliver the path to identify spatial patterns of seasonal frequency of drought and its persistence and help make crucial policies for the early warning system, drought risk assessment and management, and prepare the drought-reducing plans.
2.2.1. Standardized precipitation index (SPI)
The SPI is used for the drought characterization. McKee et al. (Citation1993) developed SPI to monitor meteorological drought. The SPI can be assessed through varying regions with markedly distinct climates (Chang and Kleopa Citation1991; Estrela and Vargas Citation2012; Zarei Citation2019; Niaz et al. Citation2021e; Niaz et al. Citation2021f). SPI calculates perceived precipitation as a standardized departure from a chosen probability distribution function that models the raw precipitation data. SPI's simplicity and flexibility make it the most widely used index to characterize meteorological drought on a range of timescales (Bloomfield and Marchant Citation2013; Caloiero and Veltri Citation2019; Yisehak and Zenebe Citation2021; Long Citation2021). The potential of SPI to be assessed on several timescales permits its applicability to the numerous applications. Further, the SPI is associated with soil moisture at short timescales, while the SPI can be related to groundwater and reservoir storage at longer timescales (Clausen and Pearson Citation1995; Nalbantis and Tsakiris Citation2009). Further, the SPI involves an appropriate transformation technique that is employed for standardizing the preferred cumulative density function, and entire vectors numerically comprising the time series data based on the probability plotting formulas. Therefore, transformation procedure of SPI is implemented as follows,
(1)
(1)
For
When
(2)
(2)
(3)
(3)
And for
When
(4)
(4)
Where
2.2.2. Proportional odds model (POM) for ordered drought categories
Several studies utilized a logistic regression model for envisaging the logit transformation of the dependent (response) variable based on the independent variables (Kutner et al. Citation2005; Ford and Labosier Citation2014; Bachmair et al. Citation2017; Meng et al. Citation2017). However, in most cases, the dependent variable can be classifying into more than two categories (McCullagh Citation1980; Siadaty and Shu Citation2004). It is important to use another technique to predict these categorical variables. In the present study, the dependent variable has five categories (‘extremely dry, severely dry, median dry, normally dry, and no drought’) that are assembled ordinally. Then, a distinctive approach is to use the standard ordered logit model. There is various kind of ordinal models; however, the cumulative Logit Models (CLM) are frequently used (Lee Citation1992; Chen Citation2012). Several structures of modelling have been using in various research to predict the ordered dependent variable. However, the CLM is frequently selected for analysis in various applications due to its straightforwardness (Lee Citation1992; Chen Citation2012). Usually, the models are chosen based on their interpretability and convenient mathematical properties. The regression models under the set of CLM are easily interpretable and convenient in mathematical properties. Therefore, to analyze the ordinal data the models under the set of CLM are preferred in literature (Christensen Citation2015; McKinley et al. Citation2015; Liu et al. Citation2017; Badade and Ramanathan Citation2020). The computation of the CLM can be accomplished from the logit link function. Similar to other types of models, in the CLM one class is selected as the reference class; generally, the class of highest quantity is chosen as the reference class. Furthermore, based on the assumption of parallel lines the CLM allows to use of varying categories (Non-Proportional Odds Model (NPOM) and POM, etc.). When the dependent variable is ordinal, and the parallel lines assumption holds then the use of POM is ubiquitous (McCullagh Citation1980; Siadaty and Shu Citation2004; Chen Citation2012; Christensen Citation2015; McKinley et al. Citation2015; Liu et al. Citation2017; Badade and Ramanathan Citation2020). Moreover, when the dependent variable is ordinal, and if the parallel lines assumption doesn’t hold then the NPOM is employed for the analysis. The NPOM allows the regression parameters to vary with respect to the level of the response. Furthermore, Partial Proportional Odds Model (PPOM) allows for the mixture of POM and NPOM variables to be comprised (Peterson and Harrell Citation1990; Akbar et al. Citation2020). However, to substantiate the parallel line assumptions the BT is mainly employed. The insignificant BT for parallel line assumptions approves that the odds ratios are the same across the several drought classes. Therefore, in the current research the POM of the CLM is utilized to estimate the odds and PDP. In the current analysis, the SPI-3 is calculated as an ordinal variable: ‘extremely dry = 1, severe dry = 2, median dry = 3, normal dry = 4 and no drought = 5’. The drought persistence can be estimated to describe the effect of the change of one season's moisture conditions on moisture conditions in the upcoming season (Ford and Labosier Citation2014). More specifically, in the current setting, five drought categories ( are considered. The proportional odds assumption doesn't mean the same odds across the categories. However, it means the proportional odds assumption confirms that the odds ratios across all
categories are the same. BT used to test parallel lines assumption. The insignificant BT (
) for parallel line assumptions confirms that the odds ratios are the same across the varying drought categories
Since the BT is insignificant, therefore, the POM of the CLM is used to evaluate the odds and PDP. The Maximum Likelihood Estimation (MLE) method is employed to evaluate the POM. The general form of POM is provided in EquationEq. (5)
(5)
(5) .
(5)
(5)
Where unknown parameter's estimator for threshold is denoted by the vector of the explanatory variable is denoted by
shows model coefficient parameter (i.e. intercept and slope). The slope parameter will have remained constant across the various drought categories. Moreover, the model can be transformed by calculating the natural logarithm of the odds ratio, and the linear form is given in EquationEq. (6)
(6)
(6) .
(6)
(6)
POM is based on an ordinal dependent variable of a specific season, and the explanatory (independent) variable (i.e. the preceding season’s values of the SPI) . The model results can be demonstrated for the specified season as the Log Odds Ratio (OR) of drought incidence. Further, the connection (relationship) between the independent and dependent variables is denoted by the β (slope) of the POM. For example, when the β is perceived as negative for any drought category, that means in the particular season the odds of drought incidence are negatively associated with the preceding season’s SPI value. It can be explicitly defined as the increment in the previous season's SPI will decline the odds of drought happening in that season.
Moreover, in current study, the SPI-3 is used to characterize varying drought categories in selected stations (). Further, the Seasonal Drought Frequency (SDF) for varying drought categories is calculated for selected stations. For example, the SDF for Normal Dry (ND) is computed as the over-all number of years in which drought SPI > −1 and SPI < = 1 executes in respectively climate division of the designated stations. Accordingly, the SDF for other drought categories can be calculated. Further, the climate divisions include: ‘(1) December, January, February (Winter); (2) March, April, May (Spring); (3) “June, July, August” (Summer); (4) September, October, November (Autumn)’ (Ford and Labosier Citation2014; Niaz et al. Citation2021d). For example, if the climate presents 9 years in which drought occurs in winter during the total number of 47 years, the drought frequency probability is 9/47 or 19%. The seasonal drought persistence (SDP) shows drought conditions (states) that stay from prior seasons to the forthcoming seasons. In the present study, drought persistence is described as ‘winter-spring’, ‘spring-summer’, ‘summer-autumn’, and ‘autumn-winter’. Further, the SDP and the seasonal drought combination can be defined as the probability of persistence in selected stations. The PDP is evaluated as the total number of years with drought persistence from one season to season combination and divided by the total number of years in which drought arises during the first season in that climate division. For example, if in the climate 10 years in which ND exists in winter and continues into spring during the 8 of those years, the ND persistence probability is 8/10 or 80%.
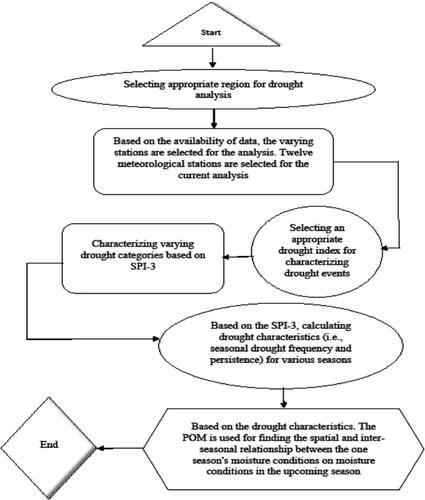
Figure 2. Flowchart of the current methodology is provided. The present research is validate to the several stations. The stations of the provine Punjab is chosen for the analysis. The selction of the province is based on the importance of the region to the other parts of the country. Various industrial good and services are linked with the studied region. Several reseririor system of the country associate with the current region. Several publications have been studying this region for drought analysis (Niaz et al. Citation2020b; Niaz et al. Citation2021a). Based on the significant attraction and importance for the country of the studied region, therefore, the current analysis is made and validated on province Punjab of Pakistan. Further, Based on sufficient requirement of the data set for the SPI calculation, the current analysis is perfomed to the twelve meterological stations. The stations have major role to the agriculture sector of the country. Hence, these statons are examined for the analysis. The SPI-3 is utilized for classifying seasonal MD frequency and persistence. The POM is employed to compute the odds and (PDP in varying seasons.
3. Results
Drought is a complex phenomenon, and the negative impacts of drought affect agriculture, economic structure, other living organisms, and social activities. The prolonged time persistence of meteorological drought can be hazardous for evapotranspiration and soil moisture. The prolonged time persistence can be led to other types of drought (i.e. agriculture and hydrological). Further, knowledge regarding the SDF and SDP in varying seasons is important specifically for developing agricultural and water management policies (Payab and Türker Citation2019; Ayantobo and Wei Citation2019; Puletti et al. Citation2019; Raev and Rosnev Citation2018; Deng et al. Citation2020; Orimoloye et al. Citation2021). Therefore, the current study initiates to explicitly investigate the characteristics of MD including its frequency and its persistence in several meteorological stations. For this purpose, the current analysis uses data from twelve meteorological stations in Punjab. The selected stations carry monthly precipitation data from January 1971 to December 2017. The characteristics of the precipitation observed in various stations is presented in . Further, the observed precipitation at Faislabad station is given in . The precipitation of other stations can be provided. To observe the seasonal MD the SPI-3 is applied to mark MD. The SPI-3 values are standardized by using various probability distributions. These probability distributions are chosen based on Bayesian Information Criterion (BIC). The distributions with minimum BIC values in various stations are selected for standardization. Thereby, based on BIC varying distributions are selected in defined stations. The histograms (Theoretical versus (vs.) empirical) of the required distributions are presented for SPI-3 in . The selected distributions and BIC values corresponding to these selected distributions are given in . For example, the Gamma distribution shows suitable candidacy for Bahawalpur, Mianwali, Multan, and Sargodha stations at SPI-3. The BIC of Gamma distribution of these stations is −1477.893, −947.61, and −964.933, −1580.46, respectively. These BIC values were minimum among other distributions. Therefore, the Gamma distribution was used for the standardization in these three stations. Further, the 3p Weibull distribution shows suitable candidacy for Bahawalnagar, Faisalabad, and Kanpur with minimum BIC values of −904.601, −1282.26, and 863.462, respectively. The Johnson SU distribution has minimum BIC values for Jhelum and Sialkot. The BIC value of Johnson SU distribution for Jhelum station is −1168.448, and for Sialkot, BIC is −1179.503. The observations in Lahore are standardized by the log-normal distribution and so forth.
Figure 3. The characteristics (maximum, standard deviation) of the precipitation observed in various stations.
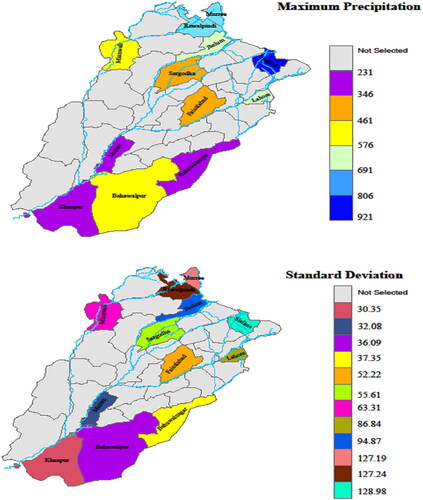
Figure 4. Several histograms for SPI-3 are provided for the selected stations.
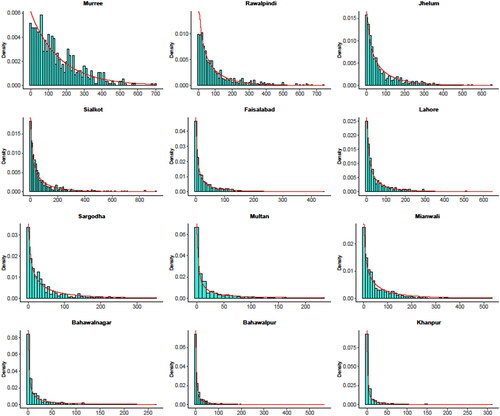
Table 1. Observed precipitation in Faisalabad station on varying months of the specific years.
Table 2. The selected probability distributions of SPI-3 and their BIC values for selected stations.
Moreover, after the standardization, the SPI-3 values are classified for varying drought categories. The classification criteria of these selected drought categories were discussed in (Niaz et al. Citation2020b). The obtained numerical classified SPI-3 values at January for some specific years are provided in . gives quantity values of SPI-3 at February for varying stations on selected years. Further, the quantity values of SPI-3 can be provided for all selected time series data accordingly. Furthermore, temporal behaviour on varying stations can be observed from . These features of SPI-3 can be perceived from . The numerical characteristics of SPI-3 in all selected stations are presented in . Moreover, the outcomes obtained from the current analysis related to spatial drought features are presented on several maps and the temporal behaviour of meteorological drought is shown in varying graphs. presents the counts of drought categories at various seasons and stations. These count plots show that several drought categories have appeared in varying seasons in the chosen stations. The ND class is observed as prevalent among other drought classes in numerous seasons of the chosen stations. The range of SPI > −1 and SPI < = 1 appears in any month considering the ND occurrence. Since the ND is available at various seasons and selected stations. Therefore, the ND is selected for the presentation; however, the results of other drought categories can be presented accordingly. gives the temporal discrepancy for the numbers of months/year in arrangement with SPI > −1 and SPI < = 1 (ND). shows that the entire number of months of classification with SPI > −1 and SPI < = 1 in every year varies from 5 to 11 months by an average of 7.6809 in Rawalpindi station from the specified time series data. Whereas at Mainwali, the number of months with a classification threshold of SPI > −1 and SPI < = 1 in each year fluctuates from 7 to 12 months by an average of 8.4255. Further, based on the same rationale the average months for ND and other drought classes on other designated stations are calculated accordingly. Moreover, the frequency of ND in a specific season is assessed by the overall number of months with a specific threshold (i.e. SPI > −1 and SPI < = 1) divided by the entire number of months in the selected period (). It means that the percentage of seasons in which ND with its threshold appears over the entire researched period (i.e. ‘from January 1971 to December 2017’) for ‘winter, spring, summer, and autumn’, respectively. The Seasonal Drought Frequency (SDF) for other drought categories is calculated accordingly for winter, spring, summer, and autumn.
Figure 5. The temporal plots for SPI-3 at selected stations.
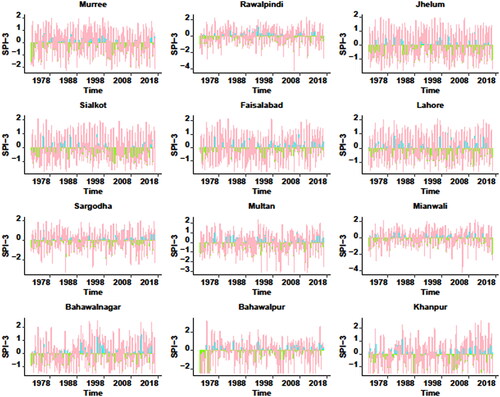
Figure 6. The features (mean, standard deviation) of the SPI-3 in various stations.
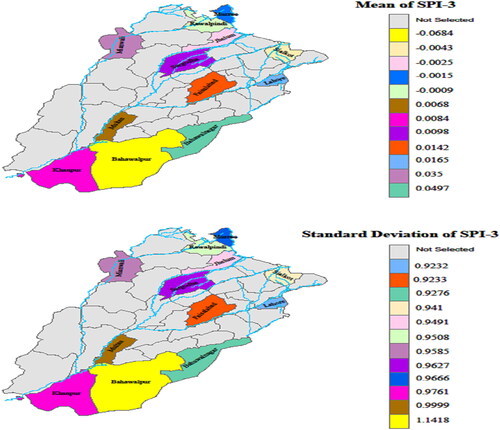
Figure 7. The total number of counts is presented for various drought categories in the selected stations for SPI-3 in different seasons.
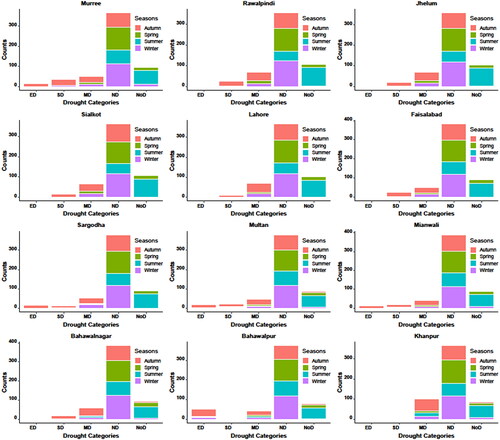
Figure 8. Time series plot: Temporal behavior of ND in selected stations.
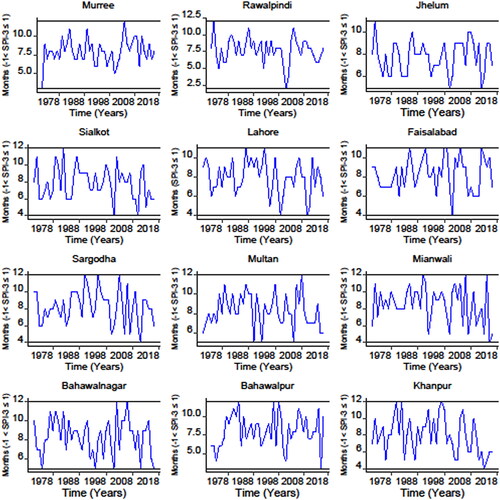
Figure 9. The behavior of ND is presented in this figure. Accordingly, the behavior of other drought categories can be presented.
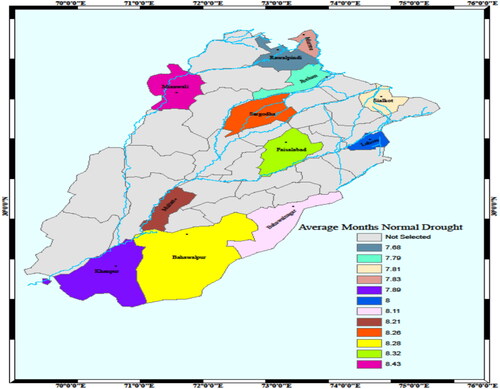
Figure 10. SDF of ND for each chosen station as a percent of total (1971–2017) years. To avoid the presentations of multiple figures based on the same rationale. In the current study, the SDF of ND is only presented here, however, frequency in various seasons for other drought conditions can be presented accordingly.
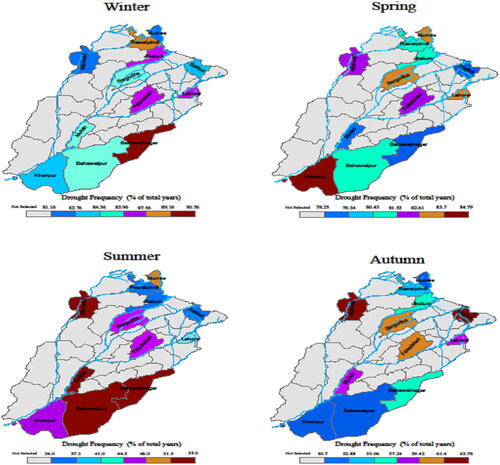
Table 3. Observed SPI-3 values for January varying stations in the specific years.
Table 4. Observed SPI-3 values for Feburary in varying stations in the specific years.
Table 5. The average precipitation was observed in selected stations.
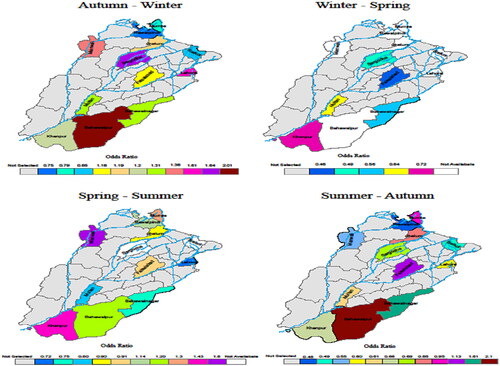
Further, the drought persistence can be estimated to consider the effect of changing one season's moisture ambiance on the forthcoming season (Ford and Labosier Citation2014; Meng et al. Citation2017; Niaz et al. Citation2021d). In the present study, the SDP is stated as the PDP and calculated as the entire number of years in which a specific drought condition continues from one season to another divided by the total years in which the particular condition of drought appears throughout the first season. The probability maps in show the stations with prolonged normal meteorological drought (ND). For example, PDP a of 93.18% in autumn-winter means that 93.18% of autumn ND in nominated stations of the province Punjab of Pakistan can propagate to the winter. It is reflected that there are significant spatial variations in SDP. A larger amount of variation can be observed in numerous seasons and stations. In the Sialkot station, the PDP in spring-summer is lower than in other stations. PDP in spring-summer and summer-autumn has given a very similar pattern among the designated stations. This advocates that in these specific seasons, the occurrence of precipitation is not adequate in the selected stations. Further, the PDP in certain stations during summer- to autumn is greater than in other specified seasons. Furthermore, the POM is employed to calculate the odds and PDP from one season to the next in the chosen stations by discovering the spatial pattern of SDF and SDP. The POM is employed for varying seasons in the designated stations to examine odds for drought incidences in the present season based on the SPI values of the prior season. The SDP odds ratios and outputs from the POM are available in numerous maps in . The drought incidence OR changes as a function of a 1 unit add to the preceding season's value of SPI. The studied stations with an OR < 1 signify declines in OR of drought incidence in the given season when the SPI of the preceding seasons rises, while the studied stations which have OR >1 demonstrate a positive rise in the OR of drought incidence in the specified season when prior season's SPI increases. Further, the significant OR can be assessed in the varying maps. The studied stations are outlined in bolded where the estimates of POM fit are statistically significant at a 5% level of significance. For example, at Rawalpindi station in spring to summer, the OR is significant. It specifies that as gains 1 unit in the SPI of autumn the odds of drought incidence will decrease in winter by 0.4891% to < 1%. Further, the connection between several seasons and SPI can be observed negatively in selected stations. The negative relationship means enhancing a 1 unit in the SPI the odds of drought occurrence will be negatively influenced. These findings efficiently work for early warning systems and policymakers to improve drought monitoring and forecasting capabilities. Furthermore, none of the authors in previous research have used POM to find the odds and PDP from one season to the next by identifying the spatial pattern of SDF and SDP. Therefore, it is a new approach in terms of spatial patterns of drought persistence using POM.
Figure 11. PDP percentage for all seasons in the selected stations. The ND drought condition is only selected for the presentation. The behavior of ND persistence in selected stations can be observed from the spatial map.
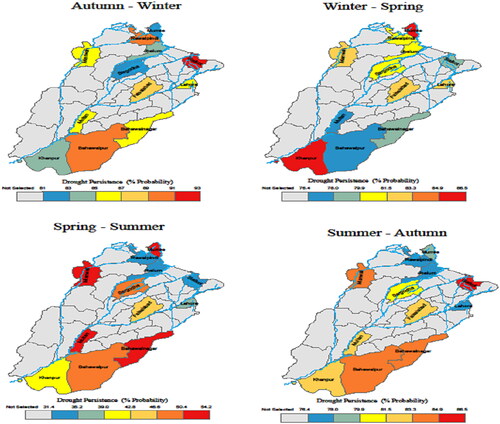
Figure 12. Odds Ratios for varying drought categories in various seasons of the selected stations. Since we used POM to evaluate the odds and probability of drought persistence from one season to the next in the chosen stations by understanding the spatial pattern of seasonal drought frequency and persistence. Therefore, the odds ratios in various drought categories remain the same. Thus, a single odds value represents all drought categories in a specific station and season. The relationship between the drought persistence of the current season to the SPI value of the previous season in the bolded stations is significant.
4. Discussion
The drought persistence can be estimated to describe the effect of the change of one season's moisture conditions on moisture conditions in the upcoming season. The POM is mainly based on the SPI-3. The SPI-3 is used for the classification in the current study. The drought persistence can be assessed to define the impact of the change of one season's moisture conditions on moisture conditions in the upcoming season (Ford and Labosier Citation2014). Recently, Niaz et al. (Citation2021d) used Logistic Regression (LR) to assess the influence of the variation of one season's moisture conditions on moisture conditions in the forthcoming season. They used SPI-3 for the spatial pattern of drought persistence at the regional level. The LR was applied to the six meteorological stations in the Northern zones of Pakistan. The LR only considered two drought categories (i.e. drought and no drought) (Ford and Labosier Citation2014; Meng et al. Citation2017; Niaz et al. Citation2021d). However, in literature, the authors are usually interested in varying drought categories (McKee et al. Citation1993; Bloomfield and Marchant Citation2013; Li et al. Citation2015; Caloiero and Veltri Citation2019; Niaz et al. Citation2020b; Yisehak and Zenebe Citation2021; Long Citation2021). Since the drought monitoring and mitigation policies have been using various drought categories for vulnerability and impact assessment (Niaz et al. Citation2022; Niaz et al. Citation2021b; Niaz et al. Citation2021c). Therefore, the information about various drought categories is crucial for the drought analysis and its assessment (Yisehak and Zenebe Citation2021; Long Citation2021). Hence, the use of LR is incapable to address the effect of varying drought categories on the seasonal drought frequency and drought persistence. Further, when policymakers are interested to make their policies based on several categories (more than two), hence merely the knowledge about only two drought categories is counterproductive for them. Further, knowledge for more than two drought categories can not be explicitly captured by LR. These issues underpin the application of a new method to investigate the impact of varying drought categories to identify the spatial pattern of drought in varying stations. Consequently, the POM is employed in the current research for finding the spatial and seasonal variations in the relationship between the one season's moisture conditions on moisture conditions in the forthcoming season. The MLE method is employed to estimate the POM. The POM is not used before in any research to recognize the spatial and seasonal variations in the relationship between the one period's moisture conditions on moisture conditions in the upcoming period. Therefore, the use of POM for the drought analysis is the fundamental approach and its outcomes provide the vigorous direction for finding spatial patterns of seasonal drought frequency and persistence and support for making valuable strategies for the early warning system, water resource management, and agriculture sectors in Pakistan.
5. Conclusion
Various seasons (Winter, Spring, Summer, and Autumn) are used in current analysis. The SPI-3 values obtained from selected seasons are used to classify varying drought categories of MD. The five drought categories are classified according to their thresholds for drought severity. Among the selected drought categories in various seasons and stations, ND category prevails. The ND occurrence in the winter season is found relatively high among other seasons in selected stations. In winter, the counts of ND for Rawalpindi and Faisalabad are between 118% to 125%. Likewise, the ND occurrence is substantially high in various stations and seasons. The behaviour of other drought categories is observed accordingly. Further, these ordinal drought categories are modelled under the set of CLM The calculation of the CLM is performed from the logit link function. Moreover, the BT is utilized to check the parallel line assumptions. The insignificant BT for parallel line assumptions favours that the odds ratios are the same across the numerous drought categories. It means the POM is an appropriate choice for the current analysis. Therefore, the current study uses POM to analyze the odds and PDP from one season to the next in the specific station and season by identifying the spatial pattern of SDF and SDP. The OR from the POM for the SDP of varying drought categories shows that the significant relationship between various seasons and SPI is negative in selected stations at a 5% level of significance. Moreover, we conclude that the current research is considerably progressed in terms of recognizing the spatial and inter-seasonal propagation in the relationship between the one period's moisture conditions on moisture conditions in the upcoming period. Furthermore, the present study is mainly employed to the present conditions and application site; however, in other climatic circumstances outcomes of the current research cannot be generalized. Thus, the impacts of the outcomes vary according to the climatological conditions, therefore, current outcomes can not be useful for the assessment of drought occurrence as climatology conditions of the regions vary. Moreover, the addition of other climatological indicators (temperature, soil moisture and runoff etc.) can considerably improve the proficiencies for drought monitoring and its persistence in the selected stations. The outcomes associated with the present research allow to take on more considerations on early warning systems and can be utilized for decision-making.
Consent for publication
The authors authorize the publication of this manuscript.
Consent to participate
The authors declare that this research would be used only for scientific research and would not be passed on to third parties.
Conflict of interest
The authors declare that they have no conflict of interest.
Disclosure statement
No potential conflict of interest was reported by the authors.
Additional information
Funding
References
- Abdel-Ghany SE, Ullah F, Ben-Hur A, Reddy AS. 2020. Transcriptome analysis of drought-resistant and drought-sensitive sorghum (Sorghum bicolor) genotypes in response to peg-induced drought stress. IJMS. 21(3):772.
- Ahmed K, Shahid S, Nawaz N. 2018. Impacts of climate variability and change on seasonal drought characteristics of Pakistan. Atmos Res. 214:364–374.
- Akbar M, Niaz R, Amjad M. 2020. Determinants of households’ food insecurity with severity dimensions in Pakistan: varying estimates using partial proportional odds model. Health Soc Care Commun. 28(5):1698–1709.
- Arabameri A, Chandra Pal S, Santosh M, Chakrabortty R, Roy P, Moayedi H. 2021. Drought risk assessment: integrating meteorological, hydrological, agricultural and socio-economic factors using ensemble models and geospatial techniques. Geocarto Int. 1–29.
- Ayantobo OO, Wei J. 2019. Appraising regional multi-category and multi-scalar drought monitoring using standardized moisture anomaly index (SZI): A water-energy balance approach. J Hydrol. 579:124139.
- Bachmair S, Svensson C, Prosdocimi I, Hannaford J, Stahl K. 2017. Developing drought impact functions for drought risk management. Nat Hazards Earth Syst Sci. 17(11):1947–1960.
- Badade M, Ramanathan TV. 2020. Probabilistic frontier regression model for multinomial ordinal type output data. J Prod Anal. 53(3):339–354.
- Balti H, Abbes AB, Mellouli N, Farah IR, Sang Y, Lamolle M. 2020. A review of drought monitoring with big data: Issues, methods, challenges and research directions. Ecol Inf. 60:101136.
- Beguería S, Vicente Serrano SM, Reig F, Latorre B. ‐ 2014. Standardized precipitation evapotranspiration index (SPEI) revisited: parameter fitting, evapotranspiration models, tools, datasets and drought monitoring. Int J Climatol. 34(10):3001–3023.
- Bhalme HN, Mooley DA. 1980. Large-scale droughts/floods and monsoon circulation. Mon Wea Rev. 108(8):1197–1211.
- Bloomfield JP, Marchant BP. 2013. Analysis of groundwater drought building on the standardised precipitation index approach. Hydrol Earth Syst Sci. 17(12):4769–4787.
- Bose AK, Gessler A, Bolte A, Bottero A, Buras A, Cailleret M, Camarero JJ, Haeni M, Hereş A-M, Hevia A, et al. 2020. Growth and resilience responses of Scots pine to extreme droughts across Europe depend on predrought growth conditions. Glob Chang Biol. 26(8):4521–4537.
- Caloiero T, Veltri S. 2019. Drought assessment in the Sardinia Region (Italy) during 1922–2011 using the standardized precipitation index. Pure Appl Geophys. 176(2):925–935.
- Chang TJ, Kleopa XA. 1991. A proposed method for drought monitoring 1. J Am Water Resources Assoc. 27(2):275–281.
- Chen L. 2012. Utilizing cumulative logit model and human computation on automated speech assessment. In Proceedings of the Seventh Workshop on Building Educational Applications Using NLP, June; p. 73–79.
- Chen N, Zhang Y, Song C, Xu M, Zhang T, Li M, Cong N, Zu J, Zheng Z, Ma G, et al. 2022. The chained effects of earlier vegetation activities and summer droughts on ecosystem productivity on the Tibetan Plateau. Agric Meteorol. 321:108975.
- Christensen RHB. 2015. Ordinal—regression models for ordinal data. R Package Version. 28:2015.
- Clausen B, Pearson CP. 1995. Regional frequency analysis of annual maximum streamflow drought. J Hydrol. 173(1-4):111–130.
- Deng L, Peng C, Kim DG, Li J, Liu Y, Hai X, … Kuzyakov Y. 2020. Drought effects on soil carbon and nitrogen dynamics in global natural ecosystems: A meta-analysis. Earth Sci Rev. 214:103501.
- Dikshit A, Pradhan B, Santosh M. 2022. Artificial neural networks in drought prediction in the 21st century–A scientometric analysis. Appl Soft Comput. 114:108080.
- Estrela T, Vargas E. 2012. Drought management plans in the European Union. The case of Spain. Water Resour Manage. 26(6):1537–1553.
- Fooladi M, Golmohammadi MH, Safavi HR, Singh VP. 2021. Application of meteorological drought for assessing watershed health using fuzzy-based reliability, resilience, and vulnerability. Int J Disaster Risk Reduct. 66:102616.
- Ford T, Labosier CF. 2014. Spatial patterns of drought persistence in the Southeastern United States. Int J Climatol. 34(7):2229–2240.
- Fraser ED, Simelton E, Termansen M, Gosling SN, South A. 2013. “Vulnerability hotspots”: Integrating socio-economic and hydrological models to identify where cereal production may decline in the future due to climate change induced drought. Agric for Meteorol. 170:195–205.
- Fu A, Li W, Chen Y, Wang Y, Hao H, Li Y, Sun F, Zhou H, Zhu C, Hao X. 2021. The effects of ecological rehabilitation projects on the resilience of an extremely drought-prone desert riparian forest ecosystem in the Tarim River Basin, Xinjiang, China. Sci Rep. 11(1):1–11.
- Gazol A, Camarero JJ, Sánchez‐Salguero R, Vicente‐Serrano SM, Serra‐Maluquer X, Gutiérrez E, Luis M, Sangüesa‐Barreda G, Novak K, Rozas V, et al. 2020. Drought legacies are short, prevail in dry conifer forests and depend on growth variability. J Ecol. 108(6):2473–2484.
- Gidey E, Dikinya O, Sebego R, Segosebe E, Zenebe A. 2018. Predictions of future meteorological drought hazard (∼ 2070) under the representative concentration path (RCP) 4.5 climate change scenarios in Raya, Northern Ethiopia. Model Earth Syst Environ. 4(2):475–488.
- Gommes R, Petrassi F. 1996. Rainfall variability and drought in sub-Saharan Africa. SD Dimensions, FAO.
- Goodwin D, Holman I, Pardthaisong L, Visessri S, Ekkawatpanit C, R, Vicario D. 2022. What is the evidence linking financial assistance for drought-affected agriculture and resilience in tropical Asia? A systematic review. Reg Environ Change. 22(1):1–13.
- Hamdy A, Trisorio-Liuzzi G. 2001. Drought planning and drought mitigation measures in the Mediterranean region.
- Harishnaika N, Ahmed SA, Kumar S, Arpitha M. 2022. Computation of the spatio-temporal extent of rainfall and long-term meteorological drought assessment using standardized precipitation index over Kolar and Chikkaballapura districts, Karnataka during 1951-2019. Remote Sens Appl Soc Environ. 27:100768.
- Hereher M, Alghmdi A, Mseddi K, El Kenawy A. 2022. Remote sensing of vegetation prolonged drought at the salt playas of Hail–Saudi Arabia. Egypt J Remote Sens Space Sci. 25(1):135–145.
- Iese V, Kiem AS, Mariner A, Malsale P, Tofaeono T, Kirono DG, Round V, Heady C, Tigona R, Veisa F, et al. 2021. Historical and future drought impacts in the Pacific islands and atolls. Clim Change. 166(1-2):1–24.
- Kaniewski D, Guiot J, Van Campo E. 2015. Drought and societal collapse 3200 years ago in the Eastern Mediterranean: A review. Wiley Interdiscip Rev Clim Change. 6(4):369–382.
- Khan N, Sachindra DA, Shahid S, Ahmed K, Shiru MS, Nawaz N. 2020. Prediction of droughts over Pakistan using machine learning algorithms. Adv Water Resour. 139:103562.
- Khanmohammadi N, Rezaie H, Behmanesh J. 2022. Investigation of drought trend on the basis of the best obtained drought index. Water Resour Manage. 36(4):1355–1375.
- Kutner MH, Nachtsheim CJ, Neter J, Li W. 2005. Applied linear statistical models.
- Lee J. 1992. Cumulative logit modelling for ordinal response variables: applications to biomedical research. Comput Appl Biosci. 8(6):555–562.
- Li X,He B, Quan X, Liao Z, Bai X. 2015. Use of the standardized precipitation evapotranspiration index (SP EI) to characterize the drying trend in southwest China from 1982–2012. Remote Sens. 7(8): 10917–10937.
- Liu Q, Shepherd BE, Li C, Harrell FE. Jr. 2017. Modeling continuous response variables using ordinal regression. Stat Med. 36(27):4316–4335.
- Liu Y, Zhou R, Wen Z, Khalifa M, Zheng C, Ren H, Zhang Z, Wang Z. 2021. Assessing the impacts of drought on net primary productivity of global land biomes in different climate zones. Ecol Indic. 130:108146.
- Long AL. 2021. Drought. Disturbance and Sustainability in Forests of the Western United States. 992.
- Marchionni V, Daly E, Manoli G, Tapper NJ, Walker JP, Fatichi S. 2020. Groundwater buffers drought effects and climate variability in urban reserves. Water Resour Res. 56(5):1–19.
- Mazhar N, Nawaz M, Mirza AI, Khan K. 2020. Socio-political impacts of meteorological droughts and their spatial patterns in Pakistan. South Asian Stud. 30(1):135–143.
- McCullagh P. 1980. Regression models for ordinal data. J Roy Stat Soc B. 42(2):109–127.
- McKee TB, Doesken NJ, Kleist J. 1993. The relationship of drought frequency and duration to time scales. In Proceedings of the 8th conference on applied climatology, January. Vol. 17, No. 22, p. 179–183. Boston, MA: American Meteorological Society.
- McKinley TJ, Morters M, Wood JL. 2015. Bayesian model choice in cumulative link ordinal regression models. Bayesian Anal. 10(1):1–30.
- Meng L, Ford T, Guo Y. 2017. Logistic regression analysis of drought persistence in East China. Int J Climatol. 37(3):1444–1455.
- Meza I, Siebert S, Döll P, Kusche J, Herbert C, Eyshi Rezaei E, Nouri H, Gerdener H, Popat E, Frischen J, et al. 2020. Global-scale drought risk assessment for agricultural systems. Nat Hazards Earth Syst Sci. 20(2):695–712.
- Mirakbari M, Ganji A, Fallah SR. 2010. Regional bivariate frequency analysis of meteorological droughts. J Hydrol Eng. 15(12):985–1000.
- Mlenga DH, Jordaan AJ, Mandebvu B. 2019. Integrating standard precipitation index and normalised difference vegetation index for near-real-time drought monitoring in Eswatini. Jàmbá: J Dis Risk Stud. 11(1):1–9.
- Moghimi MM, Zarei AR. 2021. Evaluating performance and applicability of several drought indices in arid regions. Asia-Pacific J Atmos Sci. 57(3):645–661.
- Nalbantis I, Tsakiris G. 2009. Assessment of hydrological drought revisited. Water Resour Manage. 23(5):881–897.
- Nawaz Z, Li X, Chen Y, Guo Y, Wang X, Nawaz N. 2019. Temporal and spatial characteristics of precipitation and temperature in Punjab, Pakistan. Water. 11(9):1916.
- Niaz R, Almanjahie IM, Ali Z, Faisal M, Hussain I. 2020b. A Novel Framework for Selecting Informative Meteorological Stations Using Monte Carlo Feature Selection (MCFS) Algorithm. Adv Meteorol. 2020:1–13.
- Niaz R, Almazah MMA, Hussain I, Filho JDP. 2021a. A new framework to substantiate the prevalence of drought intensities. Theor Appl Climatol. 147(3–4):1079–1012.
- Niaz R, Almazah MMA, Hussain I, Filho JDP, Al-Ansari N, Sh Sammen S. 2022. Assessing the probability of drought severity in a homogenous region. Complexity. 2022:1–8.
- Niaz R, Almazah M, Zhang X, Hussain I, Faisal M. 2021c. Prediction for various drought classes using spatiotemporal categorical sequences. Complexity. 2021:1–11.
- Niaz R, Hussain I, Ali Z, Faisal M. 2021e. A novel framework for regional pattern recognition of drought intensities. Arab J Geosci. 14(16):1–16.
- Niaz R, Hussain I, Ali Z, Faisal M, Elashkar EE, Shoukry AM, … Al-Deek FF. 2020b. A novel spatially weighted accumulative procedure for regional drought monitoring. Tellus A Dyn Meteorol Oceanogr. 72(1):1–13.
- Niaz R, Hussain I, M, Ali Z, Faisal M, Shoukry AM, Elashkar EE, Gani S, Fares FA. 2020a. A novel spatially weighted accumulative procedure for regional drought monitoring. Tellus A Dyn Meteorol Oceanogr. 72(1):1838194.
- Niaz R, Hussain I, Zhang X, Ali Z, Elashkar EE, Khader JA, Soudagar SS, Shoukry AM. 2021f. Prediction of drought severity using model-based clustering. Math Prob Eng. 2021:1–10.
- Niaz R, Zhang X, Ali Z, Hussain I, Faisal M, Elashkar EE, Khader JA, Soudagar SS, Shoukry AM, Al-Deek FF. 2021b. A new propagation-based framework to enhance competency in regional drought monitoring. Tellus A: Dyn Meteorol Oceanogr. 73(1):1975404–1975412.
- Niaz R, Zhang X, Iqbal N, Almazah M, Hussain T, Hussain I. 2021d. Logistic regression analysis for spatial patterns of drought persistence. Complexity. 2021:1–13.
- Orimoloye IR, Belle JA, Ololade OO. 2021. Drought disaster monitoring using MODIS derived index for drought years: A space-based information for ecosystems and environmental conservation. J Environ Manage. 284:112028.
- Palmer WC. 1965. Meteorological drought (Vol. 30). US Department of Commerce, Weather Bureau.
- Palmer WC. 1968. Keeping track of crop moisture conditions, nationwide: the new Crop Moisture Index. Weatherwise. 21(4):156–161.
- Payab AH, Türker U. 2019. Comparison of standardized meteorological indices for drought monitoring at northern part of Cyprus. Environ Earth Sci. 78(10):1–19.
- Peng CYJ, Lee KL, Ingersoll GM. 2002. An introduction to logistic regression analysis and reporting. J Educ Res. 96(1):3–14.
- Peterson B, Harrell FE. Jr. 1990. Partial proportional odds models for ordinal response variables. J Roy Stat Soc Ser C Appl Stat. 39(2):205–217.
- Puletti N, Mattioli W, Bussotti F, Pollastrini M. 2019. Monitoring the effects of extreme drought events on forest health by Sentinel-2 imagery. J Appl Rem Sens. 13(02):1.
- Raev I, Rosnev B. 2018. The impact of drought on natural forest ecosystems. In Drought in Bulgaria. England, UK: Routledge, 117–136.
- Ragab R, Hamdy A. 2004. Water management strategies to combat drought in the semiarid regions. Water Management for Drought Mitigation in the Mediterranean. Centre International de Hautes Etudes Agronomiques Méditerranéennes, Tecnomack–Bari, Italy. 47–112.
- Rodziewicz D, Dice J. 2020. Drought risk to the agriculture sector. Econ Rev. 105(2).
- Rojas O. 2021. Next generation agricultural stress index system (ASIS) for agricultural drought monitoring. Remote Sens. 13(5):959.
- Sabagh AE, Hossain A, Islam MS, Barutcular C, Hussain S, Hasanuzzaman M, … Saneoka H. 2019. Drought and salinity stresses in barley: consequences and mitigation strategies. Aust J Crop Sci. 13(6):810–820.
- Salmoral G, Ababio B, Holman IP. 2020. Drought impacts, coping responses and adaptation in the UK outdoor livestock sector: insights to increase drought resilience. Land. 9(6):202.
- Savari M, Damaneh HE, Damaneh HE. 2022. Drought vulnerability assessment: solution for risk alleviation and drought management among Iranian farmers. Int J Disaster Risk Reduct. 67:102654.
- Savari M, Shokati Amghani M. 2021. Factors influencing farmers' adaptation strategies in confronting the drought in Iran. Environ Dev Sustain. 23(4):4949–4972.
- Schuldt B, Buras A, Arend M, Vitasse Y, Beierkuhnlein C, Damm A, Gharun M, Grams TE, Hauck M, Hajek P, et al. 2020. A first assessment of the impact of the extreme 2018 summer drought on Central European forests. Basic Appl Ecol. 45:86–103.
- Shafer BA, Dezman LE. 1982. Development of surface water supply index (SWSI) to assess the severity of drought condition in snowpack runoff areaS. Proceeding of the Western Snow Conference, January.
- Siadaty MS, Shu J. 2004. Proportional odds ratio model for comparison of diagnostic tests in meta-analysis. BMC Med Res Methodol. 4(1):1–13.
- Stephan R, Erfurt M, Terzi S, Žun M, Kristan B, Haslinger K, Stahl K. 2021. An inventory of Alpine drought impact reports to explore past droughts in a mountain region. Nat Hazards Earth Syst Sci. 21(8):2485–2501.
- Syed A, Liu X, Moniruzzaman M, Rousta I, Syed W, Zhang J, Olafsson H. 2021. Assessment of climate variability among seasonal trends using in situ measurements: a case study of Punjab, Pakistan. Atmosphere. 12(8):939.
- Tariq M, Ahmad S, Fahad S, Abbas G, Hussain S, Fatima Z, Hoogenboom G. 2018. The impact of climate warming and crop management on phenology of sunflower-based cropping systems in Punjab, Pakistan. Agric Forest Meteorol. 256:270–282.
- Uwimbabazi J, Jing Y, Iyakaremye V, Ullah I, Ayugi B. 2022. Observed changes in meteorological drought events during 1981–2020 over Rwanda, East Africa. Sustainability. 14(3):1519.
- Van Rooy MP. 1965. A rainfall anomally index independent of time and space, NOTOS.
- Wang L, Zhang J, Elmahdi A, Shu Z, Wu Y, Wang G. 2022. Evolution characteristics and relationship of meteorological and hydrological droughts from 1961 to 2018 in Hanjiang River Basin, China. J Water Clim Change. 13(1):224–246.
- Weghorst KM. 1996. The Reclamation Drought Index: guidelines and practical applications. Denver, CO: Bureau of Reclamation.
- Wilhite DA. 2000. Drought as a natural hazard: concepts and definitions.
- Wu D, Vargas G G, Powers JS, McDowell NG, Becknell JM, Pérez-Aviles D, Medvigy D, Liu Y, Katul GG, Calvo-Alvarado JC, et al. 2022. Reduced ecosystem resilience quantifies fine‐scale heterogeneity in tropical forest mortality responses to drought. Glob Chang Biol. 28(6):2081–2094.
- Yisehak B, Zenebe A. 2021. Modeling multivariate standardized drought index based on the drought information from precipitation and runoff: a case study of Hare watershed of Southern Ethiopian Rift Valley Basin. Model Earth Syst Environ. 7(2):1005–1017.
- Zarei AR. 2019. Analysis of changes trend in spatial and temporal pattern of drought over south of Iran using standardized precipitation index (SPI). SN Appl Sci. 1(5):1–14.
- Zarei AR, Shabani A, Moghimi MM. 2021. Accuracy assessment of the SPEI, RDI and SPI drought indices in regions of Iran with different climate conditions. Pure Appl Geophys. 178(4):1387–1403.
- Zhang A, Jia G. 2013. Monitoring meteorological drought in semiarid regions using multi-sensor microwave remote sensing data. Remote Sens Environ. 134:12–23.
- Zhang T, Su X, Zhang G, Wu H, Wang G, Chu J. 2022. Evaluation of the impacts of human activities on propagation from meteorological drought to hydrological drought in the Weihe River Basin. Sci Total Environ. 819:153030.
- Zhao M, Huang S, Huang Q, Wang H, Leng G, Xie Y. 2019. Assessing socio-economic drought evolution characteristics and their possible meteorological driving force. Geomatics Nat Hazards Risk. 10(1):1084–1101.
- Ziolkowska JR. 2016. Socio-economic implications of drought in the agricultural sector and the state economy. Economies. 4(4):19.